Five Reasons Why Not Every Peak Shift in Infrared (IR) Spectra Indicates a Chemical Structure Change
Spectroscopic literature often conveys the impression that peak shifts are generally related to structural changes on the molecular or unit cell level. Here, we discuss several situations in which peaks shift for reasons unrelated to chemical structural changes. To avoid misinterpretations, a practitioner should be aware of these reasons.
When you are a student and learn about spectroscopic theory, you are told that every peak shift in an infrared (IR) or ultraviolet-visible (UV-vis) spectrum is related to changes in chemical structure or chemical composition. However, this important lesson sometimes does not hold up in the first few months that you start working on your bachelors, masters, or PhD thesis. The latter happened to one of us when working on two isostructural compounds for a thesis. In one of these isostructural compounds, a heavy element was replaced by a much lighter one. Based on the accepted theory, the expectation was that only some peaks should be blueshifted, because they are related to vibrations of the heavier and lighter element. However, when the spectra were recorded, it was a shock to see that nearly all peaks were blueshifted, and X-ray diffraction (XRD) confirmed that the two samples where chemically isostructural. This raises an important question: What was the reason behind this phenomenon?
Peak Shifts Are Consequences of Increased Oscillator Strength and Molar Concentration
Spectroscopic theory, as we know it today, is a simplified version of a merger of wave optics and dispersion theory, where the wave properties of light were removed to make it easily digestible (1). When Hendrik Antoon Lorentz and Max Planck worked to understand dispersion based on the damped harmonic oscillator model, it was clear to them, for example, that peaks shift with oscillator strength (2,3). The damped harmonic oscillator model, often called the Lorentz oscillator model, generates a peak in the absorption index spectrum that blue-shifts with increasing oscillator strength and molar concentration, whereas the oscillator position (the band position) remains fixed (4). The Lorentz oscillator model is not common knowledge because Lorentz also derived the Lorentz profile, the peak of which does not shift because of some approximations (2,5). In academic curriculum, only the Lorentz profile is consistently taught. The approximations are usually valid for weak oscillators, but easily noticeable, for example, for the C=O vibration, where it is of the order of 5 cm-1. This might seem hardly worth mentioning, but the oscillators in inorganic materials are much stronger and as a result, so are the corresponding shifts.
Why should we care about shifts that we might not even be able to see in spectra? Because nowadays, techniques are in use like 2D-correlation spectroscopy (2D-COS), principal component analysis (PCA), or multiple curve resolution (MCR) (6,7). Even if you do not see shifts in conventional spectra, these techniques are so sensitive that they will show the resulting nonlinearities (8). Accordingly, in experimental spectra, because you will always get an asynchronous spectrum in 2D-COS, you will always detect more principal components by PCA than you have chemical components, even in ideal systems. Meanwhile, MCR will help you to find components that are often nothing but a mere linear combination of the spectra of the real components, which indicates nothing but nonlinearities caused by peak shifts and deviations from Beer’s law.
Peak Shifts as a Consequence of the Polarization of Matter by Light
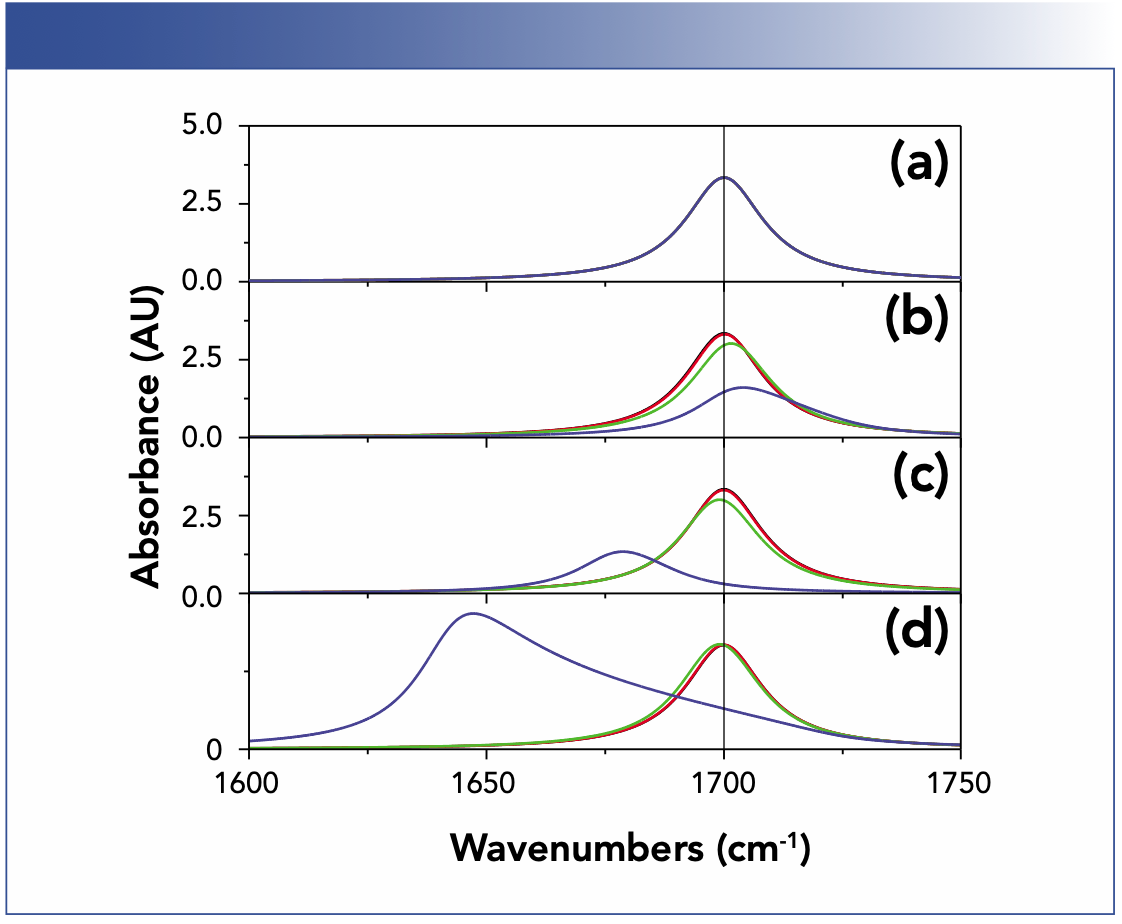
Sometimes these shifts are cancelled by an effect known by Lorentz and Planck (2,9). When light hits matter, the latter becomes polarized. As a consequence, the local electric field is not the one externally applied (it is the same effect you know from capacitors). For example, these local fields lead to increasing redshifts if you put your solute in different solvents with increasing refractive index or dispersion strength (10,11). Figure 1 displays a comparison between the Lorentz profile, a Lorentz oscillator, and this effect for various concentrations. The same is observed when changing from potassium bromide (KBr) to cesium iodide (CsI) and finally to silver bromide (AgBr) as a matrix material for the pellet technique (12). This transformation occurs because of an interaction that is induced by light and vanishes if switched off, which is a macroscopic manifestation of the uncertainty principle: By observation, you change what you want to see.
FIGURE 1: Peak shifts modelled for different concentrations with the constant c·d = 5·103 cm·mol/L. Shown here is (a) Lorentz profile, (b) Lorentz oscillator, (c) uncoupled oscillator assuming that light induces polarization, and (d) coupled oscillator assuming that induces polarization. The oscillator has an oscillator strength typical of a C=O vibration (10). Note that the black and red trace overlap and all curves in case of (a). Note concentrations shown (in mol/L) are: (black) 0.05, (red) 0.5, (green) 5, and (blue) 50.

Peak Shifts as a Consequence of the Influence of the Refractive Index on Spectra
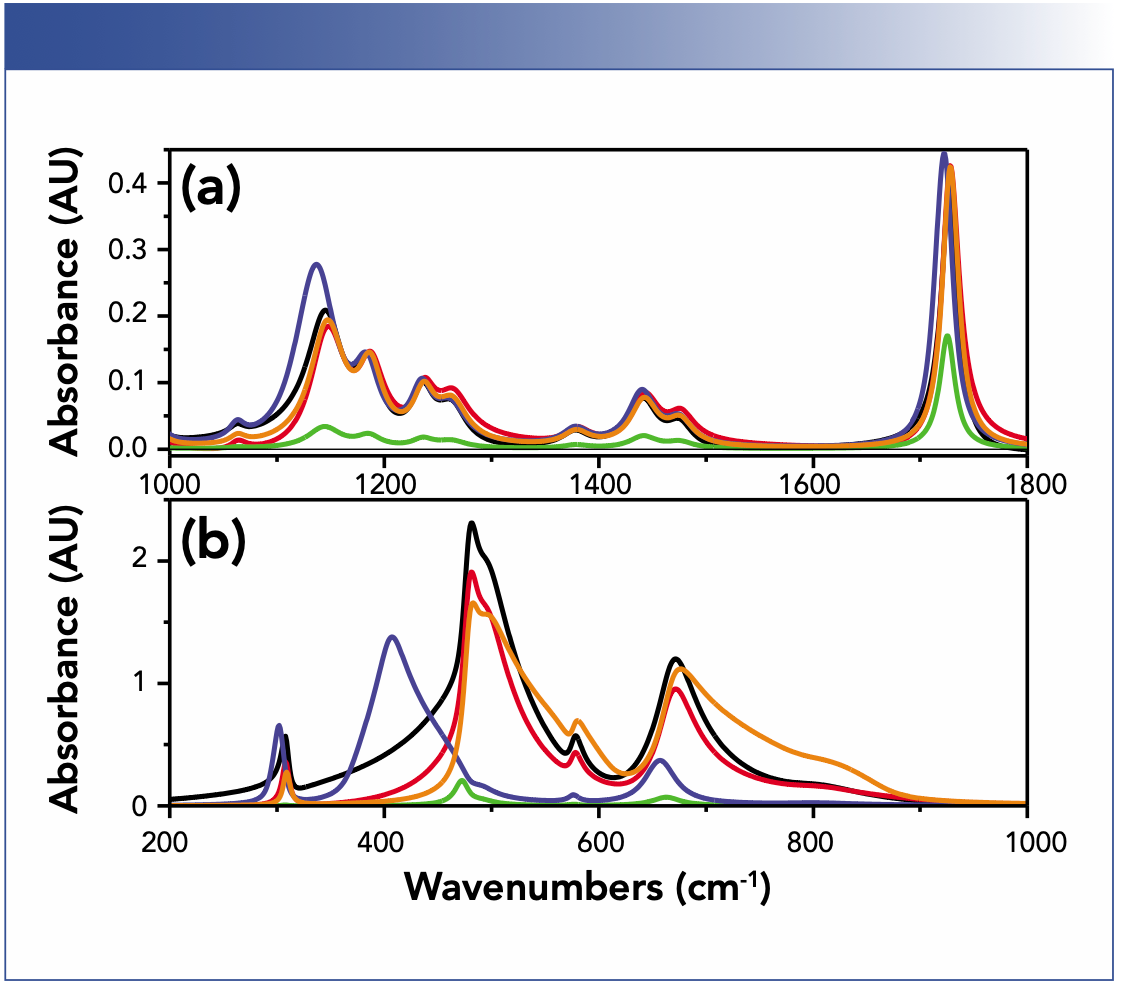
Comparably strong redshifts that are not related to matrix effects, but are also because of the influence of the refractive index, this time not of the embedding, but of the incidence medium and the sample, occur for attenuated total reflection (ATR) (4,13). In the case of ATR, the absorbance is modulated by the refractive index dispersion of the sample. Because the refractive index has a maximum redshifted relative to that of the maximum of the absorption index, the absorbance maximum is also redshifted, easily by 10 cm-1 and more, even for organic substances if you use the very common combination of a zinc selenide (ZnSe) ATR crystal with an angle of incidence of 45° (4). Note that the shift scales again with oscillator strength, which means that for mixtures the shift increases with concentration because it is often combined with the one resulting from local field effects. To avoid corresponding problems, you can either use a high index incidence medium like germanium at a high angle of incidence, which only gives problems with inorganic materials. As long as the critical angle of the sample is always lower than the incidence angle of your accessory, you can also correct the problem with an advanced ATR correction procedure, or, with an even more advanced procedure, which lets you determine the optical constants of your sample, but this requires use of a polarizer (4). Figure 2 compares the influence of the sample geometry, technique, and substrate on absorbance spectra.
FIGURE 2: Comparison of the influence of sample geometry, technique, and substrate on absorbance spectra of (a) poly(methyl methacrylate) (PMMA), and (b) spinel (inorganic material). Film thicknesses for layers on calcium fluoride (CaF2) and silicon substrates are 1 μm and 500 nm for gold (Au); in these cases, wave interference is at play. For attenuated total reflection (ATR) the film thickness is much larger than the effective thickness to reflect only effects introduced by the ATR technique (4). Key to spectra are (black) calcium fluoride, (red) silicon, (green) gold, (blue). (a): ATR ZnSe 45°-s; (b) ATR germanium 60°-s, (orange) true absorbance.

Peak Shifts as a Consequence of the Wave Nature of Light and Interference Effects
Quite often, samples consist of layers on substrates. It seems to be clever to use refractive-index matched substrates to avoid interference effects within the layers (which change the internal fields from the ones applied), but because absorption is accompanied by refractive index changes, this approach can easily fail, particularly for thinner layers (4 μm or less in case of calcium fluoride) (14). If you use a highly reflecting substrate, like a low-e glass or a metal-coated substrate, the interference effects can be so strong that not only the peaks can shift by 25 cm-1 or more, but new peaks not directly related to vibrations may emerge (15,16). New peaks emerge because the product of electric field intensity and absorptivity because of a neighboring peak is particularly high. Such interference effects are not restricted to layers—for example, they also exist in spheres (17). Correspondingly, Mie scattering-related effects in heterogeneous samples do not only generate disturbing baselines, but also cause interference-related shifts in spectra. Keep in mind that just getting rid of ripples or fringes in the baseline does not correct the shifts in your spectra!
Peak Shifts as a Consequence of Anisotropy and the Continuity Relations of the Electric Field at Interfaces
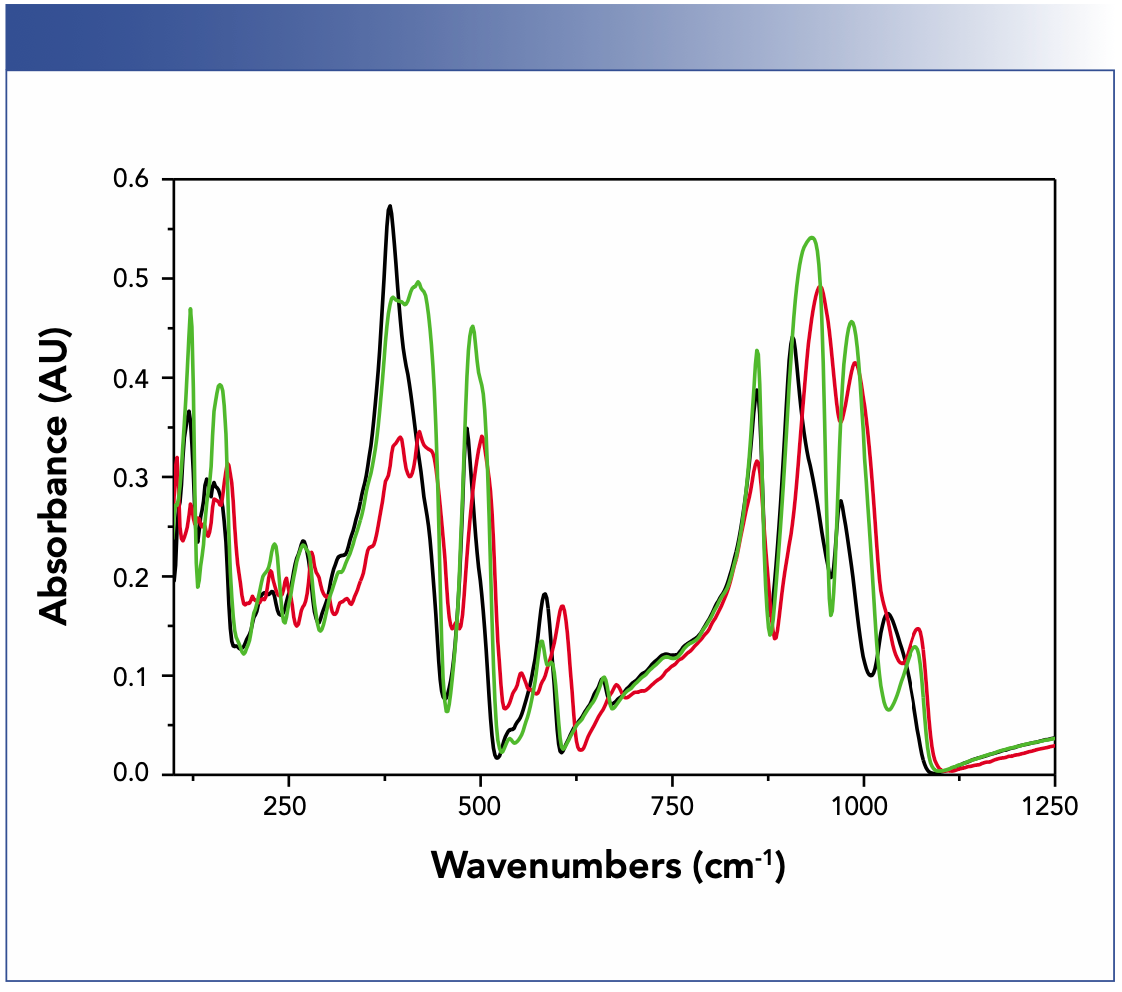
A last effect that we will touch upon that causes shifts in spectra is anisotropy. This may be surprising, but the signal in your spectrum does not only depend of the orientation of the transition moment relative to the polarization direction, as you usually hear. The orientation of the transition moment relative to the interface is also important because this orientation can cause shifts (1,18,19). Why? Because if the transition moment is perpendicular to the surface, then the transmittance or reflectance does not depend on the dielectric function, but on its inverse (this is a consequence of the continuity relations of the electric field between two different media). The maximum in the spectrum is, therefore, at the minimum in the dielectric function, which is always blueshifted. For organic materials this shift is usually 5 cm-1 or smaller, but for inorganic materials a shift of 50 cm-1 is nothing out of the ordinary (1). Actually, this was also the case for the example we mentioned in the beginning—have a look at Figure 3. Funnily enough, these two samples were randomly oriented polycrystalline samples, but it was nevertheless an effect related to the anisotropy of the individual crystallites and how orientation averaging takes place. The latter is different if the crystallites are small or large compared to the resolution limit, which causes the blueshifts. The simple (but not always cheap) solution is to use the corresponding single crystals instead.
FIGURE 3: Reflectance spectra of randomly oriented, polycrystalline fresnoite (Ba2TiSi2O8) and strontium fresnoite (Sr2TiSi2O8) with crystallites small and large compared to the resolution limit of IR light. Key to spectra are (black) small polycrystalline fresnoite, (red) large polycrystalline strontium fresnoite, (green) large polycrystalline fresnoite.

From the potpourri of examples that we presented, you get a good impression of the many different effects that can be at work, sometimes in combination, and that you may have to correct before you can interpret remaining peak shifts in the classical way. In principle, such a correction is adequate with the determination of the optical constants of a sample, which can require significant effort at times. Before we close, a word of caution: At the moment, many exciting innovations are becoming available, such as new modalities with which you can record spectra via surprising ways like photothermal IR upon quantum cascade laser irradiation, but we are still investigating the resulting consequences of the new measurement schemes or radiation sources. However, we can say that all effects described in this paper will stay, but additional ones will be introduced.
References
(1) T.G. Mayerhöfer, Wave Optics in Infrared Spectroscopy. DOI: 10.13140/ RG.2.2.14293.55520: 2021.
(2) H.A. Lorentz, Koninkl. Ned. Akad. Wetenschap. Proc. 8, 591–611 (1906).
(3) M. Planck, Sitzungsberichte der K ̈oniglich Preussischen Akademie der Wissenschaften, 24, 480–498 (1903).
(4) T.G. Mayerhöfer, S. Pahlow, and J. Popp, Chem. Phys. Chem. 21(18), 2029–2046 (2020).
(5) T.G. Mayerhöfer and J. Popp, Chem. Phys. Chem. 20(1), 31–36 (2019).
(6) I. Noda and Y. Ozaki, Two-Dimensional Correlation Spectroscopy: Applications in Vibrational and Optical Spectroscopy (Wiley, New York, New York, 2005).
(7) T. Hasegawa, Quantitative Infrared Spectroscopy for Understanding of a Condensed Matter (Springer, Tokyo, Japan, 2017).
(8) T.G. Mayerhöfer, O. Ilchenko, A. Kutsyk, and J. Popp, Beyond Beer’s law: Ideal binary liquid mixtures. submitted 2021.
(9) M. Planck, Sitzungsberichte der K ̈oniglich Preussischen Akademie der Wissenschaften zu Berlin 24, 470–494 (1902).
(10) T.G. Mayerhöfer and J. Popp, Chem. Phys. Chem. 21, 1218–1223 (2020).
(11) A. Kundt, Annalen der Physik 240(5), 34–54 (1878).
(12) S. Hayashi and H. Kanamori, J. Phys. C Solid State Phys. 13(8), 1529 (1980).
(13) L.A. Averett, P.R. Griffiths, and K. Nishikida, Anal. Chem. 80(8), 3045–3049 (2008).
(14) T.G. Mayerhöfer, S. Pahlow, U. Hübner, and J. Popp, Anal. Chem. 92(13), 9024–9031 (2020).
(15) T.G. Mayerhöfer and J. Popp, Spectrochimica Acta Part A. 191, 283–289 (2018).
(16) T.G. Mayerhöfer, S. Pahlow, U. Hübner, and J. Popp, Analyst 143(13), 3164–3175 (2018).
(17) T.G. Mayerhöfer, S. Höfer, and J. Popp, Phys. Chem. Chem. Phys. 21(19), 9793–9801 (2019).
(18) T.G. Mayerhöfer, Chem. Phys. Chem. 19(17), 2123–2130 (2018).
(19) F. Matossi and F. Dane, Zeitschrift für Physik 45(7), 501–507 (1927).
Thomas G. Mayerhöfer and Christoph Krafft are with the Leibniz Institute of Photonic Technology (IPHT), in Jena, Germany, and the Institute of Physical Chemistry and Abbe Center of Photonics at Friedrich Schiller University, in Jena, Germany. Direct correspondence to: Thomas.Mayerhoefer@leibniz-ipht.de

Smarter Sensors, Cleaner Earth Using AI and IoT for Pollution Monitoring
April 22nd 2025A global research team has detailed how smart sensors, artificial intelligence (AI), machine learning, and Internet of Things (IoT) technologies are transforming the detection and management of environmental pollutants. Their comprehensive review highlights how spectroscopy and sensor networks are now key tools in real-time pollution tracking.
AI Shakes Up Spectroscopy as New Tools Reveal the Secret Life of Molecules
April 14th 2025A leading-edge review led by researchers at Oak Ridge National Laboratory and MIT explores how artificial intelligence is revolutionizing the study of molecular vibrations and phonon dynamics. From infrared and Raman spectroscopy to neutron and X-ray scattering, AI is transforming how scientists interpret vibrational spectra and predict material behaviors.
Real-Time Battery Health Tracking Using Fiber-Optic Sensors
April 9th 2025A new study by researchers from Palo Alto Research Center (PARC, a Xerox Company) and LG Chem Power presents a novel method for real-time battery monitoring using embedded fiber-optic sensors. This approach enhances state-of-charge (SOC) and state-of-health (SOH) estimations, potentially improving the efficiency and lifespan of lithium-ion batteries in electric vehicles (xEVs).