Solid Physical State Transformation in Hot Melt Extrusion Revealed by Inline Near-Infrared (NIR) Spectroscopy and Offline Terahertz (THz) Raman Imaging
In this article, inline monitoring of active pharmaceutical ingredient (API) crystallinity by Fourier transform near-infrared (FT-NIR) during a hot melt extrusion process is described. The area of the peak at 6100 cm-1 was used to track the transitions between different solid dispersions during a hot melt extrusion in real time. The NIR observations are further corroborated by an offline terahertz (THz) Raman imaging analysis. Overall, both high process temperature and high screw speed are conducive to the formation of amorphous acetaminophen (APAP) dispersions, but temperature appears to more directly impact the formation of the most desired amorphous dispersion. FT-NIR is effective in providing real-time information on the solid physical state transformation, but through bulk measurements. Raman microscopy complements FT-NIR by offering direct visualization of the spatial distributions of different solid physical states of the API.
Hot melt extrusion (HME) is gaining increased interest in the pharmaceutical industry because of its high manufacturing efficiency and economic benefits. HME has been utilized to develop versatile dosage forms, especially for poorly soluble active pharmaceutical ingredients (API) (1–3). In an HME process, APIs are compounded with thermoplastic polymers and extruded to form solid dispersion. The polymer matrix acts as a solid solvent for the drug molecules. Amorphous API dispersions in a polymer matrix at the molecular level is highly desirable because the drug is in a dissolved molecular state with no lattice energy to overcome prior to dissolution. Furthermore, amorphous API dispersions can provide a physical barrier to recrystallization or aggregation of drug particles and reduce the risk of physical change post-manufacture.
To ensure the consistency and the product quality, it is imperative to have a thorough understanding of the critical process parameters, such as screw design, rotational speed, and zone temperature, in real time as well as their impact on the quality of the final products. To that end, Fourier transform near-infrared (FT-NIR) spectroscopy in conjunction with multivariate analysis (MVA) techniques have long been used as an in-process analytical tool to provide molecular level chemical information through direct measurements of the material being processed (4–6). Recently, Repka and others reported the successful implementation of FT-NIR for inline API concentration and process stability monitoring during HME processes (7,8).
Another integral part of the overall HME process design and optimization is characterizing the solid physical state of extrudates (amorphous, crystalline, or partially amorphous), which provides critical information on product stability during shelf life, crystallization propensity, drug dissolution, and drug bioavailability, as well as process efficiency (2). Previously, we reported a method employing terahertz (THz) Raman imaging to characterize the solid state of the acetaminophen (APAP) within a solid dispersion prepared by HME (9). The low-frequency Raman shift region of ≤ 6 THz or ≤ 200 cm-1, commonly referred to as the THz region, is sensitive to the variations in crystal structures, such as lattice form and orientation. Therefore, THz Raman spectroscopy readily identifies different polymorphs of APIs and monitors API crystallization and dissolution processes (10–12).
In this article, we describe the use of inline FT-NIR to characterize the solid physical states transformation of acetaminophen (APAP) in hydroxypropyl methylcellulose (HPMC) matrix prepared by HME. By tracking the changes in the peak area associated with crystalline APAP during HME, the underlying transitions between different solid dispersions under different process conditions are rationalized. The FT-NIR data is further corroborated by an offline THz Raman imaging analysis.
Materials and Methods
Acetaminophen (APAP) (Spectrum Chemicals), a crystalline biopharmaceutics classification system (BCS) I drug with a melting point of 169°–170 °C, was chosen as the model API. Hydroxypropyl methylcellulose (HPMC) (Ashland) E5 grade, a common hydrophilic matrix material for amorphous solid dispersions, was used as the polymer matrix.
Hot-Melt Extrusion
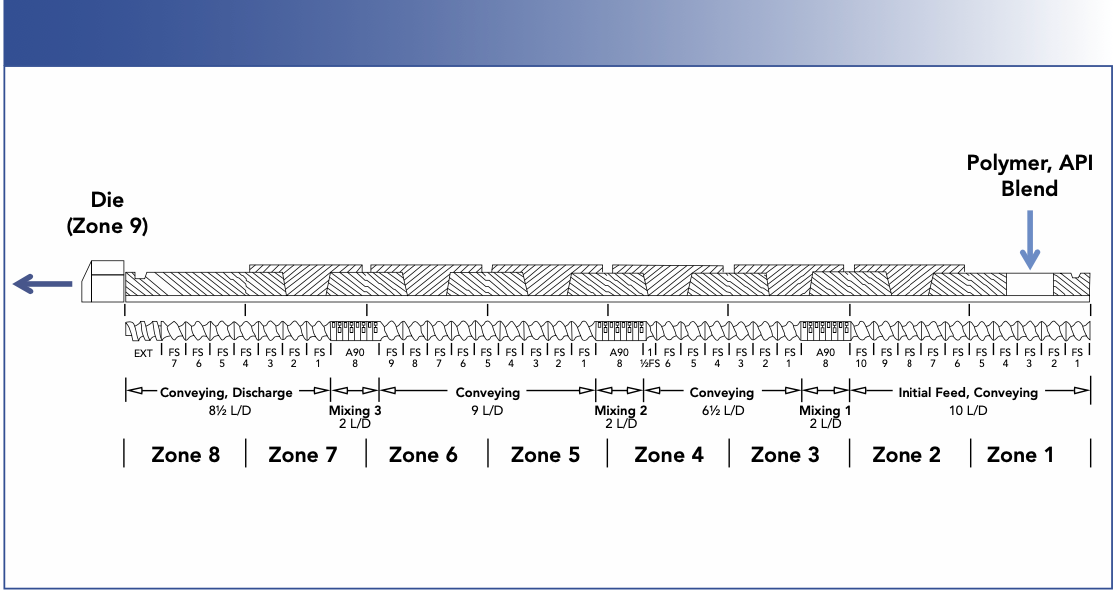
An 11-mm twin-screw extruder, Thermo Scientific Process 11 was used for the HME processes. Figure 1 is a schematic showing the screw profile design as well as the process configuration. APAP and HPMC were tumbling mixed for 30 min before fed into the extruder at the Zone 1 position. The Zones 2 through 8 were mixing, conveying and discharge zones. The Zone 9 is a die that reduces the barrel configuration to a single circular orifice with 5 mm in diameter.
FIGURE 1: Schematic of a Process 11 twin screw extruder configured in this study.
The blending ratio of APAP and HPMC was 30:70 (w/w). Four different HME processes were performed with two different screw speeds at two different temperatures, as shown in Table I. For each HME process, after the extrusion reached the steady state, the extrudates from the die (zone 9) was collected and pressed into thin films using a hydraulic press with heating panels at 40 °C to be analyzed by Raman imaging.

FT-NIR Spectra Collection
A Thermo Scientific Antaris II MDS FT-NIR spectrometer equipped with a diffuse reflectance probe was used for spectral acquisition. The probe and a metal reflector were screwed opposite into the sensor ports of the die (zone 9) with a gap of 4 mm. NIR spectra were collected every 20 s with the spectral range of 4000–10,000 cm-1, 8 cm-1 spectral resolution, and 16 scans were co-added (8 s scan time). FT-NIR data acquisition was performed using the Thermo Scientific Result v3 software package. Data processing and modeling was performed using the Thermo Scientific TQ Analyst software.
FT-NIR Spectral Peak Area Calculation
To track the polymorphous change of APAP during the extrusion processes, the spectral peak at 6100 cm-1 was chosen as the indicator for crystalline APAP. All spectral data was first processed with 11-data point and third-order Savitzky–Golay smoothing. The peak area was then integrated between 6055.39–6124.81 cm-1 with a two-point baseline correction.
Raman Spectroscopy and Raman Imaging
Raman spectroscopy and Raman imaging were performed using a Thermo Scientific DXR3xi Raman imaging microscope, using a 532 nm laser operated at 8 mW power at the sample. Data acquisition and processing were carried out using the Thermo Scientific OMNICxi software.
Raman images were obtained by the Correlation Profiling option of the OMNICxi software, using the THz region (≤ 200 cm-1) of the crystalline APAP Raman spectrum as a reference. The correlation profile shows the correlation between the spectrum at each pixel (sampling point) in the Raman image and the specified reference spectrum. Each color in the rainbow-colored intensity scale represents a degree of correlation with the reference spectrum. The higher the intensity value, the greater similarity to the reference spectrum. A value of 1.0 indicates that the sample spectrum and reference spectrum are identical and is displayed as red. For the purpose of direct comparison, a correlation range of 0.75–1 were applied to all the Raman images.
Results
As shown in Figure 2, all FT-NIR spectra have strong features in the first overtone C–H stretching region around 6000 cm-1. The amorphous and crystalline APAP, however, are noticeably different (Figure 2). The crystalline APAP spectrum has a sharp peak around 6100 cm-1, whereas the amorphous APAP has a broad feature around 6600 cm-1.
FIGURE 2: (top) FT-NIR spectra acquired during the extrusion processes. (bottom) FT-NIR spectra of amorphous and crystalline APAP.
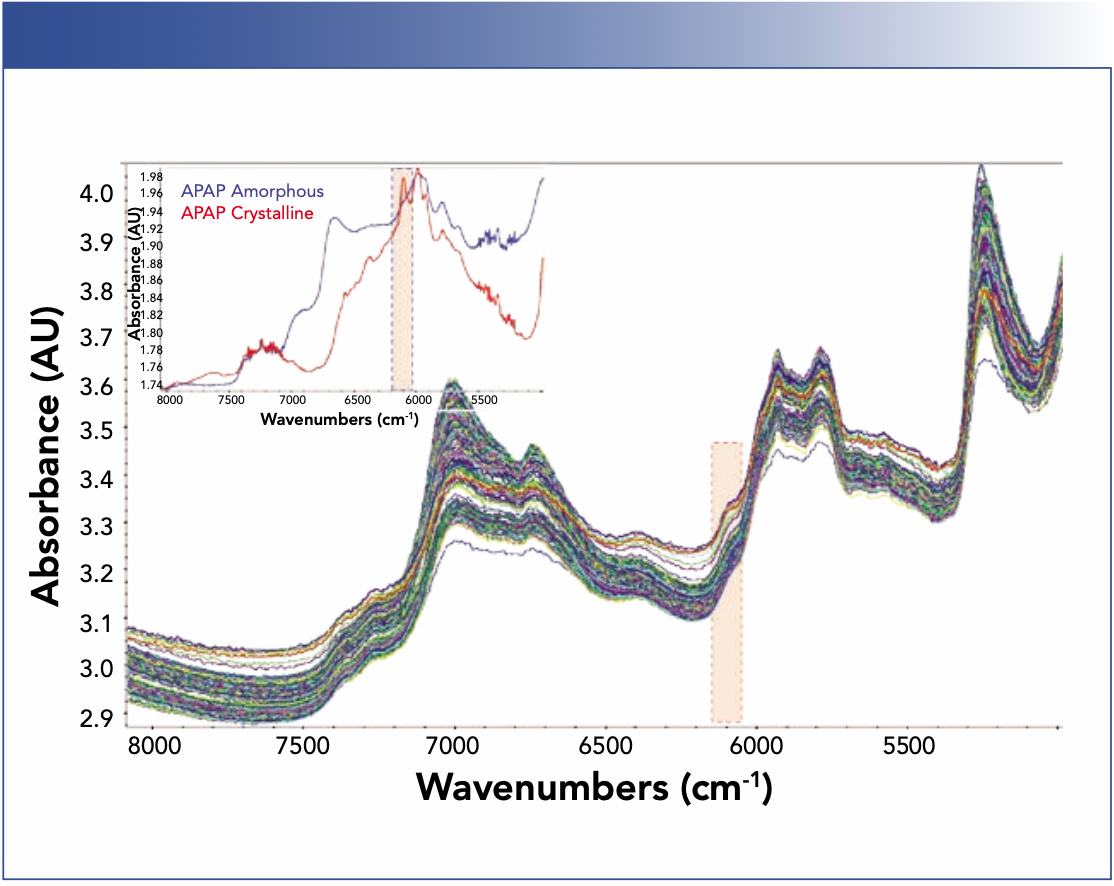
Spectral peak wavelengths are predominately determined by molecular structures, interactions among molecules, as well as their environment, and peak intensities are often proportional to component concentrations. Therefore, the area of crystalline APAP peak at 6100 cm-1 is an indicator for the concentrations of crystalline APAP in the samples. When the extrusion process was operated at 130 °C and 50 rpm (PRC 1), the spectral peak at 6100 cm-1 is apparent. As the extrusion condition moved to a higher screw speed (PRC 2), a higher extrusion temperature (PRC 3), or a combination of both (PRC 4), the crystalline peak at 6100 cm-1 decreased while the amorphous peak at 6600 cm-1 increased concurrently, indicating a solid physical state transformation from crystalline to amorphous. A high temperature promotes amorphization as well as diffusion of the API molecules through the polymer chains for adequate mixing. On the other hand, increasing the screw speed increases the dissolution of the drug into a molten carrier and dispersion by imparting the energy generated by the friction between screws and extruded material.
Figure 3a shows the calculated peak areas of crystalline APAP under different HME process conditions. Under PRC 1 (130 °C, 50 rpm), the extrudates exhibit the highest crystallinity. When the screw speed was increased to 200 rpm while maintaining the same temperature at 130 °C (PRC 2), the crystallinity decreased. When the process conditions were changed back to PRC 1, the crystallinity also reverted to its original value, suggesting the reversible nature of the transition from PRC 1 to PRC 2 and back to PRC 1. Next, the temperature was increased to 170 °C while maintaining the screw speed at 50 rpm (PRC 3). The crystallinity decreased again, but to a level below the value observed in PRC 2, as indicated by the gap bracketed by the two green arrows in Figure 3a. Clearly, PRC 3 resulted in an overall more amorphous solid dispersion than PRC 2. However, increasing the screw speed to 200 rpm (PRC 4) did not further decrease the crystallinity. Finally, the process was changed back to PRC 1. Interestingly, the crystallinity remained at the low value and did not change to the value previously observed in PRC 1.
FIGURE 3: (a) The top shows screw speed vs. time; the middle of the figure shows process temperature vs. time; and the bottom of the figure shows the area of the peak at 6100 cm-1 vs. time. (b) Illustration of the three different types of solid dispersion.
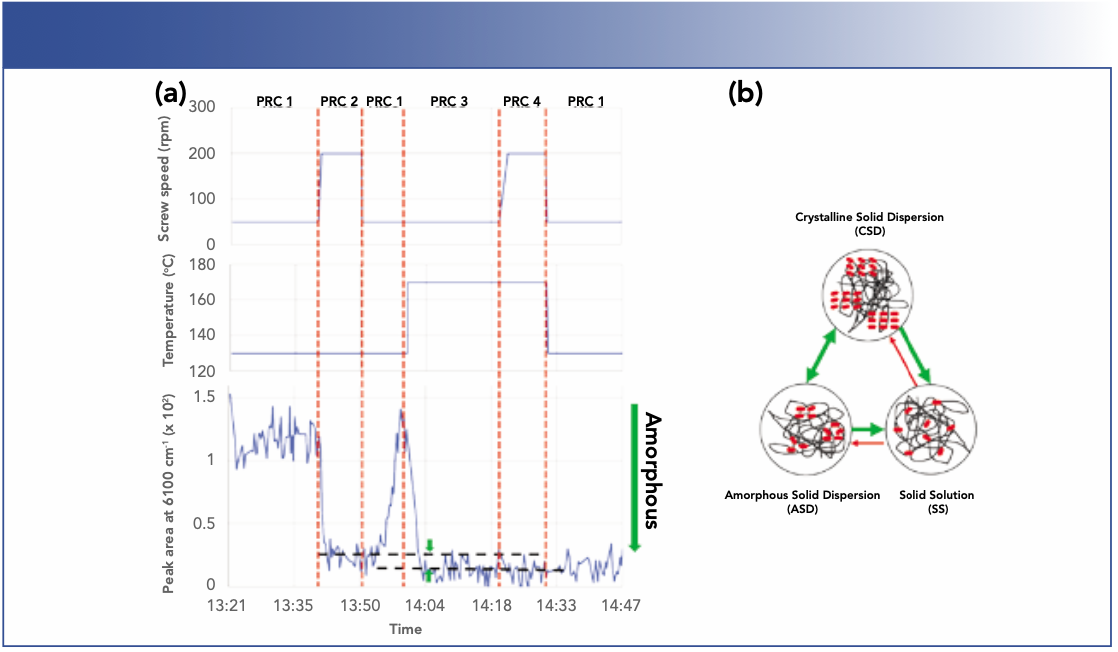
A two-component, API-polymer carrier solid dispersion can form multiple structures depending on their composition and process- ing history (13), as illustrated in Figure 3b. The drug can be molecularly dispersed within the polymer matrix, forming a thermodynamically stable, homogeneous solid solution (SS), the most desirable structure of solid dispersions. Another form is a dispersion of crystalline drug particles in a polymer matrix, referred to as a crystalline solid dispersion (CSD). Alternatively, an intermediate, meta-stable structure where amorphous drug aggregates are dispersed in a polymer matrix (ASD) can be formed. The initial process changes from PRC 1 to PRC 2 and back to PRC 1 likely induced a transition of CSD to ASD and back to CSD, at least in portions of the sample, causing the rise and fall of the overall crystallinity value. Because ASD is a meta-stable state, it can be converted to the equilibrium CSD provided that the thermodynamic driving force is sufficient to overcome the Gibbs free energy barrier. The later transitions of PRC 1 to PRC 3 by raising the temperature to 170 °C resulted in the formation of SS, indicated by the lowest crystallinity value. Once the solid dispersion reached the SS, the polymer matrix provided both a physical barrier to aggregation and stabilization through the drug–polymer interaction. As the result, the API stays in that solid solution. Further transitions from PRC 3 to PRC 4 then back to PRC 1 did not change the crystallinity.
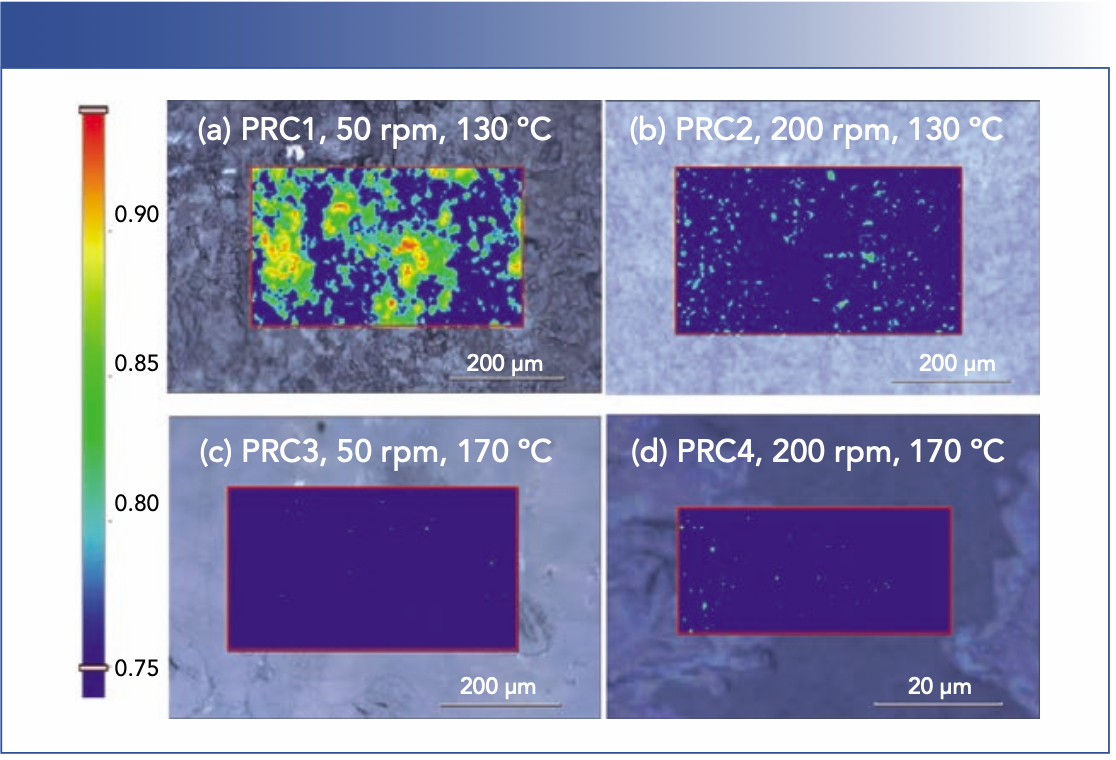
The observations in the FT-NIR experiments were further corroborated by THz Raman imaging analysis. At 130 °C and 50 rpm (PRC 1, Figure 4a), agglomeration of crystalline APAP (CSD, red regions), partially amorphous dispersion (ASD, green regions), and amorphous dispersion (SS, blue regions) coexist. Note that the processing temperature was well below the temperature of APAP (169 °C), and the energy imparted to APAP by screw rotation was not enough to accomplish complete amorphization. At this low processing temperature, even with a higher screw speed of 200 rpm (PRC 2, Figure 4b), the sample still contains noticeable amount of partially amorphous dispersion (ASD). Figures 4a and 4b are in sharp contrast to those of the extrudates processed at a higher temperature of 170 °C (PRC 3 and PRC 4; Figures 4c and 4d). By raising the temperature, near-complete amorphous APAP dispersion (SS) were formed with both screw speeds. The comparison between the four processes clearly illustrate that screw speed is a critical process variable that dictates the energy supply to the extruded material, the degree of mixing, and, to a lesser extent, the residence time. Increasing screw speed increases dissolution of drug into a molten carrier and dispersion. However, the higher temperature is more conducive to the formation of SS.
FIGURE 4: Raman images of extrudates from different HME processes. Images (a–c) were collected using a 50× objective and a 5 μm pixel size. Image (d) was collected using a 100× objective and a 0.5 μm pixel size.
Conclusions
In this study, inline monitoring of API crystallinity by FT-NIR during an HME process was demonstrated. The crystallinity of APAP, measured by the peak area at 6100 cm-1, shows three distinct values, which are speculated to be associated with three different forms of solid dispersion: crystalline solid dispersion, amorphous solid dispersion, and solid solution. Overall, high process temperature and high screw speed are conducive to the formation of amorphous APAP dispersions, but temperature appears to have a more direct impact on the formation of the desired amorphous APAP dispersion. These observations are further corroborated by an offline THz Raman imaging analysis. The extrudates with the highest crystallinity value (least amorphous) show the coexistence of appreciable amount of CSD with ASD and SS, whereas the extrudates with the lowest crystallinity value (most amorphous) contain predominantly SS. FT-NIR is effective in providing real-time information on the solid physical state transformation, but through bulk measurements. Raman microscopy complements FT-NIR by offering direct visualization of the distribution of different solid physical states of the API.
References
(1) M.A. Repka, S. Bandari, V.R. Kallakunta, A.Q. Vo, H. McFall, M.B. Pimparade, and A.M. Bhagurkar, Int. J. Pharm. 535, 68–85 (2018).
(2) S.D. Schaber, D.I. Gerogiorgis, R. Ramachandran, J.M.B. Evans, P.I. Barton, and B.L. Trout, Ind. Eng. Chem. Res. 50, 10083–10092 (2011).
(3) R. Censi, M.R. Gigliobianco, Cr. Casadidio, and P. Di Martino, Pharmaceutics 10, 89 (2018).
(4) N. Furuyama, S. Hasegawa, T. Hamaura, S. Yada, H. Nakagami, E. Yonemochi, and K. Terada, Int. J. Pharm. 361, 12–18 (2008).
(5) E.P.J. Parrott and J.A. Zeitler, Appl. Spectrosc. 69, 1–25 (2015).
(6) A. Paudel, D. Raijada, and J. Rantanen, Adv. Drug Deliv. Rev. 89, 3–20 (2015).
(7) A.Q. Vo, H. He, J. Zhang, S. Martin, R. Chen, M.A. Repka, AAPS Pharm. Sci. Tech. 19, 3425–3429 (2018).
(8) A.Q. Vo, G. Kutz, H. He, S. Narala, S. Bandari, and M.A. Repka, J. Pharm. Sci. 109(12), 3598–3607 (2020).
(9) M. Ibrahim, J. Zhang, M.A. Repka, and R. Chen, AAPS Pharm. Sci. Tech. 20(2), 62 (2019).
(10) E.P.J. Parrott and J.A. Zeitler, Appl. Spectrosc. 69, 1–25 (2015).
(11) A. Paudel, D. Raijada, and J. Rantanen, Adv. Drug Deliv. Rev. 89, 3–20 (2015).
(12) F. Tres, K. Treacher, J. Booth, L.P. Hughes, S.A.C. Wren, J.W. Aylott, and J. C. Burley, J. Control. Release 188, 53–60 (2014).
(13) Y. Huang and W. Dai, Acta Pharm. Sin. B. 4(1), 18–25 (2014).
Rui Chen, Mohammed Ibrahim, and Herman He are with Thermo Fisher Scientific. Direct correspondence to: rui.chen1@thermofisher.com.

Smarter Sensors, Cleaner Earth Using AI and IoT for Pollution Monitoring
April 22nd 2025A global research team has detailed how smart sensors, artificial intelligence (AI), machine learning, and Internet of Things (IoT) technologies are transforming the detection and management of environmental pollutants. Their comprehensive review highlights how spectroscopy and sensor networks are now key tools in real-time pollution tracking.
New AI Strategy for Mycotoxin Detection in Cereal Grains
April 21st 2025Researchers from Jiangsu University and Zhejiang University of Water Resources and Electric Power have developed a transfer learning approach that significantly enhances the accuracy and adaptability of NIR spectroscopy models for detecting mycotoxins in cereals.
AI-Powered SERS Spectroscopy Breakthrough Boosts Safety of Medicinal Food Products
April 16th 2025A new deep learning-enhanced spectroscopic platform—SERSome—developed by researchers in China and Finland, identifies medicinal and edible homologs (MEHs) with 98% accuracy. This innovation could revolutionize safety and quality control in the growing MEH market.
New Study Reveals Insights into Phenol’s Behavior in Ice
April 16th 2025A new study published in Spectrochimica Acta Part A by Dominik Heger and colleagues at Masaryk University reveals that phenol's photophysical properties change significantly when frozen, potentially enabling its breakdown by sunlight in icy environments.