Infrared Spectroscopy of Polymers, IX: Pendant Ester Polymers and Polycarbonates
We continue our survey of the spectra of carbonyl-containing polymers by looking at the spectrum of cellulose acetate. What makes cellulose acetate unique is that it is a carbohydrate molecule that is reacted to obtain pendant ester groups. I will also introduce you to polycarbonates. Carbonates are a carbonyl-containing functional group that contain three oxygen atoms. An example of an economically important polycarbonate is Lexan, which is made into windows and car parts. In this column, we examine its spectrum in detail.
I stated in my last column (1) that a polyester is a polymer with an ester group in its backbone. But what about polymers with pendant ester groups? What do we call those, and where should we discuss them? For lack of a better term, I will call polymers with pendant ester groups pendant ester polymers (PEPs). A common PEP is the family of cellulose acetates. These polymers are made when a polymer, cellulose, reacts with acetic acid. Figure 1 shows the synthesis of cellulose diacetate.
FIGURE 1: The synthesis of cellulose diacetate from cellulose and acetic acid.

Acetic anhydride is sometimes used instead of, or in addition to, acetic acid (2). Given that paper is made from cellulose and acetic acid is found in vinegar, you could in theory make cellulose acetate at home, but I wouldn’t recommend it because you typically need a sulfuric acid catalyst. The cellulose monomer has three O-H groups that can react to form an ester. Thus, cellulose acetate, cellulose diacetate, and cellulose triacetate are possible. Cellulose acetate is commonly found in consumer products, including cigarette filters and playing cards.
We have previously discussed the infrared (IR) spectrum of cellulose (3), and we have also discussed the spectra of esters (4) and polyesters (1). Recall that acetate esters have a special high wavenumber C-C-O stretching peak at ~1240 cm-1 (going forward, assume all peak positions are in cm-1 even if not so expressed) caused by a mass effect (5). Normally saturated esters, like those in cellulose acetate, exhibit C-C-O stretches between 1210–1150 cm-1 (4). Therefore, the acetate C-C-O peak at 1240 cm-1 breaks one of our rules, but it is a useful rule break because it is one we understand and can make use of. Acetate esters are common in the world of polymers and even in the world of controlled substances; for example, heroin contains this functional group. Thus, given the importance of acetate esters, it is just as well they contain a special peak signifying their presence in a sample.
Figure 2 shows the structure of cellulose triacetate and the IR spectra of cellulose acetate and cellulose triacetate.
FIGURE 2: The chemical structure of cellulose triacetate and the IR spectrum of cellulose triacetate (blue) and cellulose acetate (red). The “AcO” in the structure denotes acetate.
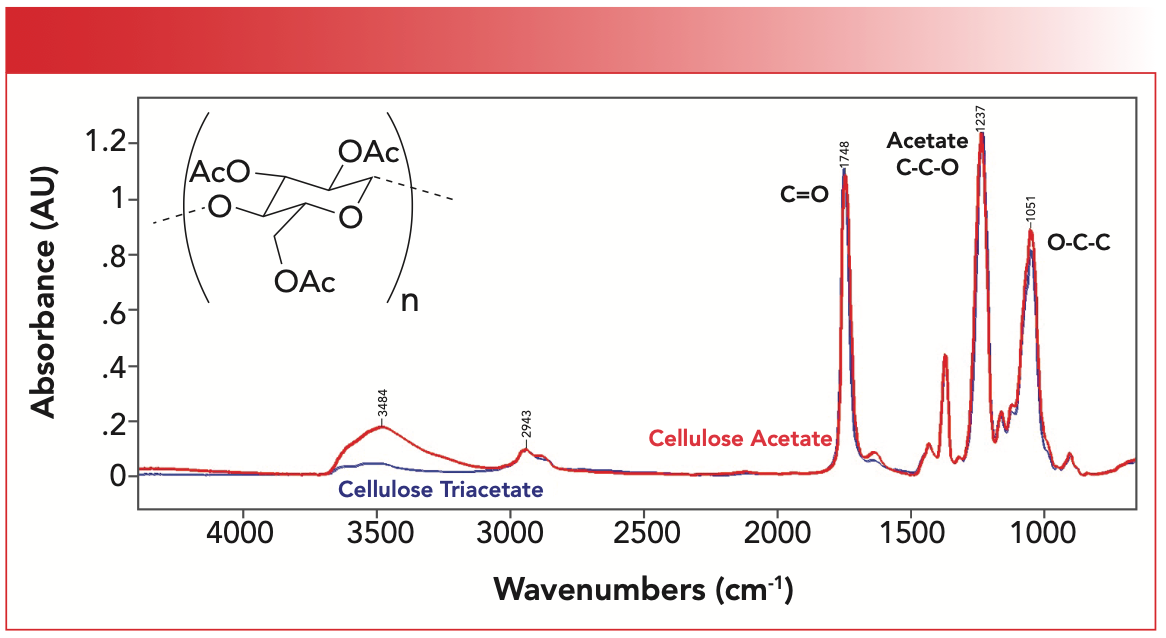
Note that the alcohol O-H stretch at 3484 is bigger in cellulose acetate than in the triacetate because in the triacetate more of the O-H groups have reacted to form esters. Otherwise, this spectrum contains the classic saturated ester Rule of Three peaks (4) with the C=O stretch at 1748 cm-1, the acetate ester C-C-O stretch at 1237 cm-1, and the O-C-C stretch at 1051 cm-1.
Organic Carbonates Review
Organic carbonates are a functional group similar to esters, so it is appropriate to group polycarbonates with PEPs. The chemical term carbonate is a little confusing. In general, the term refers to a functional group with the formula CO3. There exist inorganic carbonates that contain the CO3-2 ion where each carbon-oxygen bond has the same bond order (6). Although this functional group contains a carbon atom, it acts inorganic because it forms ionic bonds and comprises rocks such as limestone. The literature provides more information on the spectra of inorganic carbonates (6). We will discuss the spectra of inorganic carbonates here soon when we cover inorganic molecules.
Organic carbonates contain a carbon atom with three oxygens bonded to it, but the bonding is covalent and consists of C=O and C-O bonds, which is shown in Figure 3.
FIGURE 3: The molecular framework of an organic carbonate.
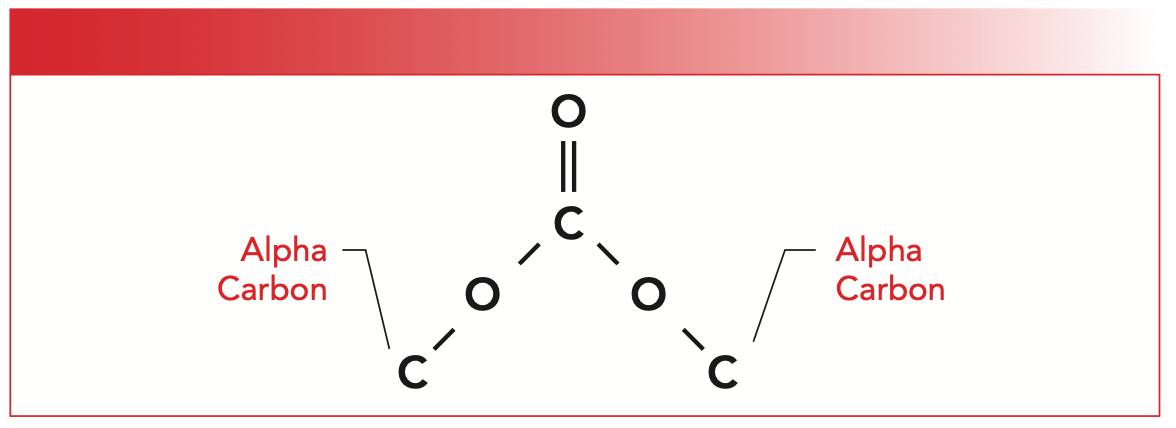
Note that organic carbonates contain two alpha carbons. If both alpha carbons are saturated, the carbonate is saturated. If one alpha carbon is aromatic and one is saturated, the carbonate is said to be mixed. If both alpha carbons are aromatic, the carbonate is aromatic.
As you can see in Figure 3, carbonates are symmetrical, and each half can be thought of as an ester, with each half having a carbonyl carbon, ester oxygen, and an alpha carbon. Note that the carbonyl carbon has not one oxygen attached to it as in an ester but two, which means that there are two ester oxygens and two alpha carbons as seen.
The IR Spectra of Organic Carbonates
Given the structural similarity between esters and organic carbonates we might expect carbonates to follow the Rule of Three as esters do. Carbonates do have three intense peaks like an ester (7), but the vibrations responsible are a little different than in esters because the structures of esters and carbonates are different. Briefly, esters have a C=O stretch around 1700, a C-C-O stretch near 1200 cm-1, and an O-C-C stretch around 1100 cm-1. Carbonates have C=O and O-C-C stretches, but unlike esters have an O-C-O linkage and hence an O-C-O asymmetric stretching peak instead of a C-C-O peak. Table I shows the group wavenumbers for the three varieties of organic carbonates.

Note that the C=O stretch is different for all three types of carbonates, and that for mixed and aromatic carbonates particularly the C=O stretch is much higher than any ester C=O stretch we have studied, making these two types of organic carbonate easy to spot. Table I also shows that the organic carbonate O-C-O stretching peak position goes down as we move from the saturated, mixed, and aromatic versions of the functional group. The O-C-C stretching peak range is the same for all three types of carbonates. The saturated carbonate C=O stretch falls in the same range as that of saturated esters (4). However, saturated carbonates have theirO-C-O peak from 1280 to 1240 cm-1, whereas saturated esters have their C-C-O peak lower from 1210 to 1160 cm-1. It is the relative position of these two peaks that allows one to distinguish saturated esters and carbonates from each other.
The IR spectrum of an aromatic carbonate and a common polycarbonate, Lexan (poly 2,2-Bis[4-hydroxyphenyl]propane), is seen in Figure 4.
FIGURE 4: The chemical structure and IR spectrum of the aromatic polycarbonate Lexan.
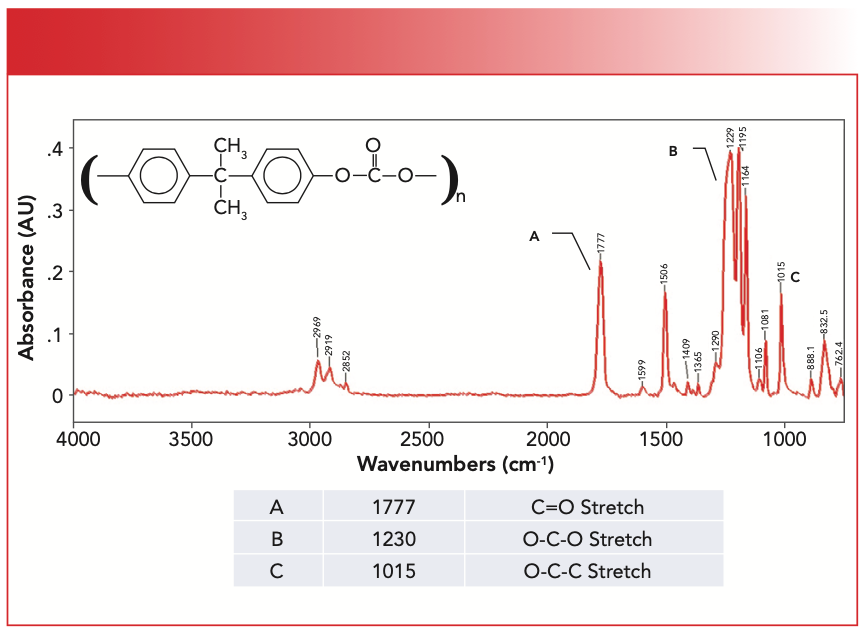
Lexan is an aromatic carbonate because the two alpha carbons are part of benzene rings. The peak labeled A at 1777 cm-1 is undoubtedly a C=O stretch based on its strength and position. The carbonyl stretch of aromatic carbonates in general falls from 1820 to 1775 cm-1. The C=O stretch of mixed carbonates falls from 1790 to 1760 cm-1, and for saturated carbonates, this peak is seen at 1740±10. In Figure 4, the O-C-O stretch is labeled B at 1230 cm-1. For aromatic carbonates, this peak is typically found from 1230 to 1205 cm-1, whereas for mixed carbonates, it falls between 1250–1210 cm-1, and for saturated carbonates, it falls from 1280 to 1240 cm-1. The O-C-C stretch in Figure 4 is at 1015 cm-1, and for all carbonates, this peak falls from 1060 to 1000 cm-1.
Figure 5 shows the spectrum of a mixture of polystyrene and Lexan.
FIGURE 5: The chemical structure and IR spectrum of a mixture of polystyrene and Lexan.
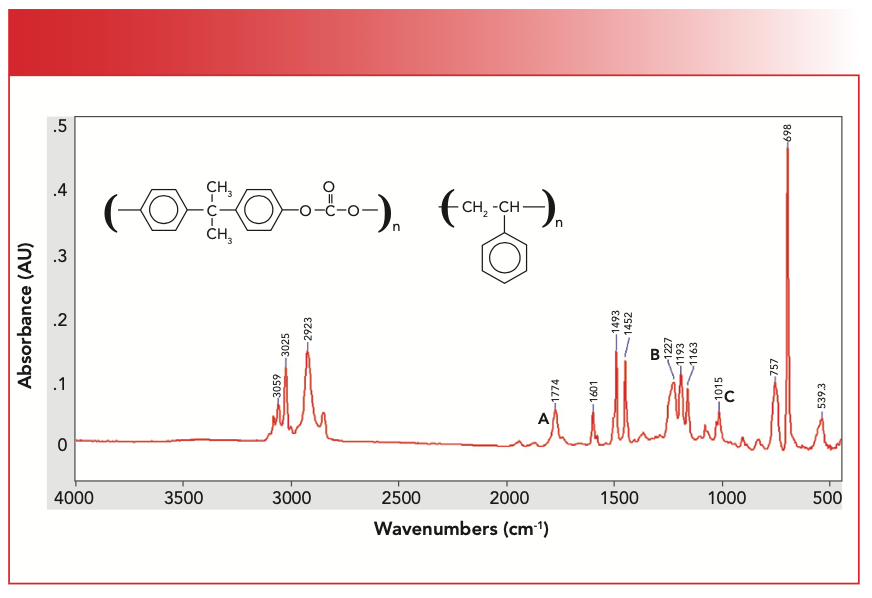
We have studied the spectrum of polystyrene previously (8). In Figure 5, we can see C-H stretches above 3000 cm-1 from the aromatic rings in both Lexan and polystyrene, aromatic ring modes at 1601 cm-1 and 1493 cm-1, the ring bend at 698 cm-1, andthe C-H wag at 757 cm-1 from the mono-substituted benzene ring in polystyrene (8). Note that the 698 cm-1 peak is the biggest one in this spectrum. The Lexan peaks are the C=O stretch at 1774 cm-1 labeled A, the O-C-O stretch at 1227 cm-1 labeled B, and the O-C-C stretch at 1015 cm-1 labeled C. These peaks are close to their positions in pure Lexan.
Figure 6 shows the spectrum of a mixture of Lexan and polybutylene terephthalate. We saw the spectrum of pure polybutylene terephthalate (PBT) in the last column (1).
FIGURE 6: The chemical structure and IR spectrum of a mixture of Lexan and polybutylene terephthalate.
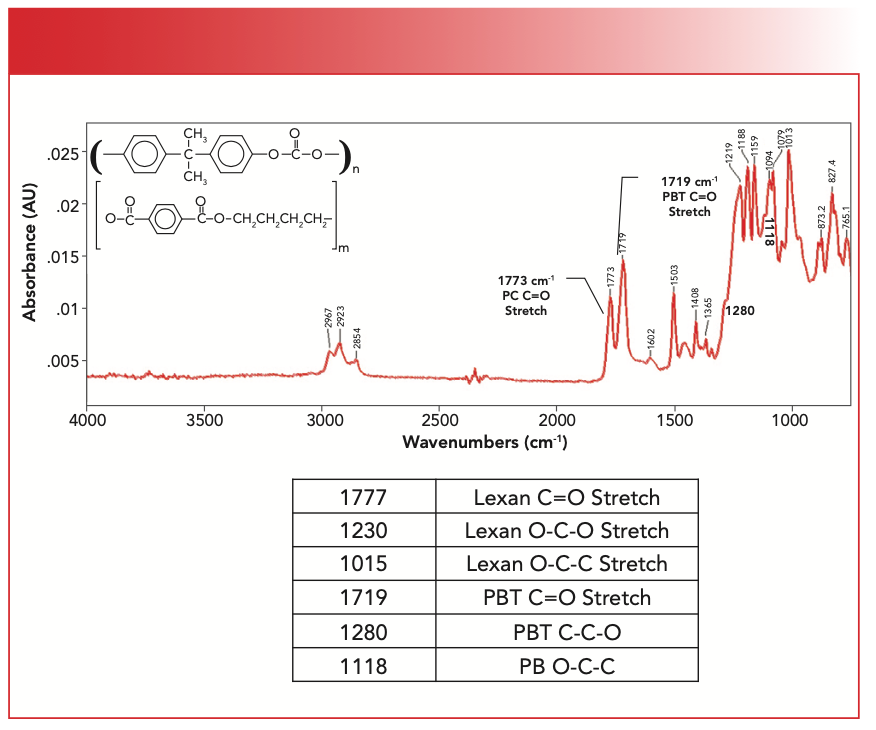
The three main peaks from the polycarbonate Lexan are present, with the C=O stretch falling at 1777 cm-1, the O-C-O stretch at 1230 cm-1, and the O-C-C stretch at 1015 cm-1. The “Rule of 3” peaks are present for PBT with the C=O stretch at 1719 cm-1, the C-C-O at 1280 cm-1, and the O-C-C stretch at 1118 cm-1. As a result of there being carbonate and ester functional groups present, there are two carbonyl stretches. Also, because both these functional groups have multiple C-O stretching vibrations, there are eight peaks between 1300–1000 cm-1. The two Lexan peaks in this region were easy to spot, but the PBT peaks at 1280 and 1118 cm-1 are barely discernible as shoulders, and I only found them after examining an expanded view of the spectrum. This observation points out one of the problems with mixtures, which is the fact that peaks from one molecule can hide the peaks of other molecules. We have discussed techniques for getting around the mixture analysis problem in previous columns, including spectral subtraction (9) and library searching (10).
Conclusions
We defined PEPs and looked at the synthesis and spectra of a common PEP, cellulose acetate. We found that cellulose acetate follows the ester Rule of Three as expected, and that it clearly exhibits the high wavenumber C-C-O stretch of acetate esters found near 1240 cm-1. We then reviewed the spectra of the three types of carbonates: saturated,mixed, and aromatic. Polycarbonates exhibit three intense peaks from C=O, O-C-O, and O-C-C stretching, similar in size and position to the trio of peaks from esters. We looked at the spectrum of pure Lexan and two spectra where it is found in a mixture. The position of the C=O stretch in carbonates may be used to distinguish the three types of carbonates from each other. The C=O of carbonates is much higher than most esters making carbonates easy to spot. To distinguish between saturated carbonates and saturated esters, use the fact that saturated carbonates have an O-C-O peak from 1280 to 1240 cm-1, whereas saturated esters have their C-C-O peak from 1210 to 1160 cm-1.
References
(1) B.C. Smith, Spectroscopy 37(10), 25–28 (2022).
(2) Wikipedia, Cellulose acetate. https://en.wikipedia.org/wiki/Cellulose_acetate (accessed October 2022).
(3) B.C. Smith, Spectroscopy 37(5), 15–19,27 (2022).
(4) B.C. Smith, Spectroscopy 33(7), 20–23 (2018).
(5) B.C. Smith, Spectroscopy 30(1), 16–23 (2015).
(6) B.C. Smith, Infrared Spectral Interpretation, A Systematic Approach (CRC Press, Boca Raton, FL, 1999).
(7) B.C. Smith, Spectroscopy 33(9), 24–28 (2018).
(8) B.C. Smith, Spectroscopy 36(11), 22–25 (2021).
(9) B.C. Smith, Spectroscopy 36(3), 24–27 (2021)
(10) B.C. Smith, Spectroscopy 36(5), 14–19 (2021).
Brian C. Smith, PhD, is the founder and CEO of Big Sur Scientific, a maker of portable mid-infrared cannabis analyzers. He has over 30 years experience as an industrial infrared spectroscopist, has published numerous peer-reviewed papers, and has written three books on spectroscopy. As a trainer, he has helped thousands of people around the world improve their infrared analyses. In addition to writing for Spectroscopy, Dr. Smith writes a regular column for its sister publication Cannabis Science and Technology and sits on its editorial board. He earned his PhD in physical chemistry from Dartmouth College. He can be reached at: SpectroscopyEdit@MMHGroup.com ●


AI Shakes Up Spectroscopy as New Tools Reveal the Secret Life of Molecules
April 14th 2025A leading-edge review led by researchers at Oak Ridge National Laboratory and MIT explores how artificial intelligence is revolutionizing the study of molecular vibrations and phonon dynamics. From infrared and Raman spectroscopy to neutron and X-ray scattering, AI is transforming how scientists interpret vibrational spectra and predict material behaviors.
Real-Time Battery Health Tracking Using Fiber-Optic Sensors
April 9th 2025A new study by researchers from Palo Alto Research Center (PARC, a Xerox Company) and LG Chem Power presents a novel method for real-time battery monitoring using embedded fiber-optic sensors. This approach enhances state-of-charge (SOC) and state-of-health (SOH) estimations, potentially improving the efficiency and lifespan of lithium-ion batteries in electric vehicles (xEVs).
New Study Provides Insights into Chiral Smectic Phases
March 31st 2025Researchers from the Institute of Nuclear Physics Polish Academy of Sciences have unveiled new insights into the molecular arrangement of the 7HH6 compound’s smectic phases using X-ray diffraction (XRD) and infrared (IR) spectroscopy.