Label-Free SERS for Rapid Species Identification of Escherichia Coli, Listeria Monocytogenes, and Salmonella Typhimurium Bacteria
The authors develop a label-free SERS method for rapid, accurate, specific, and routine screening of E. coli, L. monocytogenes, and S. typhimurium bacteria for public safety and security.

Frequent recalls of bacteria-contaminated ready-to-eat food products are great concerns for federal regulators and manufacturers, not only because of the public health issue but also because of the subsequent economic loss. To meet the requirement for rapid detection of foodborne bacteria, a number of new techniques, such as nucleic acid–based polymerase chain reaction (PCR) and capture antibody–detection (label) antibody-based sandwich immunoassays (1,2), have been developed. However, these methods have several potential problems, such as a high rate of false negatives and false positives, slow speed, selection of species-specific antibodies and probe reagents, and multistep sample preprocessing with the use of numerous chemical reagents.
Fast microbial detection requires minimal sample preparation, permits routine analysis with a shorter data collection interval and simpler operation, and it is hoped, reduces the probability of bacterial cross-contamination during the identification process. Surface-enhanced Raman scattering (SERS) studies of bacteria adsorbed on fresh borohydride-reduced or citrate-reduced silver colloids is an alternative approach. Not only has it been used to obtain the fingerprinting characterization of bacterial structure (3–5), but it also has an easy sampling attribute by mixing silver colloids directly with incubated cultures (5).We have identified the unique SERS bands in Escherichia coli and Listeria monocytogenes bacteria and subsequently have developed simple two-band algorithms for rapid and routine identification of E. coli and L. monocytogenes cultures on silver colloidal nanoparticles that were prepared from different batches and had undergone various storage durations (5).
The objectives of this study were to unravel the characteristic SERS bands of Salmonella typhimurium bacteria and to verify the simple and universal algorithms established earlier (5). The ultimate goal is to develop label-free SERS for rapid, accurate, specific, and routine screening of E. coli, L. monocytogenes, and S. typhimurium bacteria for public safety and security.
Experimental
Chemical reagents. Chemical reagents (silver nitrate, >99%, and trisodium citrate, >99% from Sigma-Aldrich Co., St. Louis, Missouri) and trypic soy broth (TSB) media (Becton, Dickinson and Co., Sparks, Maryland) were used without further purification.
Silver colloid preparation: During a 12-month period, 10 batches of citrate-reduced silver colloidal suspensions were prepared by a modified Lee and Meisel procedure (6) and were described in detail previously (5).
Bacterial culture preparation: More than 14 batches of E. coli strains (E. coli ATCC 25922), L. monocytogenes strains (L. monocytogenes ATCC 13932), and S. typhimurium strains (S. typhimurium ATCC 14028) were incubated in TSB growth media at 37 °C for approximately 17–20 h without agitation in a 1-year span. This growth procedure routinely yielded a culture containing ~109 colony forming units (CFU)/mL of each respective bacterium at stationary phase.
SERS spectral collection and analysis. SERS spectra were collected on a Fourier transform (FT)-Raman module using a DTGS KBr detector and XT-KBr beamsplitter (Nicolet 670 FT-IR bench, Madison, Wisconsin). Raman scatter was accumulated using 180° reflective mode with 1 W of laser power at 1064 nm excitation and 256 scans at 8-cm–1 resolution. All spectra were transformed into .spc files (Grams file format) and then were smoothed with the Savitzky–Golay function of two polynomial and 11 points by the use of Grams/32 software (Version 7.0, Galactic Industries Corp., Salem, New Hampshire). The data set was loaded into Microsoft Excel 2000 (Microscoft, Redmond, Washington) to execute simple algorithm analysis.
Two types of measurements were performed. First, 50 μL of different silver colloidal batches in both fresh and aging state were introduced into 6 mm × 50 mm commercial glass tubes (Fisher Scientific, Suwanee, Georgia) to evaluate their reproducibility and stability, and 40 μL of an aqueous tribasic potassium phosphate solution was added to the same volume of silver colloids to examine the binding effectiveness of silver nanoparticles. Second, bacterial suspensions were mixed with silver colloids at a volume ratio of 1:1 (40 μL/40 μL) to get the respective SERS spectra. For one bacterial or potassium phosphate solution against one batch colloidal solution, two measurements were taken. Immediately after mixing two solutions, the tubes were shaken vigorously five times and then kept untouched for 10 min before the subsequent SERS measurements.
Results and Discussion
Assessment of reproducibility, stability, and bending effectiveness of silver colloids. One of the major concerns in SERS studies is to prepare reproducible silver colloids with the batch process, because the fabrication procedure is sensitive to many factors, such as temperature and rate of addition of reagents (7). As an alternative, the flow system has been developed to produce reproducible and stable colloids (8). However, batch-based colloidal fabrication is still attractive and practical because of its simplicity and its ease of operation (9).
Although UV–vis spectroscopy has been used to reveal the characteristics of silver colloids (3,7,8), Raman spectra can provide the information resulting from chemical residuals in colloids (5,9). Figure 1 shows the average spectrum of normalized SERS signals at 215 cm–1 from 10 fresh silver colloidal suspensions prepared with the batch process in the 1100–300 cm–1 region, in which no significant SERS peaks arising from decomposed chemical residuals in silver colloids were observed. Meanwhile, there were no additional SERS peaks observed for the silver colloids during an eight-week storage period at room temperature, suggesting the stability of the silver colloidal suspensions (5).
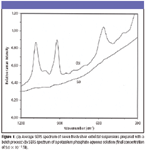
Figure 1
In addition, probe compounds such as dyes and inorganic phosphate have been introduced into colloidal solutions to assess their binding effectiveness (5,8). We selected potassium phosphate as an analyte because it is much smaller than the silver colloidal nanoparticles and has characteristic P–O vibrations. Figure 1 (b) shows the SERS spectrum of an aqueous potassium phosphate solution at a final concentration of 5 × 10⁻³ M, and intense and separated ν1 bands at 922 cm–1 were used to evaluate the binding effectiveness of silver colloidal nanoparticles at both fresh and aging states (5).
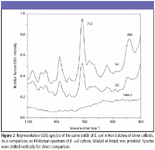
Figure 2
SERS characteristics of E. coli, L. monocytogenes, and S. typhimurium cultures: Figures 2 through 4 show typical SERS spectra in the region of 1100–300 cm–1 from mixtures of two batches of silver colloidal suspensions and one batch of E. coli, L. monocytogenes, and S. typhimurium culture, respectively. As a comparison, FT-Raman spectra of individual cultures are given as intact, and they do not show any apparent bands. As expected, there are large variations in both relative intensity and position of SERS-active bands because of subtle changes among silver colloidal batches and unpredicted "hot" binding sites. Because incubated bacterial cultures consist of numerous species that were preexisting in growth media and were produced as by-products during bacterial growth, clear understanding of the origins of SERS-active bands is not straightforward.
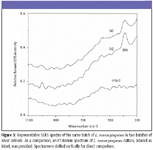
Figure 3
The most striking differences of SERS spectra among E. coli, L. monocytogenes, and S. typhimurium cultures are the appearance of more prominent SERS peaks in the E. coli and S. typhimurium suspensions than in L. monocytogenes suspensions. Such distinctions could be a reflection of their genetic, structural, or metabolic differences. Close examination of all SERS spectra over a period of more than one-year indicates that an intense 712-cm–1 SERS peak is common in E. coli and S. typhimurium suspensions and could be used to discriminate them from L. monocytogenes cultures, whereas the 390-cm–1 SERS band not only is indicative of L. monocytogenes cultures but also could be used to discriminate E. coli cultures from S. typhimurium cultures.
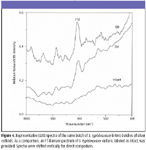
Figure 4
Identification of E. coli, L. monocytogenes, and S. typhimurium cultures: Ratios of I712/I730 and I390/I352 for three types of bacterial cultures were obtained by the same procedure we developed earlier (5) and are plotted in Figure 5. Three cultures display much scatter distribution, probably as a result of a number of factors, such as the variations of chemical components and heterogeneities over batches of bacterial cultures and colloidal suspensions, and time after mixing bacteria and colloids. However, the greatness of the two ratios differs among the three species. Careful examination indicates that the E. coli and S. typhimurium cultures can be separated from L. monocytogenes by the ratio values of I712/I730 greater than 1.04, and the E. coli and S. typhimurium cultures can be identified from each other by the ratio values of I390/I352 around 0.97, respectively. Notably, the classification model is based upon SERS spectra acquired from different colloidal batches stored for different lengths of time.
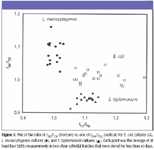
Figure 5
Although multivariate data analysis of SERS spectra has been attempted to discriminate different bacterial species, SERS data from only one batch of colloid were used, and SERS spectra were preprocessed by subtracting a linearly increasing baseline (3). Clearly, it is impractical and time-consuming. Consequently, development of ratio algorithms utilizing the unique SERS bands directly is simple and can be applied universally for fast, accurate, and routine screening of E. coli, L. monocytogenes, and S. typhimurium species on a variety of silver colloidal suspensions over batches and storages.
Conclusion
This study suggests the usefulness of the SERS technique in rapid and routine species identification of E. coli, L. monocytogenes, and S. typhimurium cultures as a result of the technique's simple and easy sampling attribute as well as exclusive SERS biomarkers. To reveal consistent SERS bands from poor reproducibility of SERS signal of bacterial analyte, numerous spectra of mixing various batches of bacterial cultures with different colloidal batches were examined carefully. Characteristic bands at 712 and 390 cm–1 that appeared consistently and had the strongest intensity were identified. Two unique bands were then used to identify E. coli, L. monocytogenes, and S. typhimurium cultures with 100% success.
To assess the reproducibility and stability of citrate-reduced silver colloids over batch process and over storage period as well as their binding effectiveness, FT-Raman spectra of silver colloid suspensions and ratio of SERS-active P–O band at 922 cm–1 in potassium phosphate aqueous solutions were used. The measures will ensure the quality control of batch-based silver colloids in the routine application over a long period.
Acknowledgment
Mention of a product or specific equipment does not constitute a guarantee or warranty by the U.S. Department of Agriculture and does not imply its approval to the exclusion of other products that may also be suitable.
Yongliang Liu is with the Department of Nutrition and Food Science, University of Maryland, College Park, Maryland.
Yud-Ren Chen, Xiangwu Nou, Moon S. Kim, and Kuanglin Chao are with the Food Safety Laboratory, Beltsville Agricultural Research Center, USDA, Beltsville, Maryland.
References
(1) C.W. Donnelly, in Listeria, Listeriosis, and Food Safety, 2nd ed., T. Ryser and E.H. Marth, Eds. (Marcel Dekker, New York, 1999), pp. 225–260.
(2) T. Geng, J. Uknalis, S.-I. Tu, and A.K. Bhunia, Sensors 6, 796–807 (2006).
(3) R.M. Jarvis and R. Goodacre, Anal. Chem. 76, 40–47 (2004).
(4) M.L. Laucks, A. Sengupta, K. Junge, E.J. Davis, and B.D. Swanson, Appl. Spectrosc. 59, 1222–1228 (2005).
(5) Y. Liu, Y.-R. Chen, X. Nou, and K. Chao, Appl. Spectrosc. 61, 824–831 (2007).
(6) P.C. Lee and D. Meisel, J. Phys. Chem. 86, 3391–3395 (1982).
(7) C.H. Munro, W.E. Smith, M. Garner, J. Clarkson, and P.C. White, Langmuir 11, 3712–3720 (1995).
(8) R. Keir, D. Sadler, and W.E. Smith, Appl. Spectrosc. 56, 551–559 (2002).
(9) Y. Liu, Y.-R. Chen, K. Chao, and X. Nou, J. Raman Spectrosc. In press.
AI Shakes Up Spectroscopy as New Tools Reveal the Secret Life of Molecules
April 14th 2025A leading-edge review led by researchers at Oak Ridge National Laboratory and MIT explores how artificial intelligence is revolutionizing the study of molecular vibrations and phonon dynamics. From infrared and Raman spectroscopy to neutron and X-ray scattering, AI is transforming how scientists interpret vibrational spectra and predict material behaviors.
Real-Time Battery Health Tracking Using Fiber-Optic Sensors
April 9th 2025A new study by researchers from Palo Alto Research Center (PARC, a Xerox Company) and LG Chem Power presents a novel method for real-time battery monitoring using embedded fiber-optic sensors. This approach enhances state-of-charge (SOC) and state-of-health (SOH) estimations, potentially improving the efficiency and lifespan of lithium-ion batteries in electric vehicles (xEVs).
New Study Provides Insights into Chiral Smectic Phases
March 31st 2025Researchers from the Institute of Nuclear Physics Polish Academy of Sciences have unveiled new insights into the molecular arrangement of the 7HH6 compound’s smectic phases using X-ray diffraction (XRD) and infrared (IR) spectroscopy.