Library Searching
In a previous column, we discussed a number to techniques to make the mixture analysis problem easier, including purification, spectral subtraction, and library searching (1). At that time, I promised to write a future column with more details on library searching and spectral subtraction. A search of my records shows that I never wrote that column, and I apologize for that. This column, therefore, focuses on library searching, and a future column will focus on spectral subtraction.
Spectral Comparisons
Spectral comparisons, where a known reference spectrum is compared to an unknown spectrum to assist in its identification, is an important tool in infra- red spectral interpretation (2). I am old enough that I began interpreting spectra before personal computers were invented. Back in those Jurassic days, to identify an unknown one had to compare the sample spectrum to paper copies of known spectra kept in hundreds of green three-ring binders. It could take hours of poring over these dusty tomes to find the correct library match. The company back then that published these spectra was called Sadtler Chemical (3).
Fortunately, computerized library searching now exists. In this technique, an unknown spectrum is compared to a collection of known infrared spectra kept in a digital infrared spectral library. Revealing my age once again, the first Fourier transform infrared (FT-IR) system I ever used that had computerized library searching capabilities took 15 min to complete one library search! I should point out that this system had a computer, manufactured by the FT-IR maker, with a whopping 64 kb of memory. Here in 2021, I think my toaster has more computing capability than my FT-IR computer did back then. Today, of course, library searches of thousands of spectra take place in a flash.
Regardless of the computer, a library search is performed by mathematically comparing your unknown spectrum to each of the spectra in a library. If there are 1000 spectra in the library, then 1000 comparisons will be performed. The library search software uses what is called a search algorithm to generate a number describing how similar, or different, the two spectra are. This number is called a Hit Quality Index (or HQI, for short), and it is discussed later on in the column.
Where Can I Buy Infrared Spectral Libraries?
To perform library searching, the first thing you have to do is obtain some libraries. I normally don’t call out individual companies in this column, but there are only a handful of companies selling infrared spectral libraries, so I will name several here as a convenience to my readers. I apologize if I leave anyone out.
The company with perhaps the largest collection of infrared spectral libraries is what was Sadtler, became Bio-Rad, and is now part of Wiley (3–5). According to their website, Wiley has available 264,000 spectra you can search against (5). Access to these libraries is normally done via a leasing arrangement.
Another vendor that sells infrared spectral libraries is Sigma-Aldrich (6). As far as I can tell, their entire collection consists of about 100,000 spectra. A couple of smaller companies that sell infrared spectral libraries include ST Japan (7) and Fiveash Data Management (8). A Google search will also turn up some free libraries on the internet. My experience with free libraries is that they are generally small and specific to a narrow range of samples, and sometimes the data are not correct because they have not been vetted properly. As a result, be very careful when using free libraries off the internet. The libraries you purchase may come on a compact disk, be copied to your computer’s storage device, or installed on your company’s computer network.
Ultimately, the best source of infrared spectral libraries is you. Most FT-IR software packages allow you to build your own libraries. I strongly encourage this, because only you have access to the sample types typical of your work. You can even build multiple libraries of your own of different types. For example, you could build your own polymer, gas phase, and inorganics library, and search appropriate unknowns against them. Every time you come across a new sample for which you have a good identification, add it to an appropriate library. Spectra you add to your libraries become de facto references. For this reason, please make sure your data is of high quality, you are certain of the identification, and the data matches the instrumental resolution of the other spectra in the library (9).
What About the Instrumental Resolution of Library Spectra?
Instrumental resolution is a measure of how well a spectrometer distinguishes spectral features from each other (9). In FT-IR, instrumental resolution is measured in cm-1. For example, a spectrum measured at 8 cm-1 resolution can resolve features that are 8 cm-1 or further apart (9). When library searching is performed, the unknown and library spectra must be measured at the same instrumental resolution. This is why when you purchase infrared spectral libraries, they come in different resolutions. For example, the same library might be available in 8 cm-1 and 4 cm-1 resolutions. When purchasing a library, you must make sure that the libraries’ resolution matches that of the samples you will be measuring.
The Search Process
What Libraries Should I Use?
After starting up your library searching software package, you will need to choose which libraries to search against. It may be tempting to try the shotgun approach and search your sample spectrum against all the libraries you have, but this may end up being a waste of time. Think about the nature of your sample. For example, a spectrum of a polymer searched against a gas phase spectral library will never produce good results. On the other hand, a polymer spectrum searched against a large organics library might yield good results if the repeat unit of the polymer is similar to any of the molecules in the library. Judicious choice then of what libraries you search against is important.
What Wavenumber Regions Should I Use?
Another thing to think about before performing a library search is to select what wavenumber region or regions to use. Typically, the default region in use by your search software will be the entire spectrum, lets say 4000 to 400 cm-1.
However, the software will typically allow you to choose spectral regions to include or exclude from the search, and this sometimes makes sense. For example, if your sample spectrum has unwanted water vapor or CO2 peaks, you should exclude those regions from your search, since they are not part of the sample and their presence can throw off your search results. Additionally, if a sample is a mixture and you have identified a major component, excluding its peaks from a search might make the search more sensitive to the identity of minor components.
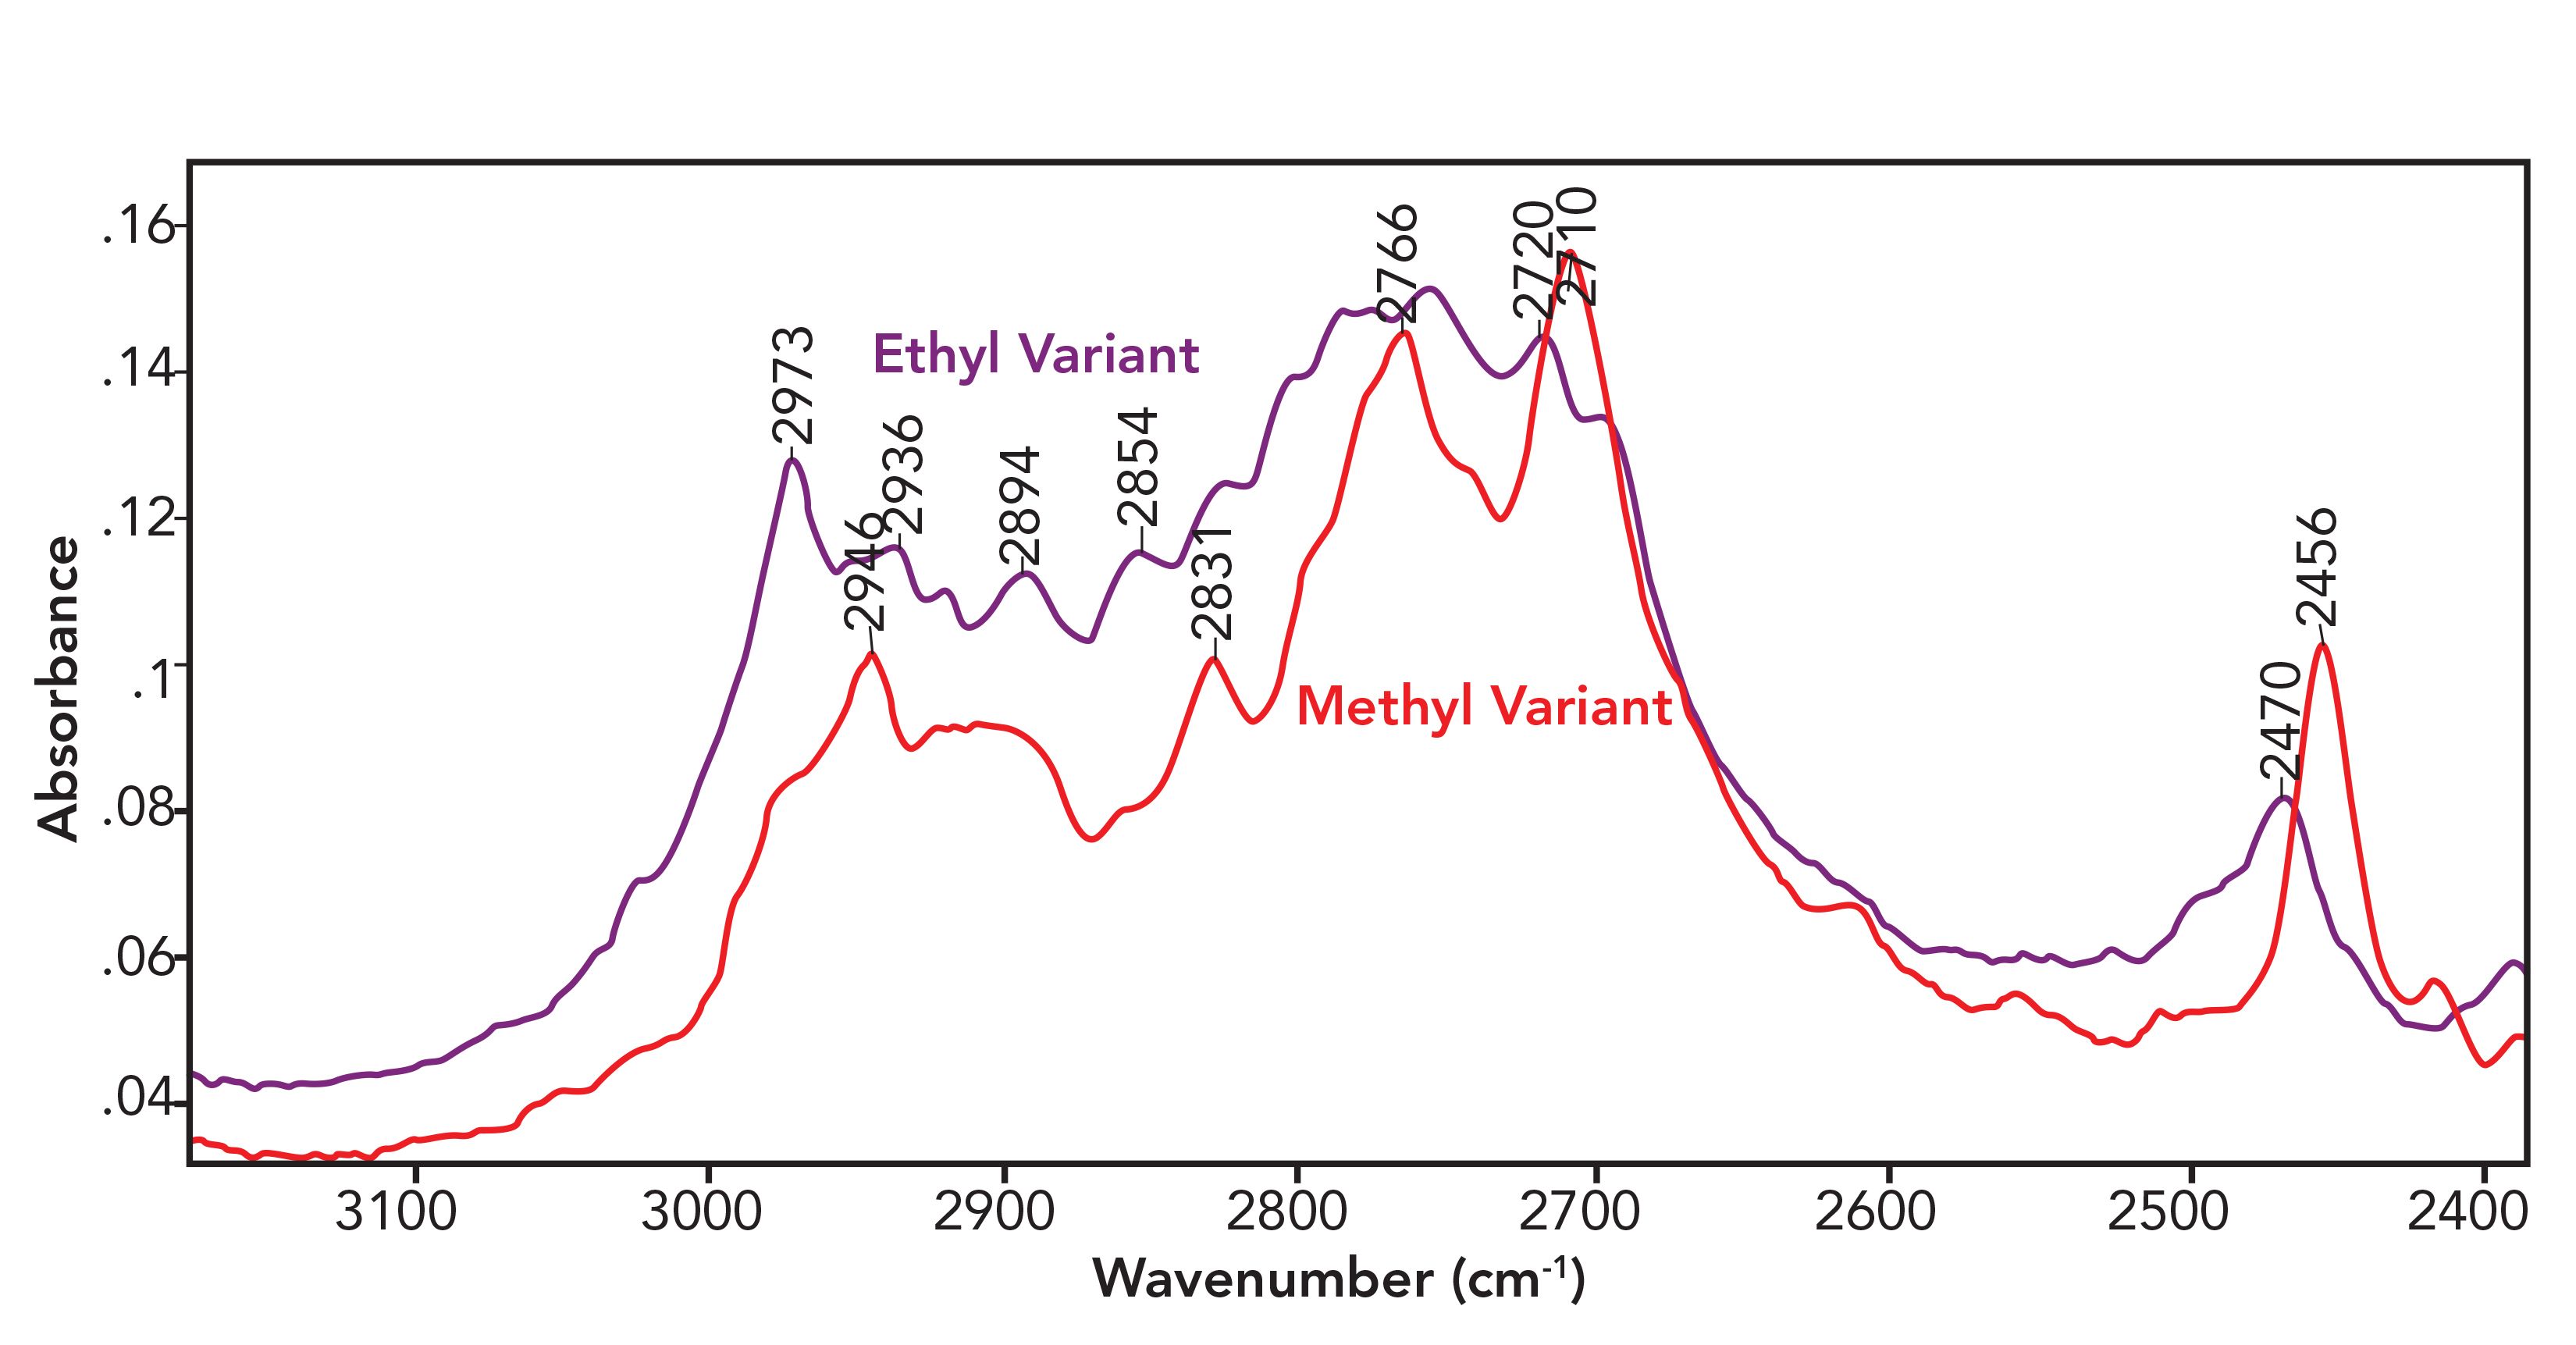
Some years ago, while I was consulting for a forensics laboratory, they had a prob- lem distinguishing between the methyl (CH3-) and ethyl (CH3-CH2-) variants of a controlled substance using library searching. They were using the sample’s full spectrum in the search. Considering the chemical differences between the two variants, I thought it made sense to look at the C-H stretching region, which is from 3200 to 2800 cm-1 as we have discussed in previous columns (2). A comparison of the spectra of the two variants in this region is seen in Figure 1.
FIGURE 1: A comparison of the C-H stretching region of the methyl and ethyl variants of a controlled substance. Note the differences between the spectra.

Note that the spectra are similar but not identical. By narrowing the wavenumber region used in the search to that seen in Figure 1, a library search was then able to distinguish between these two variants and the problem was solved. This a real and powerful example of how judiciously choosing the spectral regions used in a search can improve search results.
What Search Algorithm Should I Use?
A search algorithm is the mathematical calculation used to compare two spectra to each other and generate a HQI. A discussion of these algorithms is beyond the scope of this article, but you can find more info in the help function of your library search software or here (9).
Most library searching software packages present you with a choice of search algorithms. The differences between these algorithms is that some emphasize peak position, some emphasize peak height, and some strike a balance between the two. Algorithms with the word “derivative” in them tend to emphasize peak positions, algorithms with the words “absolute” or “absolute value” tend to emphasize peak heights, and two algorithms that strike a balance are euclidean distance and correlation (9).
From my own experience, I find that balanced algorithms, such as correlation and euclidean distance, are good for general search purposes. However, if a given search algorithm does not produce satisfactory results, it is all right to change the search algorithm and see if it improves your results. It is generally easy to switch search algorithms in library search software packages, so this is a parameter you can experiment with.
The Search Report
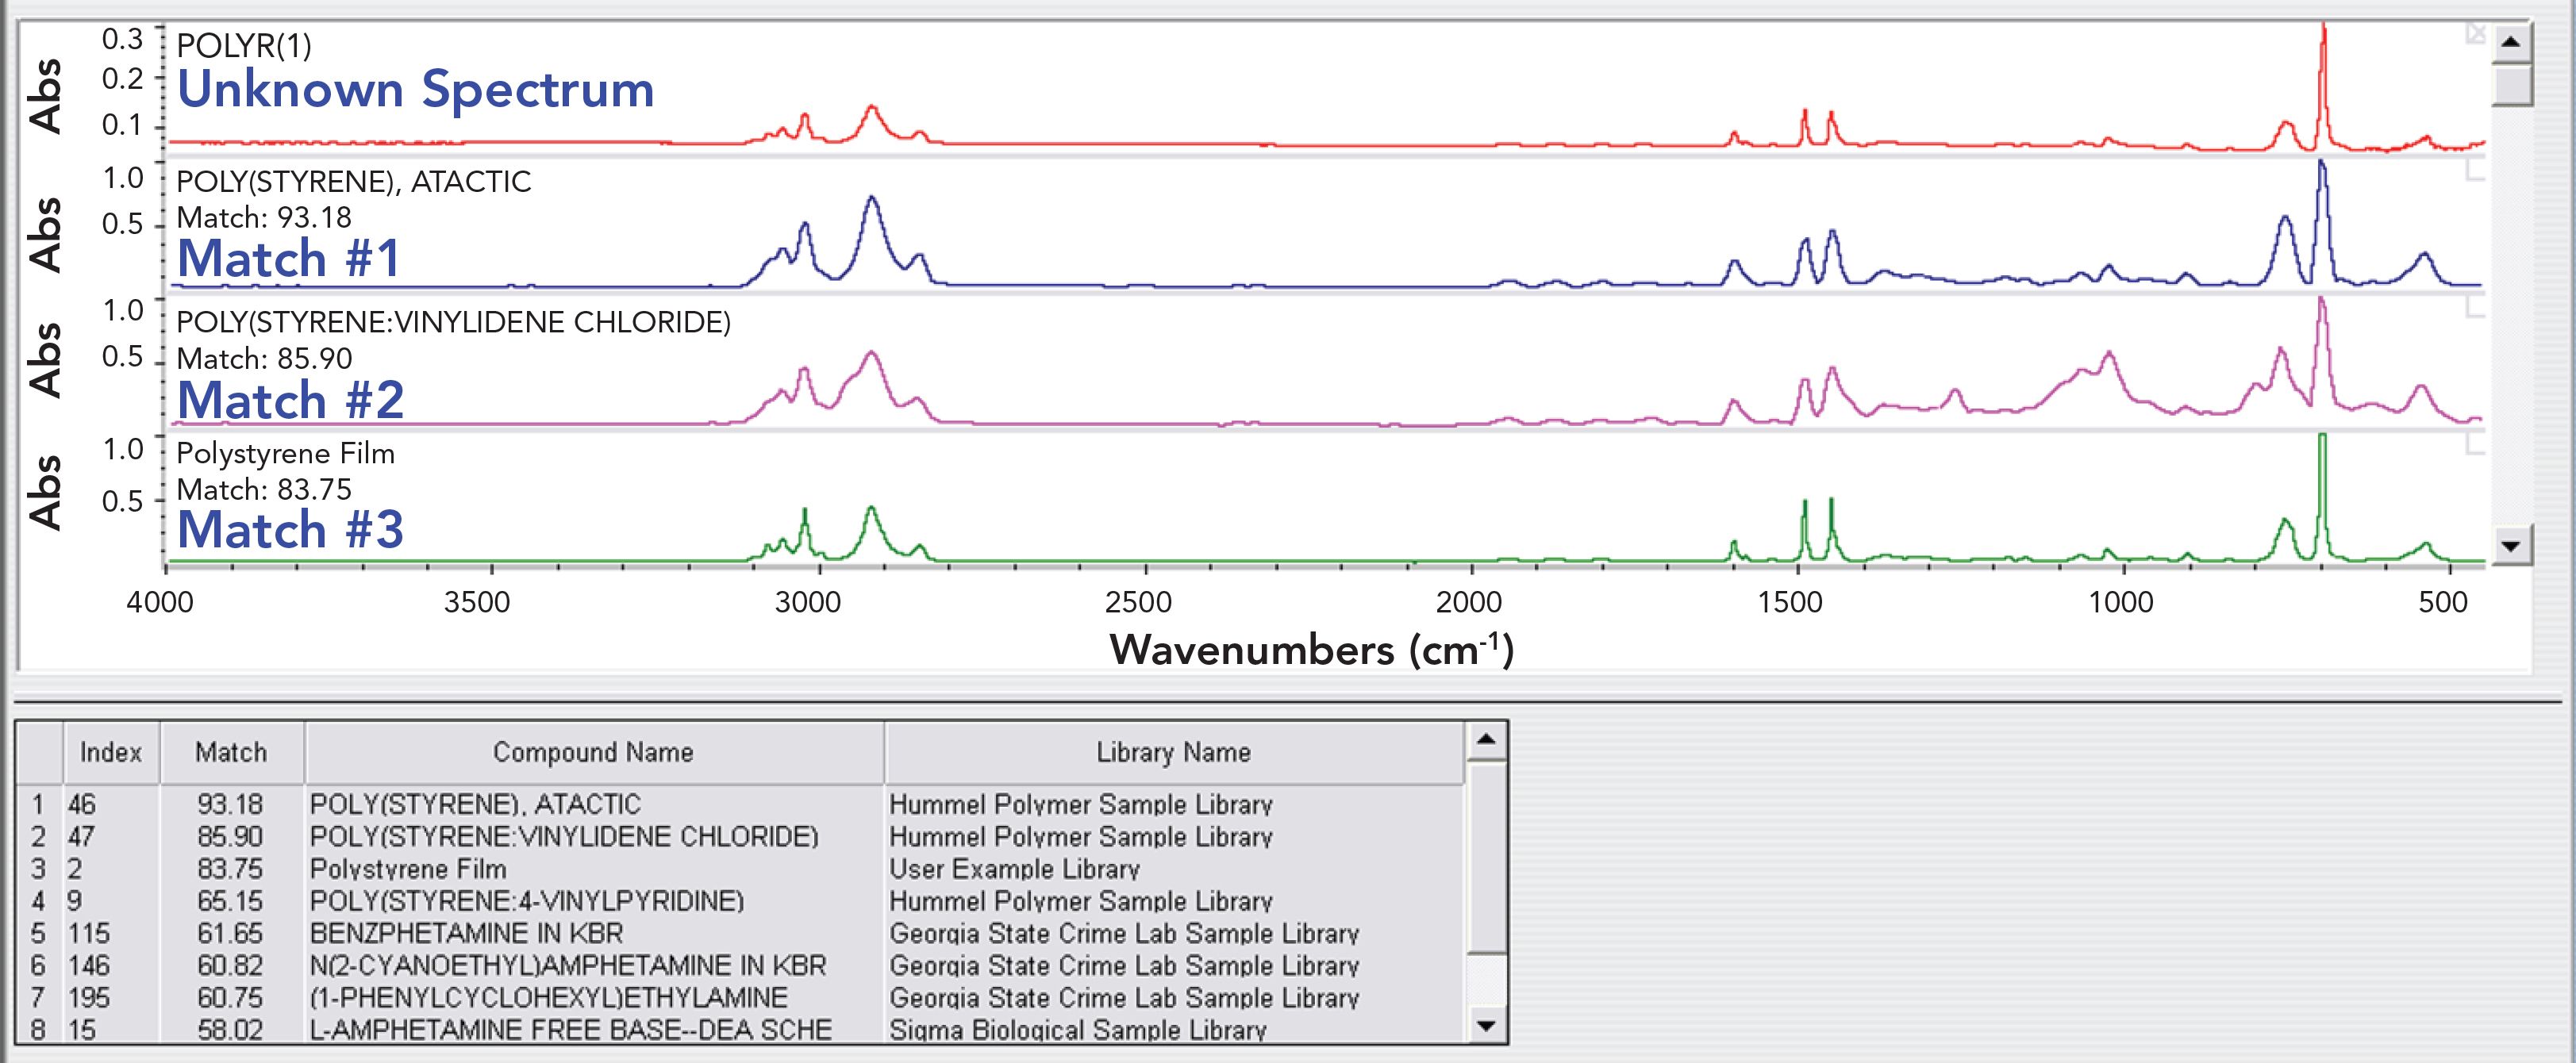
Recall that the number of spectral comparisons performed equals the number of spectra in your library. Manually sorting through all these matches would be a challenge, but fortunately the search software program organizes the hits and presents the best ones in the form of a search report. An example of a search report is seen in Figure 2. The “unknown” spectrum was of pure polystyrene, and the correlation search algorithm was used.
FIGURE 2: An example of a search report. The sample spectrum was of pure polystyrene, and the correlation search algorithm was used.

The table at the bottom of Figure 2 lists the identity of the eight best hits along with the HQIs and the library where the example spectrum was found. In the software used in this example, a 0 to 100 HQI scale was used, where 100 is a perfect match, and 0 is the worst possible match. Also note that the search report shows the sample spectrum and the spectra of the best matches. The best match, with an HQI of 93.18, is of pure polystyrene, which is good and expected. The second best match, with an HQI of 85.90, is of a mixture of polystyrene and another polymer. This makes sense, since impure polystyrene should be a worse match than pure polystyrene.
Making Sense of the HQI
HQIs are useful indicators of spectral similarity, but they are not perfect. Random similarity in the noise and artifacts between two spectra can give search results more similar than reality. Conversely, random differences in noise and artifacts between two spectra can make them poorer matches than reality. This is why the HQI by itself should never be used identify a sample. I have seen inexperienced people look at a search report, incorrectly assume the first match in the table identifies the sample, and suffer career-ending consequences.
Search algorithms are just mathematical formulas; they do not understand spectroscopy or chemistry and make mistakes. I cannot emphasize enough the importance of always visually comparing the sample spectrum to that of the best library matches. The HQI is not a measure of the probability of having found the right answer; it is not a measure of purity. It is strictly used to organize the matches for a given search. The search will always produce a result whether there are any good matches or not, and the fact that there is a result does not mean you have identified the sample.
Ultimately, it is your job as the user of the search software, and not the computer’s (since you have a brain and eyeballs), to make the final conclusion as to the identity of a sample based on a library search. The library search narrows things down for you; it is your job to make the final decision as to whether two spectra are a match or not.
How then do we interpret the HQI? At minimum, the range of the HQI can be useful. Assuming a 0 to 100 HQI scale as discussed above, matches between 80 and 100 are excellent and may be good enough to obtain an identification. HQIs between 50 and 80 are good, but typically not good enough for a complete identification. However, you can often times obtain information about the functional groups present from matches of this quality. Lastly, a HQI less than 50 is a poor result, and is generally not useful.
What Do I Do About Poor Search Results?
You could panic, but that is not an appropriate response for a scientist, unless said scientist is being chased by a grizzly bear (more on that in a later column). Ultimately, bad library search results are not necessarily your fault—you are at the mercy of the libraries you have access to. If, by chance, your unknown looks nothing like any of the spectra in your libraries, there is not much to be done about it. This is an argument then for having access to a large number of library spectra so you can maximize the probability of finding a good match. Additionally, remember that you can experiment with wavenumber regions and search algorithms to try and improve your search results.
Conclusions
Infrared spectral library searching is useful in identifying unknowns and in mixture analysis. It works by mathematically comparing your sample spectrum to a collection of spectra kept in a digital library. HQI measures how similar or different two spectra are. However, the HQI only ranks the quality of the matches for a given search, and should not be used by itself to make an identification. Visual comparison of the sample and library spectra should be used in combination with the HQI achieve a sample identification. Experimenting with the search algorithm and wavenumber region may improve search results.
References
(1) B. C. Smith, Spectroscopy 30(7), 26–31, 48 (2015).
(2) B. C. Smith, Spectroscopy 30(9), 40–46, (2015).
(3) www.sadtler.com.
(4) Wiley Acquires Bio-Rad’s Informatics Spectroscopy Software and Spectral Databases | Business Wire
(5) KnowItAll IR Spectral Database Collection - Wiley Science Solutions
(6) FT-IR Spectral Libraries Nicolet/Aldrich Condensed Phase Library, edition 2 | Sigma-Aldrich
(7) Spectra Databases - katja-hm (jimdofree.com).
(8) FDM FTIR and Raman Libraries (www.fdmspectra.com).
(9) B.C. Smith, Fundamentals of Fourier Transform Infrared Spectroscopy 2nd Edition (CRC Press, Boca Raton, 2011).

Brian C. Smith, PhD, is the founder and CEO of Big Sur Scientific, a maker of portable mid-infrared cannabis analyzers. He has over 30 years experience as an industrial infrared spectroscopist, has published numerous peer-reviewed papers, and has written three books on spectroscopy. As a trainer, he has helped thousands of people around the world improve their infrared analyses. In addition to writing for Spectroscopy, Dr. Smith writes a regular column for its sister publication Cannabis Science and Technology and sits on its editorial board. He earned his PhD in physical chemistry from Dartmouth College. He can be reached at: SpectroscopyEdit@ MMHGroup.com

AI Shakes Up Spectroscopy as New Tools Reveal the Secret Life of Molecules
April 14th 2025A leading-edge review led by researchers at Oak Ridge National Laboratory and MIT explores how artificial intelligence is revolutionizing the study of molecular vibrations and phonon dynamics. From infrared and Raman spectroscopy to neutron and X-ray scattering, AI is transforming how scientists interpret vibrational spectra and predict material behaviors.
Real-Time Battery Health Tracking Using Fiber-Optic Sensors
April 9th 2025A new study by researchers from Palo Alto Research Center (PARC, a Xerox Company) and LG Chem Power presents a novel method for real-time battery monitoring using embedded fiber-optic sensors. This approach enhances state-of-charge (SOC) and state-of-health (SOH) estimations, potentially improving the efficiency and lifespan of lithium-ion batteries in electric vehicles (xEVs).
New Study Provides Insights into Chiral Smectic Phases
March 31st 2025Researchers from the Institute of Nuclear Physics Polish Academy of Sciences have unveiled new insights into the molecular arrangement of the 7HH6 compound’s smectic phases using X-ray diffraction (XRD) and infrared (IR) spectroscopy.