New Devices in the Infrared Provide Sensitivity, Speed, and Size Improvements
Spectroscopy
Infrared reflectance and absorption spectroscopy have been practiced for decades. New capabilities in detectors and light sources are quickly changing the landscape in the near- and mid-infrared, where fundamental vibrations and overtone bands allow sensitive measurements in applications related to food safety, precision agriculture, energy, and smart manufacturing, to name a few. This article outlines some of the most recent innovations and how they might be applied in real-world systems.
Infrared reflectance and absorption spectroscopy have been practiced for decades. New capabilities in detectors and light sources are quickly changing the landscape in the near- and mid-infrared, where fundamental vibrations and overtone bands allow sensitive measurements in applications related to food safety, precision agriculture, energy, and smart manufacturing, to name a few. This column installment outlines some of the most recent innovations and how they might be applied in real-world systems.
The pace of innovation accelerates, but is typically a step behind the pace envisioned by the truly innovative. However, technology developments are changing the landscape of spectroscopy in the infrared (IR) very quickly, perhaps surprising even the optimists. As recently as a few years ago it was a correct statement (paraphrasing from several textbooks) to say that most practical devices in the mid-IR are interferometric, such as Fourier transform infrared (FT-IR) spectrometers, and most devices in the near-infrared (NIR) are dispersive. Indeed, the dominance of FT-IR (mid-IR) and grating-based or single-channel NIR spectrometers was nearly complete through the 1990s.
New technologies have come online to challenge that dominance-changing the landscape in terms of measurement sensitivity, speed, and size. In many cases, the technologies allow improvements in industrial and field measurements. This article is a brief introduction to some of these improvements, meant to familiarize the reader with the methods and capabilities of some of the newer technologies.
Tunable Diode Laser Spectroscopy
The phrase tunable diode laser refers to a family of lasers based on an active (gain) medium sandwiched between a p-n diode. Carriers pumped into the gain medium excite the medium and produce light tuned to the bandgaps in the semiconductor. From the first diode emission in the 1960s, decades of research evolved new, more efficient semiconductor and cavity arrangements, such as the double heterostructure laser and the distributed feedback (DFB) lasers. Tunable diode lasers (TDLAS) in the NIR evolved quickly with these innovations, and as the backbone of fiber-based communications, which evolved rapidly in the decade 1995–2005.
Intrigued by the proliferation of new devices, particularly as laser diode technology gained reliability and power in the NIR, during this time research groups such as Ron Hanson’s at Stanford, Southwest Sciences, and others pioneered the use of TDLAS for measurement of small molecules. Common targets range from H2O, CO, and CO2 in combustion products to NH3 in emissions from ammonia slip, as well as CH4, H2S, and other light fuel components. In that period, measurements of particular molecules were driven as much by the availability of lasers at the appropriate wavelength as anything else. Venture-backed Zolo Technologies (born in 1999 and funded by several well-known venture capitalists) grew up to compete with large, established players such as Siemens and others.
TDLAS typically works by modulating the wavelength of the laser over a particular absorption transition. The center wavelength of the laser can be temperature and current-tuned over a small wavelength range of typically 1–2 cm-1 by using a thermoelectric cooler (TEC) that is typically integrated with the laser. Modulation can be achieved by rapidly varying the injection current to the laser. The combination of a relatively slow sweep (for example, 50–500 Hz) with a rapid modulation (5–100 kHz) allows wavelength scanning with rejection of typical noise sources, which are 1/f noise-that is, they quickly decrease with increasing frequency.
A lock-in detector then compares the modulation current with the laser drive current, detecting signals at the fundamental frequency f and also the harmonic frequencies 2f, 3f, and so forth. Typical signals are shown in Figure 1, where the x-axis represents the difference between the laser center frequency and the center of the absorption transition being probed, and the y-axis is the relative intensity of the detected signal. Such signals look like derivatives of the absorption line (which may be more Gaussian or Lorentzian depending on pressure, and which is typically fitted with a Voigt profile), with the number of the harmonic corresponding to the appearance of the corresponding first, second, and so on, derivatives. In practice, second harmonic signals are typically used for measurements because they have a zero background.
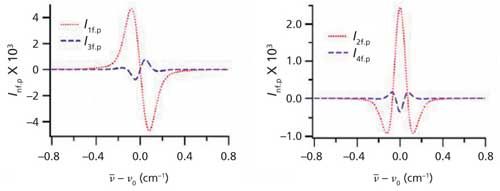
Figure 1: Harmonic signals corresponding to TDLAS absorption.
Present-day hardware can be used to obtain excellent performance from TDLAS systems. For example, the author has been involved in studies that easily obtained single-pass detection limits on the order of 10–100 ppm for CO, CO2, and other small molecules over a 1-m pathlength in operating combustion systems. Automatic beam-finding or beam-steering systems, purge gas protection, and other innovations all make TDLAS suitable for in situ measurements in harsh environments. Numerous commercial systems have reported detection limits of 1–20 ppm for a host of small molecules, in-process, and with long-path cells, detection limits in the parts-per-billion (ppb) range can easily be obtained.
Applications for TDLAS have included two-dimensional (2D) cross-sectional mapping of concentrations and temperature in furnaces to minimize combustion imbalances, measurements of CO and CO2 in steelmaking to optimize carbon content of steel, and measurements in refining processes, among others. Path-integrated measurements return the “average” along the beam path; this approach can cause difficulties in inhomogeneous environments, but with sufficient numbers of measurements it is possible to tomographically back out the correct value (concentration or temperature) at a point.
Photoacoustic Spectroscopy
Whereas TDLAS measures optical absorption in gases directly using relatively inexpensive telecommunications-grade equipment, photoacoustic spectroscopy uses a microphone to measure sound emitted (pressure rise) because of the absorption of light. The light must be modulated in some manner to obtain a time-varying signal for a given concentration of gas. Gases are introduced into a photoacoustic cell, which is outfitted with a sensitive microphone. Light corresponding to molecular transitions can be introduced in three basic ways (in increasing order of complexity):
- using a broadband light source, a filter wheel with bandpass filters corresponding to absorption wavelengths of various gases, and a mechanical chopper to provide the modulation of the light;
- using tunable diode lasers (as above) tuned to particular molecular transitions, and modulated directly, with each molecule typically requiring a dedicated laser; or
- using a quantum cascade laser (QCL, see that section later in this article), which can be tuned to any one of several molecular transitions, and modulated directly.
One of the strengths of photoacoustic spectroscopy is that it is inherently a background-free method. Because the measured quantity (sound or pressure rise) is a secondary effect of the optical absorption, there is no background interference at the modulation wavelength, assuming that the electronics driving the light source are independent of the detection electronics. This is in contrast with TDLAS, in which there is an inherent background from the unabsorbed light on the detector. In addition, in TDLAS there are more complicated corrections, such as the swept optical modulation causing intensity changes over the wavelength of the transition.
In the past, the use of capacitive (condenser) microphones was a limitation in sensitivity and also presented issues of nonlinearity. As microelectrical-mechanical system (MEMS) microphones have advanced, driven largely by widespread adoption in cell phones, these have enabled large improvements in sensitivity and linearity. In particular, Gasera has adopted a patented cantilever MEMS microphone design for all of their photoacoustic spectroscopy offerings. A laser interferometer is used to read the displacement of the MEMS-fabricated cantilever to high accuracy. This microphone design has allowed detection limits of low- or sub-parts-per-billion levels for a variety of gases. Figure 2 shows the measurement of a time-varying concentration of hydrofluoric acid (HF) over time with a photoacoustic instrument equipped with a QCL laser.
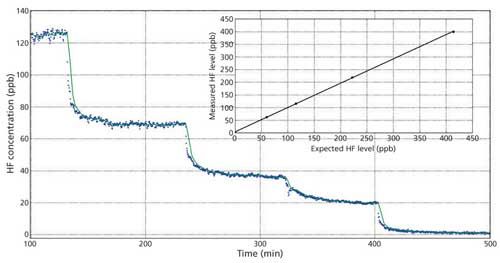
Figure 2: Measurement of time-varying HF concentration over an 8-h period with the Gasera One photoacoustic spectroscopy system. The initial HF concentration was diluted in steps with compressed laboratory air as shown, and the line represents a rolling average of the experimental measurements. The inset graph illustrates the accuracy of the system.
Photoacoustic spectroscopy does require that gases be sampled into a cell for analysis. In some cases, particularly for higher modulation frequencies, specially designed resonant cells may provide a large advantage. Work is continuing on flow-through cells, while most quantified measurements are presently accomplished in static cells. Flow-through cells would have an obvious advantage in more continuous sampling and faster instrumental response. Solids, semisolids, and liquids can also be measured by photoacoustic spectroscopy. Most gases that can be measured with TDLAS or QCLs (see below) are also candidates for photoacoustic spectroscopy.
Quantum Cascade Lasers and Devices
Innovation in QCLs has been relatively rapid since their invention in 1994. These lasers, instead of using a p-n junction as does a typical diode laser, use a series (a “cascade”) of semiconductor active regions. Thus, one initiating electron can result in many emitted photons. This gives QCLs comparatively more gain than diode lasers. Because the QCLs have varying material composition and layer thickness along their structures, there are many more accessible energy states than in a typical diode laser, giving much greater tunability to the QCLs. The intersubband transitions that are used in QCLs are generally lower energy than the typical interband transitions in most diode lasers, so wavelengths of QCLs are longer than the wavelengths of most diode lasers centered in the mid-IR.
Quickly after their invention, commercial Fabry-Perot QC lasers became available, and in 2004, distributed feedback QCLs were available, which allowed single-mode operation. These have been shown to be tunable to nearly 1% of their center wavelength. However, a big jump in the capabilities of QCLs came in 2006, when Daylight Solutions introduced their external cavity QCL system. This system, and similar systems from Block Engineering, can tune QCLs from 10% to 15% of their center wavelength. Several hundred wavenumbers of tuning range in the IR allows interrogation of multiple target analytes with a single laser device. Because QCLs are in the mid-IR, the transitions that they access are typically the fundamental vibrations, rather than the weaker overtone transitions that are accessed in the near-IR by TDLAS. Figure 3 shows an example of hydrocarbons measured in the mid-IR “fingerprint region” using a QCL. This busy spectrum shows unique features of these C1–C5 hydrocarbons, which can be easily quantified. Measurements of individual hydrocarbons and the distribution of C1–C5 hydrocarbons are both important in refining applications, among others. The high spectral irradiance of the QCLs results in a combination of overall measurement speed (10 Hz) and detection limits (typically low parts-per-million level) that can be a real benefit for industrial or real-time applications.
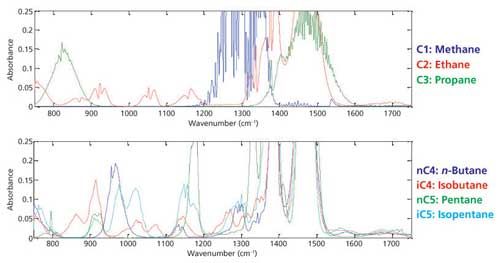
Figure 3: Overlaid C1–C5 mid-IR spectra obtained using a widely tunable QCL operating in the information-rich “fingerprint region.” Chemometric algorithms can be used to easily quantify molecules, including isomers of C4 and C5. Figure courtesy of Block Engineering.
QCL devices were first packaged singly, and presently both Block Engineering and Daylight Solutions have products that combine up to four QCLs in a single device. In these devices, the lasers are combined into a single collimated output that can provide high power (multiwatt) and mode-hop-free tuning over a substantial range, typically 250+ cm-1 per laser and thus up to 1000 cm-1 per device. This high speed tuning (tens of milliseconds over the range), combined with high spectral brightness, has benefits for many applications. The lasers can operate in pulsed or continuous wave (CW) modes, allowing different averaging and sampling strategies to fit the application. Figure 4 illustrates a CO2 spectrum taken in pulsed mode with a QCL device, with the resulting spectrum (top) compared with the database spectrum from the Pacific Northwest National Laboratory (PNNL). Line positions and overall spectral shape are very accurately reproduced. In pulsed mode, scan rate and step size can be adjusted, and averaging is user-determined. QCL systems can also be used for isotope determination in carbon, which can be important in energy exploration applications.
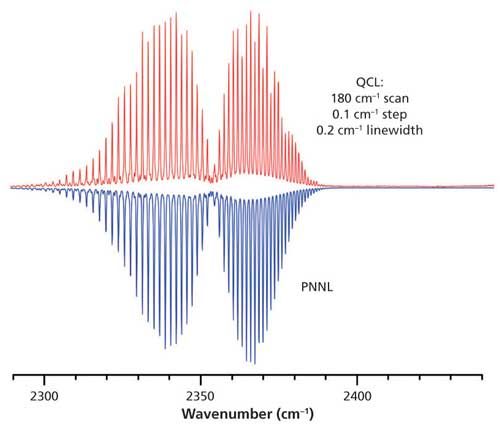
Figure 4: A CO2 spectrum from the ChemDetect QCL compared with the PNNL database spectrum. This system operates in pulsed mode, allowing high peak power. Figure courtesy of Daylight Solutions.
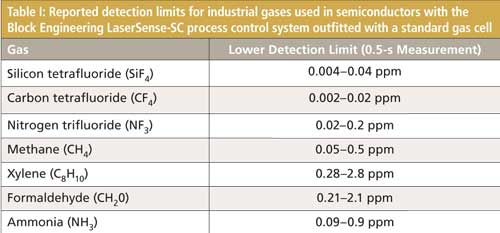
Although the typical FT-IR system still has a much larger range (for example, 3500 cm-1 or more), the low comparative brightness of the source, larger size, and lower resolution all limit these traditional devices for more-portable or industrial field use. Dedicated gas detection systems for particular applications are being realized. Table I, for example, shows detection limits of the LaserSense-SC semiconductor process control system (Block Engineering) with a 6-m pathlength cell. Applications to gas sensing in energy exploration and production, refining, workplace safety, and industrial processes are high on the list of applications.
Miniature Spectrometers
Compact multichannel spectrometers, pioneered by Ocean Optics, are increasingly being challenged by even smaller cousins based on MEMS designs and architectures. As increasingly complex optical structures can be implemented in silicon, devices integrating Fabry-Perot and even Michelson interferometers have been realized in tiny silicon packages. Although the performance of such packages is still evolving, it appears possible to challenge or even exceed compact multichannel spectrometers with MEMS device performance in many ways.
An example of this new technology includes Si-Ware’s Michelson interferometer-based Neospectra spectrometer. With a spectral resolution of about 15–20 cm-1, these systems have “good enough” resolution for many applications and are packaged with software toolkits for developers. The spectrometer has a few different ranges available in the NIR. Another system available for developers is the more expensive DLP (digital light processor) chip from Texas Instruments. This micromirror array can act as a programmable wavelength selector. If dispersed light impinges on the chip, the array can be controlled to direct various portions of the light to detectors, with control at rates as high as 8 kHz. The chips come in various sizes, some exceeding 1 megapixel. These extremely interesting devices, with a primary market in video display technology, are also marketed for third-party integration into new spectroscopy systems.
A more complete offering is Spectral Engines’ line of MEMS spectrometers. Spanning the range from NIR to mid-IR, sensors are available from 1.35 µm to 4.3 µm, each covering a range of 300–700 nm, depending on the spectrometer model. These systems are packaged as handheld devices complete with long-life tungsten light sources and temperature-stabilized detectors, or as original equipment manufacturer (OEM) modules, connected via Bluetooth or universal serial bus (USB). Based on Fabry-Perot technology, these systems have a high dynamic range and typical signal-to-noise ratio of more than 10,000 with a 0.1-s measurement time.
Such miniature spectrometers open up substantial opportunities for innovation. Figure 5 shows various types of polyvinyl chloride (PVC) plastic measured with the Spectral Engines NIR sensor. Traditional IR applications, such as gas sensing, moisture sensing, agricultural, and food applications become much simpler to do with a compact and very economical sensor. Early applications have tended to emphasize NIR targets with reflectance spectroscopy. Measurement of moisture in grains and foodstuffs, for example, is an application with a need for simple, portable sensors. With the comparatively low price point of these MEMS spectrometers, there is substantial reason to believe that they will provide an excellent platform for innovation.
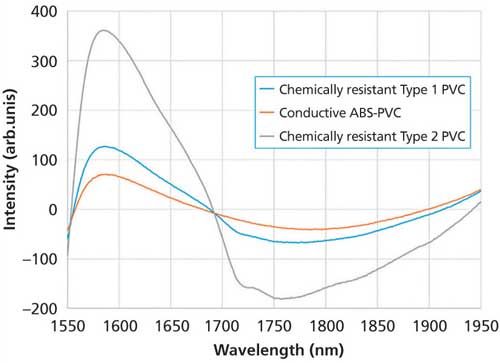
Figure 5: Measurements of various PVC plastics with a Spectral Engines NIR sensor.
Summary
The last decade has seen a proliferation of new IR optical devices with roots in traditional spectroscopy, but benefitting from advances in laser science and MEMS fabrication technologies. New laser sources continue to evolve, thanks in large part to the telecommunications industry, and new MEMS devices such as the cantilever microphone and silicon-based spectrometers are taking commercial root. Molecular sensing is rapidly being revolutionized by new, more sensitive, smaller devices that make our factories more efficient, our food safer, our harvests more abundant, reduce emissions, and energy exploration easier. It’s never been a better time to be a spectroscopist!
Steve Buckley, PhD, is the President of Flash Analysis and a consultant to the spectroscopy industry. A former UCSD faculty member, he is a spectroscopist, entrepreneur, and technological enthusiast. Direct correspondence to: SpectroscopyEdit@UBM.com

AI Shakes Up Spectroscopy as New Tools Reveal the Secret Life of Molecules
April 14th 2025A leading-edge review led by researchers at Oak Ridge National Laboratory and MIT explores how artificial intelligence is revolutionizing the study of molecular vibrations and phonon dynamics. From infrared and Raman spectroscopy to neutron and X-ray scattering, AI is transforming how scientists interpret vibrational spectra and predict material behaviors.
Real-Time Battery Health Tracking Using Fiber-Optic Sensors
April 9th 2025A new study by researchers from Palo Alto Research Center (PARC, a Xerox Company) and LG Chem Power presents a novel method for real-time battery monitoring using embedded fiber-optic sensors. This approach enhances state-of-charge (SOC) and state-of-health (SOH) estimations, potentially improving the efficiency and lifespan of lithium-ion batteries in electric vehicles (xEVs).
New Study Provides Insights into Chiral Smectic Phases
March 31st 2025Researchers from the Institute of Nuclear Physics Polish Academy of Sciences have unveiled new insights into the molecular arrangement of the 7HH6 compound’s smectic phases using X-ray diffraction (XRD) and infrared (IR) spectroscopy.