Non-Destructive Red Wine Measurement with Dispersive 1064 nm Raman Spectroscopy
Application Notebook
Owing to technological improvements spurred on by the telecommunications boom of the last decade, Raman spectroscopy has become much more accessible to users in all application areas, including agricultural, forensic, pharmaceutical, biomedical, and others.
Owing to technological improvements spurred on by the telecommunications boom of the last decade, Raman spectroscopy has become much more accessible to users in all application areas, including agricultural, forensic, pharmaceutical, biomedical, and others. However, there remains a struggle to extract useful Raman spectra from fluorescent and luminescent samples.
Most users with fluorescent samples switched to near-infrared wavelengths such as 785 nm and 830 nm to avoid fluorescence. But now, BaySpec's new dispersive 1064 nm Raman spectrometer family offers a turn-key solution combines the speed, sensitivity, and ruggedness of the dispersive Raman instruments with superior fluorescence avoidance of traditional FT-Raman.
Any new method for routine determination of chemical composition in beverage manufacturing processes should be non-invasive, non-destructive, and rapid. Raman spectroscopy offers the advantages of minimal sample preparation and fast spectral collection. However, the pigments in red wines are usually too fluorescent to allow Raman to be measured, even at 785 nm. But at 1064 nm, a clear Raman spectrum is generated while florescence background is almost totally avoided.

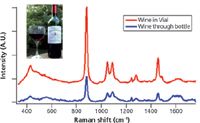
Figure 1: Identification of methanol in red wine based on its unique Raman features different from ethanol.
Further, glass is mostly transparent to NIR wavelengths, compared to 532 nm and 785 nm, which makes 1064 nm Raman even more suitable for non-destructive measurement of red wine through the bottle. As in Figure 1, comparing the red wine spectrum in a secondary vial with that collected through the bottle, despite a small attenuation in the signal intensity, the Raman features are maintained and distinguishable for further identification and quantification.
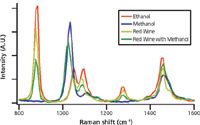
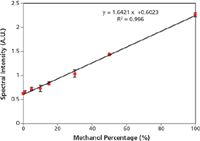
Further component analysis was performed by adding methanol into the wine and measuring as before. As seen in Figure 2, most of the Raman features from pure red wine could be easily identified as ethanol. For the Raman spectrum of red wine with methanol added, a Raman peak centered around 1020 cm-1 is apparent, and this peak can be utilized for the quantification of the methanol concentration profile in different red wine samples as seen in Figure 3. Slight variances in spectral intensity on different measuring spots were found due the heterogeneity of the bottle glass.

Figure 2: Identification of methanol in red wine based on its unique Raman features different from ethanol.
Based on these experiments, 1064 nm dispersive Raman is demonstrated as a viable new option to determine wine composition and contamination in the bottle. Chemometrics tools such as principal component analysis (PCA) and partial least squares regression (PLS) can significantly increase the accuracy and precision. It can be expected that future development of such applications may provide the wine industry a fast and non-destructive quality control and assurance tool for composition monitoring. This methodology can be easily applied to distilled spirits, beer, and others.

Figure 3: Quantification of methanol concentrations in red wine based on the intensity of one major Raman feature.
BaySpec, Inc.
1101 McKay Drive, San Jose, CA 95131
tel. (408) 512-5928, fax (408) 512-5929
Website: www.bayspec.com

A Seamless Trace Elemental Analysis Prescription for Quality Pharmaceuticals
March 31st 2025Quality assurance and quality control (QA/QC) are essential in pharmaceutical manufacturing to ensure compliance with standards like United States Pharmacopoeia <232> and ICH Q3D, as well as FDA regulations. Reliable and user-friendly testing solutions help QA/QC labs deliver precise trace elemental analyses while meeting throughput demands and data security requirements.