Not Too Hot: The Importance of Optimizing Laser Power for Surface-Enhanced Raman Spectroscopy (SERS) Measurements
The ability to enhance the Raman signal from low concentrations of molecules using nanoparticles has made surface-enhanced Raman scattering (SERS) an attractive approach for trace detection in diverse applications in medicine, energy and the environment (1). Understanding SERS has improved significantly since the initial discovery in the 1970s (2,3). The detection and imaging, via tip-enhanced Raman scattering (TERS), of individual molecules suggests the ultimate in detection sensitivity (4–7). Particularly, recognizing how the energy from the excitation laser is concentrated by the nanoparticles through localized surface plasmon resonances has helped foster understanding of the appropriate experimental conditions to use for SERS measurements. Hot spots are important for generating the largest enhancements (8). In addition to enhancing the local electric field, other effects can occur on the surface of nanoparticles and impact the observed signals. Considering how the excitation laser intensity is concentrated and confined into small regions, it is important to consider the incident laser power. When performing SERS experiments, the excitation laser power needs to be kept at a level that enables detection but avoids damaging the sample.
Generally, surface-enhanced Raman spectroscopy (SERS) practitioners often recommend the laser power be kept below 1 mW in a diffraction limited laser spot. The spot size in a microscope objective can be approximated by the diffraction limit below

where changes with the numerical aperture (NA) of the objective and laser wavelength (λ) will alter the spot size. 1 mW of power in a 1 μm spot diameter corresponds to an energy density of approximately 1 mW/μm2 (equivalent to 105 W/cm2), which is a common experimental condition for many SERS experiments. High NA objectives and shorter wavelength lasers require lower powers. Similarly, other factors that lower the energy density can also prevent sample damage in SERS experiments.
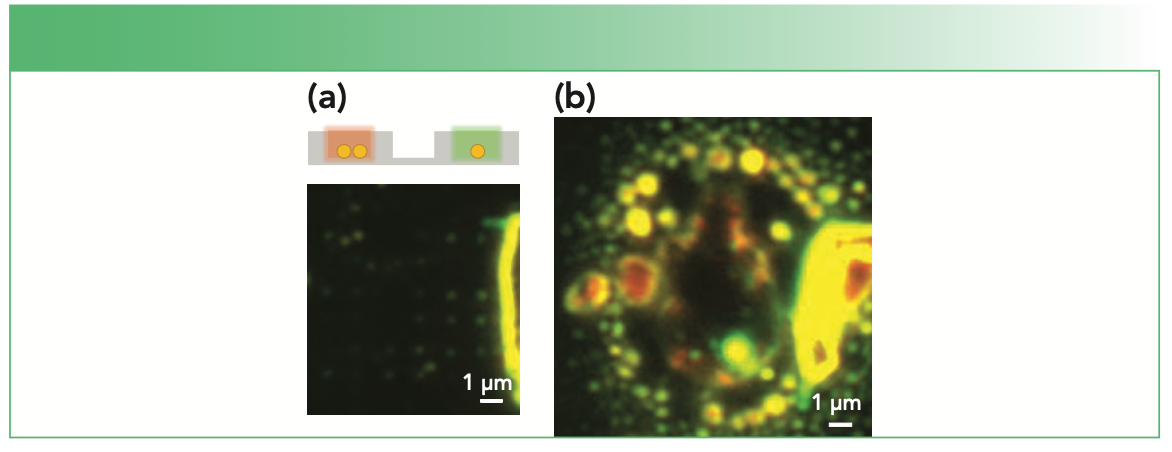
Figure 1 gives an illustrative example of how too much laser excitation can significantly damage a sample. In this example, individual nanoparticles and nanoparticle dimers were confined in an array of lithographically fabricated wells on the surface. Single nanoparticles are evident as green spots in the dark field image on the left. Coupling between nanoparticles to form a dimer causes the scattering to appear red from some of the wells in the darkfield image. After exciting with a few milliwatts (1–2 mW) of 633 nm laser excitation, the energy released destroyed the sample as shown on the right. Figure 1 is relatively dramatic, and the exact mechanism of the damage is unclear; however, it illustrates that small amounts of laser power can detrimentally impact your experiment.
FIGURE 1: Example of photo damage in SERS. (a) The dark field scattering image of a regularly spaced array of holes containing either a single or pair of nanoparticles is shown. The color of the scattering is green for single particles and becomes redder in color for dimers. (b) The damage observed to an array is shown (yellow and red colors) after a few milliwatts of 633 nm laser illumination. The scale bar is the same in both images.

There are several ways increased laser power is detrimental to SERS. For example, sustained heating at 250 °C converts nanorods into nanospheres in less than an hour (9). The strong dependence of the SERS signal on the nanostructure shape and spacing means melting can easily diminish the observed SERS intensity. In my own laboratory, we have seen that the temperature increase associated with increased laser power has a detrimental effect on the SERS signal (10). The energy absorbed and heat produced by the nanoparticles can easily exceed 250 °C for aggregated nanoparticles in air. Keeping the nanoparticles in a medium with higher heat dissipation (water as opposed to air) during the SERS measurement can minimize the heat-related damage. Generally, photo-induced heating is minimized by providing a way for heat to dissipate. Laser power has also been reported to damage the molecules present on the nanoparticle surfaces. This is also not too surprising, because the same plasmonic nanoparticles that are used for signal enhancement are also used for chemical catalysis, where the excited electrons accelerate chemical reactions at the nanoparticle surface (11). When molecules capture these energetic electrons, bonds can break or the vibrations of the molecule change, which alters, or even destroys, the SERS signal (12,13). This effect may explain changes between the spontaneous Raman spectrum and the observed SERS spectrum for any given molecules. In many cases, using low laser power for excitation can minimize these effects.
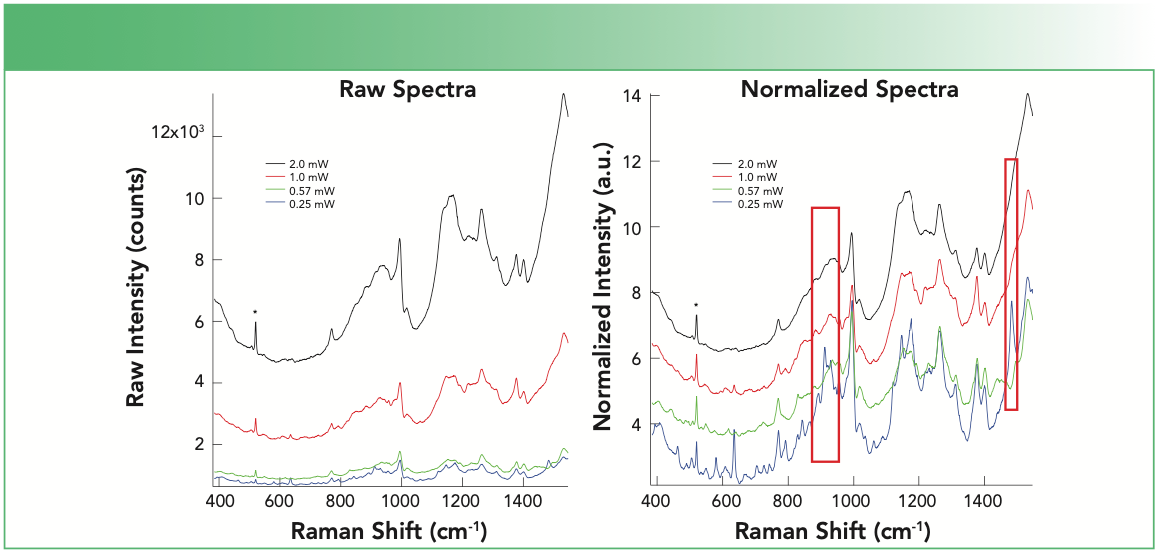
Figure 2 shows the spectra obtained from a protein deposited and dried on a commercial SERS substrate (Silmeco, Au SERStrate) at different laser excitation powers. The spectra recorded with increased laser power do show more signal intensity; however, much of the fine detail that is used for chemical analysis is lost at the higher powers. The distinct vibrational bands near 900 and 1500 cm-1 at low power are lost at higher laser power excitation. It is worth noting that the specifications provided by Silmeco recommend using <10 W/cm2, which corresponds to a power of ~0.1 μW in a diffraction limited laser spot. It can be difficult to observe signals at such low powers, but damage will be avoided. The spectra shown in Figure 2 were acquired with a 785 nm laser and a 0.5 NA microscope objective, which corresponds to an energy density ranging from 2.0 x 10⁴ to 1.6 x 10⁵ W/cm2. In the normalized spectra, the lowest power acquisition clearly shows bands that disappear with increased laser power. These lost bands may result from changes in conformation, thermal damage, or even chemical changes to the protein on the surface. Additionally, the lost features are particularly valuable when using SERS spectra from chemometric, or machine learning, models to decipher important properties of mixtures and complex samples.
FIGURE 2: The SERS spectra from a protein deposited onto the SERS substrate as a function of increasing laser power is shown. The observed signals recorded at each power are shown as different colors. (a) Raw spectral are shown, and (b) the SERS signals are normalized to the height of the spontaneous Raman silicon band at 520 cm-1 (designated by *) that arises from the substrate. The normalized spectra are offset for clarity. The red boxes highlight Raman bands that disappear at higher laser power.

To conclude, the examples provided illustrate how using the incorrect laser power can degrade, or in some cases destroy, your sample. Table I lists recommendations to help you make successful SERS measurements. Some factors that can help are acquiring spectra in an environment with higher heat dissipation, such as in water compared to in air. Other approaches that illuminate a larger number of spots, such as line focus or rapidly moving the beam around the surface, can help avoid sample damage. Overall, less power is often better when making SERS measurements.

References
(1) J. Langer, D. Jimenez de Aberasturi, J. Aizpurua, R.A. Alvarez-Puebla, B. Auguié, J.J. Baumberg, G.C. Bazan, S.E.J. Bell, A. Boisen, A.G. Brolo, J. Choo, D. Cialla-May, V. Deckert, L. Fabris, K. Faulds, F.J. García de Abajo, R. Goodacre, D. Graham, A.J. Haes, C.L. Haynes, C. Huck, T. Itoh, M. Käll, J. Kneipp, N.A. Kotov, H. Kuang, E.C. Le Ru, H.K. Lee, J-F. Li, X.Y. Ling, S. Maier, T. Mayerhoefer, M. Moskovits, K. Murakoshi, J-M. Nam, S. Nie, Y. Ozaki, I. Pastoriza-Santos, J. Perez-Juste, J. Popp, A. Pucci, S. Reich, B. Ren, G.C. Schatz, T. Shegai, S. Schlücker, T. Li-Lin, K.G. Thomas, Z-Q. Tian, R.P. Van Duyne, T. Vo-Dinh, Y. Wang, K.A. Willets, C. Xu, H. Xu, Y. Xu, Y.S. Yamamoto, B. Zhao, and L.M. Liz-Marzán, ACS Nano 14(1), 28–117 (2019).
(2) D.L. Jeanmaire and R.P. Van Duyne, J. Electroanal. Chem. Interf. Electrochem. 84(1), 1–20 (1977). DOI: https://doi.org/10.1016/S0022-0728(77)80224-6.
(3) M. Fleischmann, P.J. Hendra, and A.J. McQuillan, Chem Phys. Lett. 26(2), 163–166 (1974).
(4) R. Zhang, Y. Zhang, Z.C. Dong, S. Jiang, C. Zhang, L.G. Chen, L. Zhang, Y. Liao, J. Aizpurua, Y. Luo, J.L. Yang, and J.G. Hou, Nature 498(7452), 82–86 (2013).
(5) S.M. Nie and S.R. Emery, Science 275(5303), 1102–1106 (1997).
(6) K. Kneipp, Y. Wang, H. Kneipp, L.T. Perel- man, I. Itzkan, R.R. Dasari, and M.S. Feld, Phys. Rev. Lett. 78(9), 1667–1670 (1997). DOI: 10.1103/PhysRevLett.78.1667.
(7) J. Lee, K.T. Crampton, N. Tallarida, and V.A. Apkarian, Nature 568(7750), 78–82 (2019). DOI: 10.1038/s41586-019-1059-9.
(8) Y. Fang, N-H. Seong, and D.D. Dlott, Science 321(5887), 388–392 (2008).
(9) H. Petrova, J. Perez Juste, I. Pastoriza-Santos, G.V. Hartland, L.M. Liz-Marzán, and P. Mulvaney, Phys. Chem. Chem. Phys. 8(7), 814–821 (2006). DOI: 10.1039/B514644E.
(10) Z.C. Zeng, H. Wang, P. Johns, G.V. Hartland, and Z.D. Schultz, J. Phys. Chem. C. Nanomater Interf. 121(21), 11623–11631 (2017). DOI: 10.1021/acs.jpcc.7b01220.
(11) E. Cortés, L.V. Besteiro, A. Alabastri, A. Baldi, G. Tagliabue, A. Demetriadou, and P. Narang, ACS Nano 14(12), 16202–16219 (2020). DOI: 10.1021/acsnano.0c08773.
(12) J. Szczerbiński, L. Gyr, J. Kaeslin, and R. Zenobi, Nano Lett. 18(11), 6740–6749 (2018). DOI: 10.1021/acs.nanolett.8b02426.
(13) S. Sloan-Dennison, C.M. Zoltowski, P.Z. El-Khoury, and Z.D. Schultz, J. Phys. Chem. C. 124(17), 9548–9558 (2020). DOI: 10.1021/ acs.jpcc.0c01436.
Zachary D. Schultz is with the Department of Chemistry and Biochemistry at The Ohio State University. Direct correspondence to: schultz.133@osu.edu.●
AI-Powered SERS Spectroscopy Breakthrough Boosts Safety of Medicinal Food Products
April 16th 2025A new deep learning-enhanced spectroscopic platform—SERSome—developed by researchers in China and Finland, identifies medicinal and edible homologs (MEHs) with 98% accuracy. This innovation could revolutionize safety and quality control in the growing MEH market.
New Raman Spectroscopy Method Enhances Real-Time Monitoring Across Fermentation Processes
April 15th 2025Researchers at Delft University of Technology have developed a novel method using single compound spectra to enhance the transferability and accuracy of Raman spectroscopy models for real-time fermentation monitoring.
Nanometer-Scale Studies Using Tip Enhanced Raman Spectroscopy
February 8th 2013Volker Deckert, the winner of the 2013 Charles Mann Award, is advancing the use of tip enhanced Raman spectroscopy (TERS) to push the lateral resolution of vibrational spectroscopy well below the Abbe limit, to achieve single-molecule sensitivity. Because the tip can be moved with sub-nanometer precision, structural information with unmatched spatial resolution can be achieved without the need of specific labels.
