Raman Spectroscopy: A Key Technique in Investigating Carbon-Based Materials
A unique feature of carbon is its ability to exist in many different forms and exhibit a variety of properties. The versatile properties of carbon-based materials (hardness, stiffness, and electrical conductivity) makes carbon appealing across many applications, including carbon fibers, lubricants, and carbon black. The ability to identify specific carbon materials is thus imperative, especially for research and development purposes. Raman spectroscopy provides a quick, nondestructive method for identifying and characterizing different types of carbon with little to no sample preparation required. The instrumentation involves a laser, which causes inelastic Raman scattering of light to determine the vibrational modes of the molecules in the material. The result is a Raman spectrum exhibiting specific peaks—commonly referred to as the G and D bands for carbon materials. This article explains the key steps of using Raman technology to investigate carbon and carbon-based materials (such as carbon nanotubes, graphene, and carbon fibers and composites), as well as the process of analyzing the spectra. Specifically, the full width at half maximum (FWHM) of the G band and the dispersions of the G and D bands are analyzed and correlated with different carbon materials. Finally, the challenges of using Raman spectroscopy are discussed.
Raman spectroscopy is an analytical tool that uses scattered light to measure the vibrational modes of a sample. It was named after an Indian physicist (C.V. Raman) who observed the Raman scattering of light in 1928 (1). To conduct Raman spectroscopy, a source of light is required. The light, usually from a laser, can be within the visible, near-infrared (NIR), or near-ultraviolet (UV) wavelengths. The laser light interacts with the molecule, resulting in an energy shift of the laser photons, thereby giving information on the vibrational modes of the molecule.
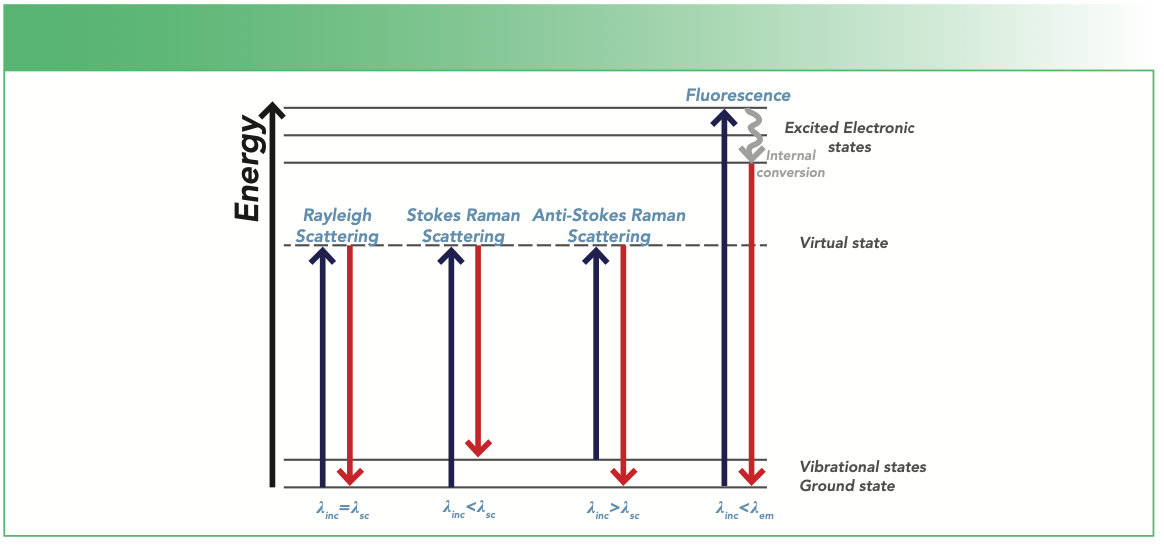
When light from the laser is incident on a sample, different interactions comprising of the scattering and emitting of light (referred to as fluorescence) may occur as illustrated in Figure 1. The terms λinc, λsc, and λem in Figure 1 refer to incident, scattered, and emission wavelengths, respectively. For scattering, three types of scattering can occur, and they are referred to as Rayleigh, Stokes Raman, or anti-Stokes Raman scattering depending on the amount of energy transfer between the photon and the molecule.
For anti-Stokes Raman scattering, some energy from the laser light is transferred to the molecule. In this case, the molecule attains a higher virtual energy state resulting in the scattered light (λsc) having less energy compared to the incident light (λin), as shown below in equation 1.

The higher virtual energy state of the molecule is unstable and short-lived, and is re-emitted immediately. One application of anti-Stokes Raman scattering is in imaging unmodified biological live cells. Other microscopic imaging techniques require the use of contrast agents to acquire an image, which may result in the modification or alteration of the cells.
In Rayleigh scattering, no energy transfer occurs between the photon and the molecule, resulting in the scattered light (λsc) having the same wavelength as the incident light (λinc), as demonstrated by equation 2.

This is also referred to as elastic scattering. Rayleigh scattering is strongly dependent on particle size as well as wavelength.
In Stokes Raman scattering, the molecule loses some of its energy (by relaxing to a lower vibrational state) to the incident light. In this case, the scattered light (λsc) gains energy resulting in higher energy than the incident light (λinc), as demonstrated in equation 3.

This shift in energy provides Raman spectra with specific features used to provide chemical and structural identification of substances through their unique Raman fingerprint.
Apart from the scattering of light, a phenomenon, known as fluorescence emission, involves the absorption of energy by the molecules. In Raman scattering, the molecules attain a virtual energy state; however, in fluorescence, the molecules attain a real energy state (excited electronic state). Fluorescence light is emitted when the molecule relaxes back to a lower energy state (Figure 1). This process depends strongly on the excitation energy of the laser. Fluorescence and Raman scattering may compete with each other, especially when the excitation laser energy is close to the electronic transition energy of the material under investigation. Fluorescence interference may occur from the material analyzed or from impurities in the sample. Higher energy laser sources, such as 514 nm or 633 nm visible laser wavelengths, produce stronger fluorescence background. On the other hand, wavelengths that are within near-infrared (NIR), such as 785 nm or 1064 nm, results in lower levels of or no fluorescence because their energy may not be sufficient enough to excite the molecules to a higher energy state (2).
FIGURE 1: Mechanism of light scattering processes, such as Rayleigh scattering, Stokes, anti-Stokes Raman scattering, and fluorescence relaxation. The symbols λinc, λsc, and λem correspond to the incident, scattered, and emission wavelengths, respectively.

This article first discusses the procedure of taking Raman spectra as well as tips and instrument considerations. Following this, a section on analyzing different carbon Raman spectra is presented and discussed. Under this section, an explanation of the key Raman features (including the D and G peaks and FWHM) and how they vary depending on the type of carbon is provided.
Instrumental Considerations
Modern Raman spectroscopy typically involves illuminating a sample with a laser and a filter to remove Rayleigh scattered light. In dispersive Raman, a diffraction grating disperses the signal onto a detector. In Fourier transform Raman, an interference pattern is generated to construct a Raman signal. The main issues that are encountered while running a Raman sample is fluorescence interference and thermal degradation. Fluorescence is an issue in Raman analysis because it is highly efficient and gives a signal many orders of magnitude greater than the Raman signal (3).
There are several basic instrumental considerations to make before collecting Raman spectra, which are discussed in detail below.
Laser Wavelength
Wavelengths of light used in Raman spectroscopy span from UV to NIR. The choice of laser is highly dependent on the likelihood of fluorescence or degradation of the sample. Longer wavelengths give weaker Raman signals but likely have little to no fluorescence. The longer wavelength excitation laser supplies less energy, which in turn means the resulting virtual state is lower and unlikely to overlap with the upper electronic state (4). A longer wavelength excitation laser eliminates fluorescence interferences but also decreases the efficiency of Raman scattering. The Raman efficiency is defined by equation (4) where λ is the excitation wavelength.

Using the UV Raman region with a wavelength below 400 nm can generate up to 100x stronger Raman scattering than visible light according to the efficacy equation. UV Raman can also eliminate background fluorescence. However, UV Raman is a complicated and expensive technique, which makes it likely to degrade a sample. For this reason, 532 nm and 780 nm lasers are most typically used to analyze carbon-based materials as they are efficient Raman scatterers less prone to fluorescence (5).
Background Correction
The main source of background interference in Raman is dark current (or thermal electrons). Dark current may be generated if a highly sensitive charge coupled device (CCD) detector is used. Fortunately, dark current can be significantly reduced if the detector is adequately cooled. Nonetheless, a background measurement should be performed prior to sample measurement. Some Raman instruments have automated background correction technology, which collects the background measurement during instrument downtime (6).
Photobleaching
Photobleaching is an excellent method to use to reduce fluorescence interferences. This method involves exposing the sample to the laser prior to measurement. This irradiation can induce photolytic decomposition, which breaks down fluorescent impurities and reduces background fluorescence (7).
Cosmic Rays
High-energy cosmic rays can cause random unavoidable spikes in Raman spectra. Algorithms have been developed to reject these spikes. Many Raman instruments have built-in cosmic ray rejection capabilities (8).
Aperture Considerations
The aperture determines how much signal is detected (otherwise known as spectral resolution). An aperture is typically a slit or pinhole, and the larger the aperture, the greater the signal. A smaller aperture would be required for higher resolution information. Larger apertures improve the signal but may also increase noise (9).
Exposure Scans and Exposure Times
In some instances, sufficient Raman spectra can be obtained in seconds. It is good practice to start off with the maximum exposure time before adjusting the number of exposure scans to improve spectral quality. However, this process will only reduce noise. Raman signal is primarily improved by laser power and aperture adjustments (9).
Laser Power
Raman scattering is proportional to the power of the laser (mW). However, it is advisable to begin scanning with lower laser power and increase the power gradually. Both fluorescence emission and thermal degradation of the sample are more likely to occur with increased laser power. Carbon-based materials are typically dark in color and absorb much energy from the laser. Care must be taken when interpreting the spectra of carbon-based materials as a high-energy Raman laser can actually induce the graphitization or other structural change in some samples (10–12).
Confocal Raman Microscopy
For measuring small details on samples in the order of micrometer and sub-micrometer scale (that is, defects of carbon nanotubes), confocal Raman microscopy may be required. Confocal Raman spectroscopy involves excitation laser focus in conjunction with Raman collection optics. Confocal Raman spectroscopy can also nondestructively probe depths of the sample without the need for cross sectioning. Any X, Y, or Z location can be probed, and the spatial resolution is maintained in the micrometer range. Care must be taken when focusing on certain areas of the sample to ensure that the area of interest is in focus and is representative of the sample. In addition, precise laser alignment (focal point and spectrograph match) followed by calibration (accuracy of Raman shift and Raman intensity) of the microscope is essential and should be performed regularly (10–12).
Analyzing Spectra
All carbon-based materials irrespective of whether they are amorphous or crystalline will exhibit characteristic first order peaks at approximately 1380 and 1580 cm-1 (see Figure 2), which are commonly referred to as the D and G bands, respectively. The G band is because of the stretching of a bond connecting two sp2 sites arranged in either aromatic rings or as olefinic chains; meanwhile, the D mode corresponds to a breathing vibration of sixfold aromatic rings (14).
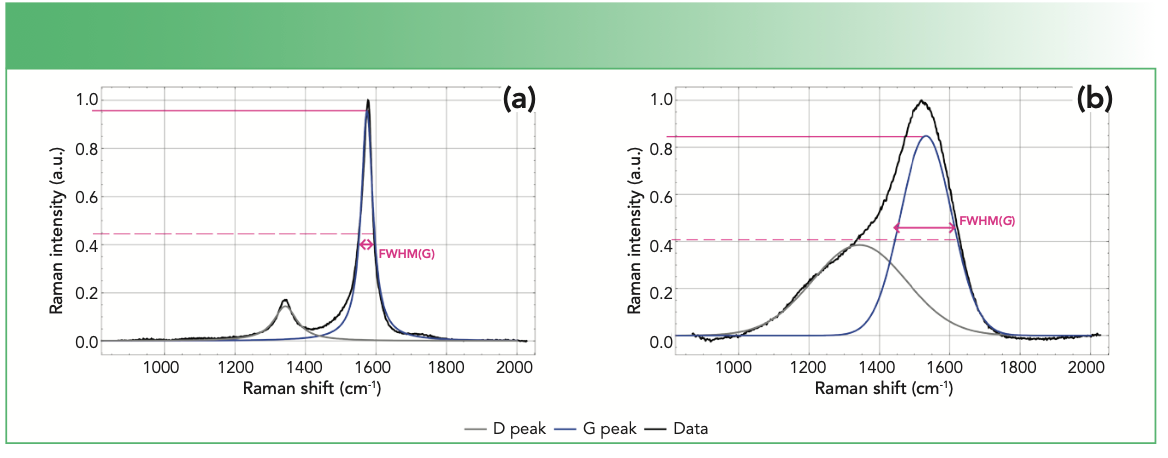
FIGURE 2: Fitted Raman spectra of (a) single-walled carbon nanotube, and (b) diamond-like carbon (DLC) coating identifying the G and D peaks and fwhm, using a 532 nm excitation laser.

Typically, the visible Raman spectra of the crystalline and amorphous carbons will display clearly resolved peaks and peak overlap, respectively. The positions, widths, and ratio of the intensities of the peaks can be indicative of sp3 content of materials, degree of disorder and crystallite size. Specifically, the parameters most extensively investigated are full width at half maximum (FWHM), dispersion, and position of the G band as denoted by FWHM(G), Disp(G), Pos(G), respectively as well as the ratio of the intensities of the D and G bands [I(D)/I(G)].
However, to obtain the values of these aforementioned parameters, the peaks need to be resolved and this is often achieved through curve fitting techniques. The two most commonly used models for the fitting of the two first order peaks are: (a) two Gaussians and (b) Lorentzian and Breit-Wigner-Fano (BWF). In the latter, Lorentzian and BWF curves model the D and G peaks, respectively. Gaussian and Lorentzian functions are symmetrical in shape whereas BWF exhibits asymmetry (13). Importantly, the choice of the model dictates the calculation of the I(D)/I(G) quantity; the two Gaussian model uses peak areas whereas the Lorentzian and BWF model requires the intensity heights (14). Displayed in Figure 2 are visible Raman spectra of a single-walled carbon nanotube and diamond-like carbon coatings which are fitted with the Lorentzian and BWF and two Gaussians models, respectively. The shapes of these spectra are characteristic of typical crystalline and amorphous carbon materials.
The FWHM(G) and Disp(G) both serve as indicators of the degree of disorder in amorphous carbon materials. FWHM(G) corresponds to the structural disorder, which refers to the distortion in the bond length and angles (14). Specifically, the FWHM(G) values are proportional to the disorder and thus materials with unstrained or defect free sp2 clusters will exhibit small FWHM(G) values. On the other hand, Disp(G) is related to the topological disorder, which involves the distribution of the size and shapes of the sp2 clusters (15). By its definition in equation 5, Disp(G) is the rate of change of Pos(G) with respect to excitation wavelength, λ, of the laser. Thus, Disp(G) can only be obtained using multiwavelength Raman techniques. Disp(G) exhibits nonuniqueness behavior and therefore, care must be taken when utilizing it for analysis.

As depicted in Figure 3, one can observe how the quantities Pos(G) and I(D)/I(G) when taken together, can provide approximations on the sp3 content of amorphous carbons (a-C) depending on which stage it occupies in the amorphization trajectory. Amorphous carbons (a-C) with high sp3 content are referred to as tetrahedral amorphous carbon (ta-C). Further, carbon-based materials exhibiting more graphite like structure (stage 1), have their (ID)/I(G) ratios inversely proportional to the grain size. Consequently, this quantity, (ID)/I(G), can be used to approximate the diameter of the clusters for more crystalline graphite like materials (15). This size difference is the salient distinguishing feature between graphite and nanocrystalline (NC) graphite where the latter exhibits the smaller crystallite size (16).
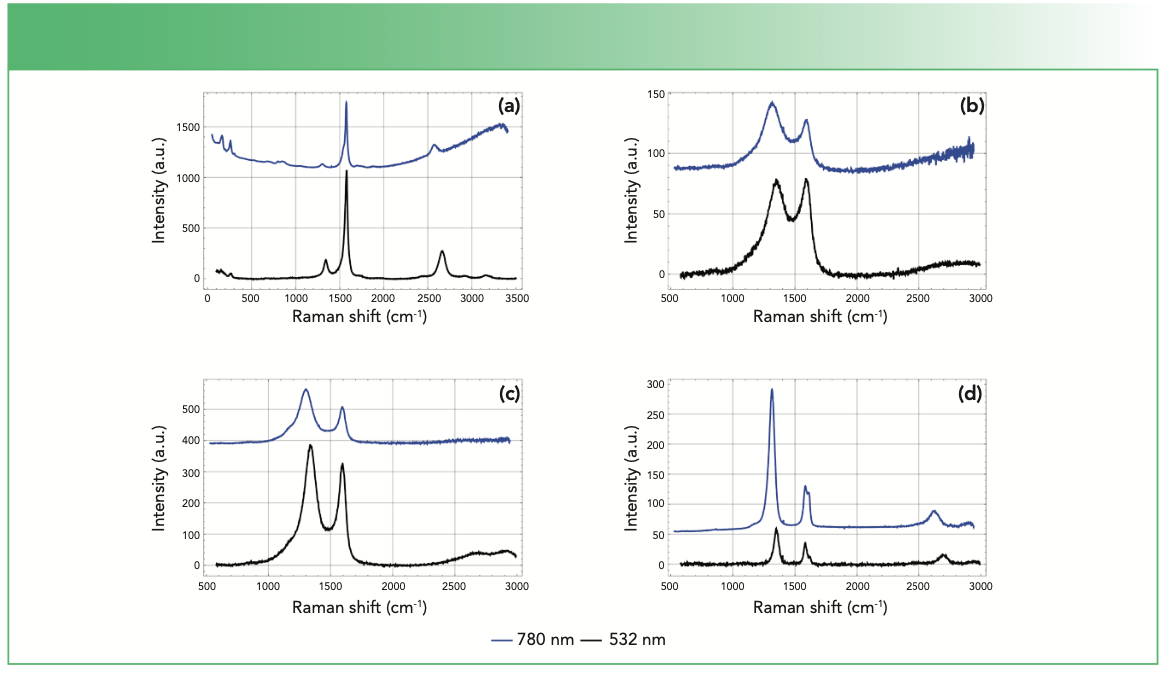
Finally, other peaks such as the 2D band (or second-order D band) provide a measurement of the layer thickness of graphite. Single-layer graphene has a single symmetric band but with more layers the band broadens (21). This peak shares a common feature with D in that it exhibits dispersive behavior as depicted in Figure 4. However, unlike the D peak, this band is not activated by disorder (22).
FIGURE 4: Raman spectra of a variety of carbon-based materials obtained using a DXR Raman confocal microscope (532 nm excitation shown in black and 780 nm excitation shown in blue). Material types include (a) single walled carbon nanotube, (b) carbon fiber, (c) activated carbon, and (d) vertical graphene.

Conclusion
The authors discuss Raman spectroscopy as a quick, nondestructive method of identifying different carbon materials. The other advantage of using Raman spectroscopy is that little sample preparation is required before taking measurements. The choice of the laser wavelength or type of Raman spectra is imperative to minimize fluorescence or sample damage. Crystalline carbon materials spectra have isolated peaks while amorphous carbon spectra will show overlapping peaks. The spectra for amorphous carbon will require peak deconvolution before the data can be analyzed. Parameters such as FWHM, the D and G peaks, and their dispersion provides useful information in identifying the different properties of the carbon material.
References
(1) C.V. Raman and K.S. Krishnan, Nature 121(3048), 501–502 (1928).
(2) E. Illy, A. Draksharapu, and W.R. Browne, in The Application Notebook, supplement to Spectroscopy, 16 (September 2014). https://www.spectroscopyonline.com/.
(3) N.Q. Dao, Dispersive Raman Spectroscopy, Current Instrumental Designs. In: Encyclopedia of Analytical Chemistry (John Wiley & Sons, West Sussex, United Kingdom, 2006).
(4) C. Krafft, Anal. Bioanal. Chem. 378(1), 60–62 (2004).
(5) R.R Jones, D.C. Hooper, L. Zhang, D. Wolverson, and V.K. Valev, Nanoscale Res. Lett. 14(1), 231 (2019).
(6) P.R. Griffiths and J.M. Chalmers, Handbook of Vibrational Spectroscopy (Wiley Online Library, Hoboken, New Jersey, 2002).
(7) Y. Wang, D.C. Alsmeyer, and R.L. McCreery, Chem. Mater. 2(5), 557–563 (1990).
(8) D. Roy, S. Kanojia, K. Mukhopadhyay, and N. Eswara Prasad, Bull. Mater. Sci. 44(1), 31 (2021).
(9) D. Wieboldt, in Raman Technology for Today’s Spectroscopists, supplement to Spectroscopy (June 2010). https://www.spectroscopyonline.com/view/understanding-raman-spectrometer-parameters
(10) L. Bokobza, J-L. Bruneel, and M. Couzi, Vib. Spectrosc. 74, 57–63 (2014).
(11) M. Osada and M. Kakihana, TANSO 228, 174–184 (2007).
(12) L. Bokobza, J-L Bruneel, and M. Couzi, Geophys. Space Phys. 1(1), 77–94 (2015).
(13) A. Merlen, J. Buijnsters, and C. Pardanaud, Coatings 7(10), 153 (2017).
(14) A.C. Ferrari and J. Robertson, Phys. Rev. B. Condens. Matter 61(20), 14095–14107 (2000).
(15) C. Casiraghi, A.C. Ferrari, and J. Robertson, Phys. Rev. B. Condens. Matter 72, 085401 (2005).
(16) F. Tuinstra and J.L. Koenig, J. Chem. Phys. 53(3), 1126–1130 (1970).
(17) A.S. Barnard and I.K. Snooki, Carbon 48(4), 981 (2010).
(18) K. Jurkiewicz, S. Duber, H.E. Fischer, and A.J. Burian, A. J. Appl. Crystallogr. 50(1), 36–48 (2017).
(19) V.L. Deringer, A.C. Miguel, R. Jana, A. Aarva, S.R. Elliott, T. Laurila, G. Csányi, and L. Pastewka, Chem. Mater. 30(21), 7438–7445 (2018).
(20) F.A.C. Ferrari and J. Robertson, Philos. Trans. R. Soc. A 362(1842), 2477–2512 (2004).
(21) A.C. Ferrari, Solid State Commun. 143(1–2), 47–57 (2007).
(22) L.M. Malard, M.A. Pimenta, G. Dresselhaus, and M.S. Dresselhaus, Phys. Rep. 473, 51–87 (2009).
Ashleigh Farnsworth, Gleny Chirima, and Fiona Yu are with the Maritime Division in the Defense Science and Technology Group, in Fishermans Bend, Australia. Direct correspondence to: Ash.Farnsworth@dst.defence.gov.au
AI-Powered SERS Spectroscopy Breakthrough Boosts Safety of Medicinal Food Products
April 16th 2025A new deep learning-enhanced spectroscopic platform—SERSome—developed by researchers in China and Finland, identifies medicinal and edible homologs (MEHs) with 98% accuracy. This innovation could revolutionize safety and quality control in the growing MEH market.
New Raman Spectroscopy Method Enhances Real-Time Monitoring Across Fermentation Processes
April 15th 2025Researchers at Delft University of Technology have developed a novel method using single compound spectra to enhance the transferability and accuracy of Raman spectroscopy models for real-time fermentation monitoring.
Nanometer-Scale Studies Using Tip Enhanced Raman Spectroscopy
February 8th 2013Volker Deckert, the winner of the 2013 Charles Mann Award, is advancing the use of tip enhanced Raman spectroscopy (TERS) to push the lateral resolution of vibrational spectroscopy well below the Abbe limit, to achieve single-molecule sensitivity. Because the tip can be moved with sub-nanometer precision, structural information with unmatched spatial resolution can be achieved without the need of specific labels.
