Publication
Article
Spectroscopy Supplements
Online ATR-FT-IR for Real-Time Monitoring of the Aspirin Esterification Process in an Acid-Mediated Reaction
The process of aspirin synthesis was studied using in situ real-time attenuated total reflection Fourier transform infrared spectroscopy (ATR-FT-IR) from salicylic acid and acetic anhydride accompanied by a sulfuric acid catalyst. The data collected from the IR analysis process showed that there were obvious changes in the position, shape, and intensity of the carbonyl characteristic peaks in the three-dimensional (3D) spectra. Principal component analysis (PCA) followed by target transformation of the resulting factors was used to analyze the spectra and the relationship of the absorbance and time trendlines of raw materials and products in the reaction system. This method would be enough to monitor reaction progress and determine the end point without further separation and purification of the reaction mixture. The results demonstrated that the acetylation of salicylic acid catalyzed by sulfuric acid was a complicated process, and the conversion rate was high. The reaction was a rapid reaction mechanism and could be divided into two stages with different reaction rate. The ATR-FT-IR spectroscopy technique can monitor and analyze the changes of raw materials and products with time, which is more reliable to determine fundamental data for process analysis and optimization using real-time monitoring of the reaction process.
Recently, with the development of modern laser technology, electronics, and computer technology, especially the application of optical fiber and optoelectronic couplers, in situ technology has been widely used in the real-time detection of various processes. The online infrared (IR) process analysis technology can take advantage of the mid-IR spectrum with abundant information to accurately monitor the concentration changes of the important components that affect the purity and process safety. It provides a means to study the whole chemical reaction process and contributes to the real-time understanding of the starting point, end point, and reaction process of the reaction. A Fourier transform IR (FT-IR) system is one of the most important tools in chemical engineering, biological medicine, and other research fields. The system is mainly used for chemical composition analysis and formulation development of various chemical products. Based on the real-time monitoring reaction process in three-dimensional (3D) data collection and processing ability, a FT-IR Fourier system can offer more reaction processing information to researchers and more intermediate products can be caught in the reaction. The system can be easily applied because it can be connected to many types of reactors.
Aspirin is one of the most fascinating and versatile drugs known to medicine, and it is found in more than 100 common medications, including Alka-Seltzer, Excedrin, and Vanquish. Aspirin has anti-pyretic analgesic, anti-inflammatory, and anti-rheumatism effects, resulting in its extensive application in the prevention and treatment of artery infarction, inhibition platelet aggregation, and cardiovascular disease. In recent years, scientists discovered that aspirin is also effective in preventing and treating major diseases such as neurodegenerative diseases and cancer. If the reaction time is too long or the temperature is too high in the catalytic synthesis process of aspirin, there will not only be side reactions, but acetyl groups in the product structure would be removed as well, both affecting the yield of aspirin. Thus, the researchers are looking for an appropriate analysis and measurement method to determine the reaction end point accurately. The determination of the salicylic acid concentration is also used to monitor the progress of aspirin synthesis in the reaction system. However, in traditional analytical methods, such as titration ultraviolet (UV) absorption and high performance liquid chromatography (HPLC), there was the problem of long analytical times and complicated procedures (1–4). Raman spectroscopy could realize aspirin routine monitoring (5), but fluorescence sometimes interfered with FT Raman spectrum analysis. Nondestructive determination of the drug content and the properties of aspirin mixture were tested by near-IR (NIR) spectroscopy (6). Attenuated total reflection FT-IR (ATR-FT-IR) spectroscopy was used to obtain the vibration structure, functional group composition, and variation characteristic information of the relevant molecules on the surface of the sample according to the reflected signal of the sample surface. As one of the important experimental methods of IR spectroscopy, ATR-FT-IR overcame the shortcomings of the traditional transmission method, simplified the process of sample making and processing, and greatly expanded the application range of IR spectroscopy (7). ATR-FT-IR is a fast, nondestructive, and relatively cheap technique that may be able to allow direct measurements of components in mixtures. It has become a powerful tool and means to analyze the surface structure of materials and has been widely used in many fields (8).
Here, in situ real-time ATR-FT-IR was applied to monitor the synthesis of aspirin, which can be used to measure reaction trends and profiles in real-time. To our knowledge, this study is the first of its kind in investigating the sulfuric acid catalyzed synthesis of aspirin by using in situ real-time ATR-FT-IR spectroscopy. In a complex reaction system, the changes of raw materials and products over time can be monitored and analyzed. Moreover, reaction progress can be monitored and the reaction endpoint of synthesis of aspirin can be accurately determined without sampling. A novel technique using in situ ATR-FT-IR spectroscopy to monitor a multi-component complex reaction system was developed. This study provided important information for researchers on how to optimize chemical processes, to improve the yield of aspirin production, to reduce the side reaction, and to control aspirin production quality.
Experimental Section
Materials
Acetic anhydride, acetic acid, and sulfuric acid were purchased from Beijing Chemical Works (China). Salicylic acid and o-acetylsalicylic acid (aspirin) were obtained from Shanghai Maikelin Biochemical Technology Co, Ltd. (China). All chemical reagents were of an analytical grade and were used as supplied.
FT-IR Spectra of Pure Chemical Reagents
The FT-IR spectra of pure chemical reagents were recorded through a FT-IR (Thermo Nicolet, Avatar 330 FT-IR spectrometer) instrument in the wavenumber range of 4000–400 cm-1. The solid samples were mixed with dry potassium bromide (KBr) at a 1:100 ratio, and the liquid samples dispensed 2–3 drops on the KBr wafers. All spectra were recorded by accumulating 32 scans with a spectral resolution of 4 cm-1, and the FT-IR spectral baseline was corrected according to the Thermo Nicolet software in this study.
Instrumentation
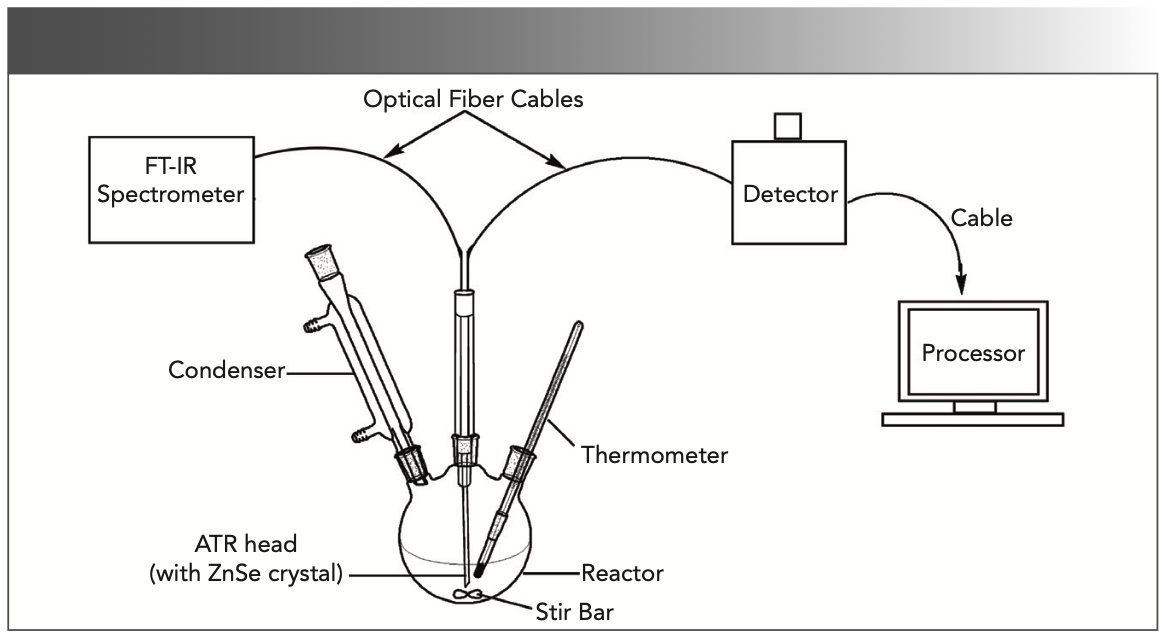
The general experimental procedure for in situ mid-IR spectroscopy (Vector 22, Bruker Analytic GmbH) with a RemSpec ReactionView system (Remspec Corp.) was applied. A 50 mL 3-necked flask was set up with a magnetic stirrer. A FT-IR reaction monitoring system was fitted with a high-temperature ATR head positioned in one of the entry ports into the reactor. A background spectrum was collected for 1 min in an air environment. The mid-IR spectra were obtained using a Remspec fiber-optic probe fitted with a zinc selenide ATR crystal. The probe was attached to a mid-IR spectrometer controlled by a desktop computer running Online Publikationsverbund der Universität Stuttgart (OPUS) software. The schematic diagram of the experimental equipment is shown in Figure 1. The in situ FT-IR reaction monitoring system and software were obtained from Remspec Corporation.
FIGURE 1: A real-time monitoring experimental device using ATR-FT-IR spectroscopy.
Synthesis of Aspirin and Data Collection
The synthesis of aspirin was performed according to the process described in the literature (9). Acetic anhydride (10 mL, 0.106 mol) was added to the 50 mL flask, immersing the end of the ATR head. The mid-IR spectrum was recorded at a resolution of 4 cm-1 for a scan time of 30 s. Data collection by the ReactionView was initiated at a rate of one spectrum every 1 min. Salicylic acid (4 g, 0.028 mol) was then added, followed by concentrated sulfuric acid (five drops) as the catalyst. In this reaction, acetic anhydride was both the solvent and the reagent. The mixture was thoroughly stirred with a magnetic stirrer and heated on a hot plate. The reaction was carried out at 35 °C. Once data collection was complete, the complete set of spectra could be analyzed further.
Results and Discussion
FT-IR Spectral Characteristics of the Initial Reactant and Final Product
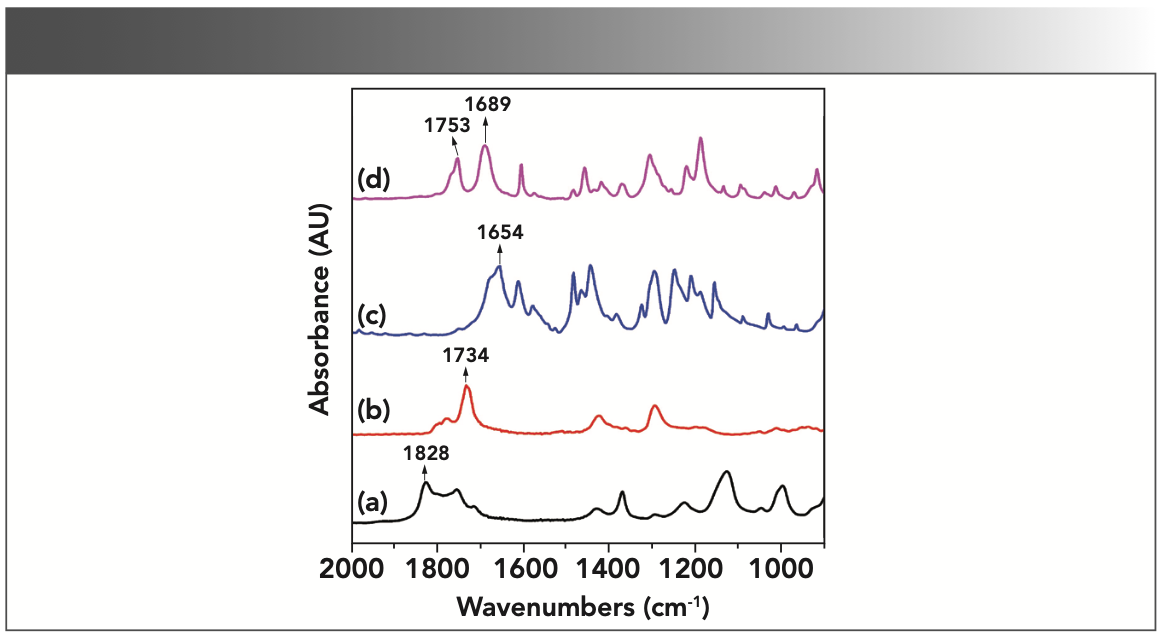
To identify characteristic absorbance peaks of each component, especially reaction products, the single component FT-IR spectra of reactants and product were recorded in the spectra of the reaction mixture using KBr wafers. The measured spectra of acetic anhydride, acetic acid, salicylic acid and aspirin are plotted in Figure 2 in the ranges of 2000–900 cm-1. The IR spectra demonstrate the characteristic bands of carbonyl (C=O bond) stretches between 1830 and 1600 cm-1, which are present at different wavenumbers. Peaks of spectra in the region of 1828–1730 cm-1, 1654 cm-1, 1734 cm-1, and 1753–1689 cm-1 at lines (a), (b), (c), and (d) represent the stretching vibrations of the carbonyl group in acetic anhydride, salicylic acid, acetic acid, and aspirin, respectively. The positions of these peaks are consistent with the characteristic ranges of the organic carbonyl groups reported in the literature (10). The two aspirin bands at 1753 and 1689 cm-1 correspond to the ester and carboxyl group, respectively. The IR spectra of salicylic acid and aspirin demonstrate that, in addition to stretching vibrations of C=O bonds, the band at 1608 cm-1 is attributed to the vibration of the backbone of the benzene ring and the wide multiple bands are in the range of 1600–1250 cm-1. When these four substances are mixed together, the IR spectrum measured is a spectrum of the mixed system, meaning that the spectra are superimposed over each other.
FIGURE 2: Untreated pure component IR spectra of raw materials and products in the synthesis of aspirin: (a) acetic anhydride, (b) acetic acid, (c) salicylic acid, and (d) acetylsalicylic acid.
Monitoring Reaction Process by ReactionView in Situ Mid-IR Spectroscopy
To gain further insight into the reactivity of this reaction system and to confirm the reaction products of the acylation of salicylic acid, a series of spectroscopic studies were undertaken to detect the reaction. In situ IR monitoring results (as shown in Figure 3) showed that the reaction was fast when the catalyst was added, and several distinct reaction changes were visible. After the addition of the catalyst, immediate signs of the reaction were observed. The solid salicylic acid dissolved and effervescence was noticed in the reactor. Data were collected for 40 min and saved in the form of a multi-file. The first spectrum collected was pure acetic anhydride, a reactant that also served as the solvent for the reaction. Little change of the first spectrum was observed when the salicylic acid was added. The reason was that the salicylic acid dissolved only sparingly in the acetic anhydride and the ATR probe collected data only from the liquid phase.
FIGURE 3: In situ 3D IR spectra of aspirin synthesis reaction. The addition of sulfuric acid position is marked by a red arrow (A) in the reaction.
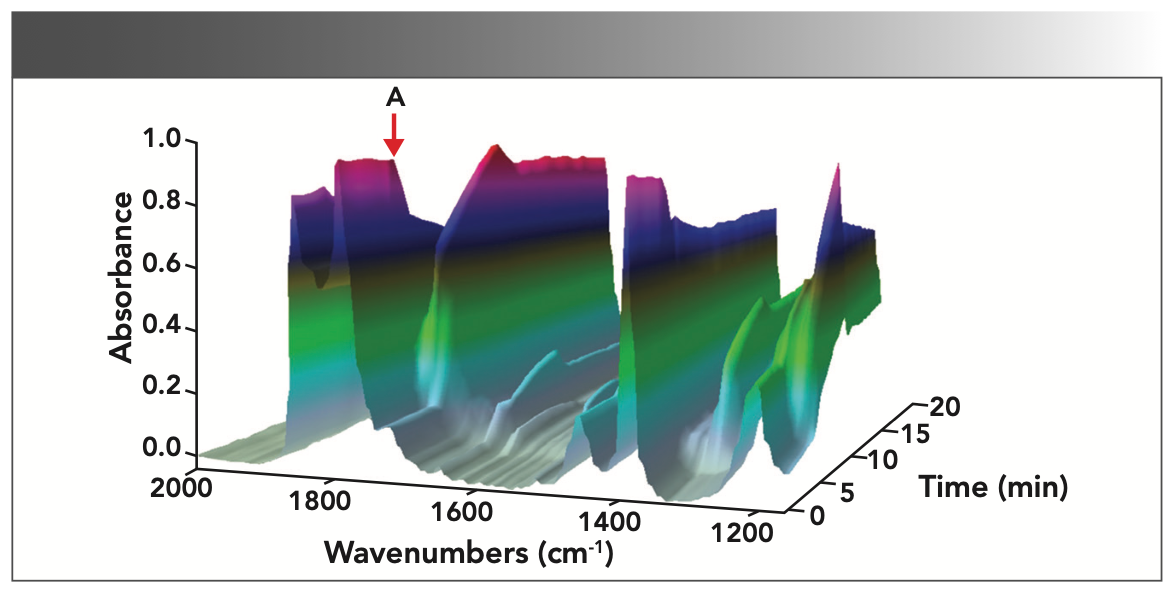
As shown in Figure 3, a 3D plot of aspirin synthesis can be obtained during the reaction monitoring for 40 min, which gives an overview of the trends in the data. The peak region below 2000 cm-1 can provide some detailed spectroscopic information about products and intermediates. The changes of peak values in the 3D plot clearly exhibit the decrease of raw material and the increase of the product as the reaction progresses. As acetic anhydride acts as both a reactant and as the solvent for the reaction, the disappearance of the acetic anhydride peak is not possible, which results in a decreasing trend. The 3D plot demonstrates the component changes for monitoring the reaction progress successfully.
Identifying Components of Reaction System
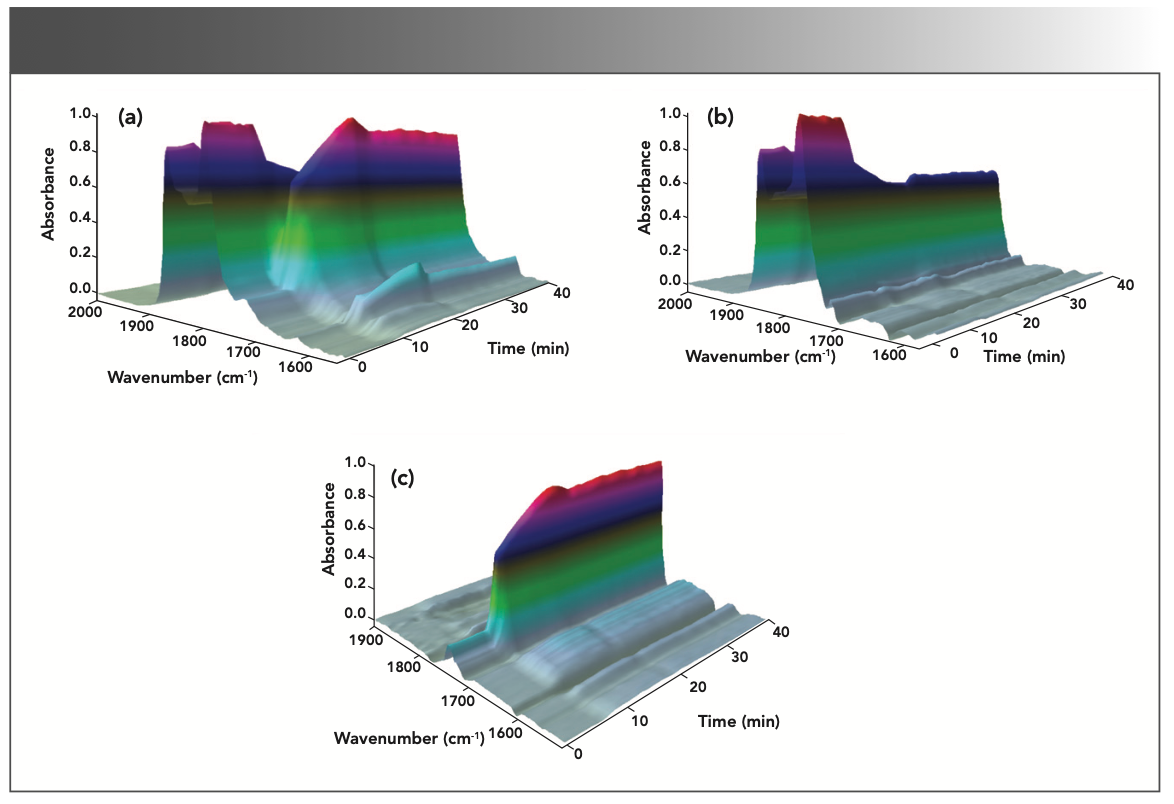
Because of the overlap absorbance bands of acetic anhydride, acetic acid, salicylic acid, and aspirin in the carbonyl region from 1875 to 1660 cm-1, it is difficult to identify characteristic absorbance peaks for each component. The complete set of spectra can be analyzed further using the ReactionSleuth software package, which is a toolbox for analyzing spectroscopic reaction data to examine the data of 3D plot and calculate the absorbance and time trendlines. It can also be used to calculate “synthetic spectra” using a method based on principal component analysis (PCA) followed by target transformation of the resulting factors (11). In many cases, these synthetic spectra can be compared with the pure compound spectra, or with spectral libraries, to confirm the identity of the reaction products and byproducts. The results of the analysis of the IR spectra demonstrate that the method can resolve highly overlapping mixture spectra, producing a spectra equivalent to the original components. Because of the complex reaction environment in situ real-time, the IR spectra of each substance are a little different from that of the potassium bromide wafers of the standard sample. The spectra are strongly overlapped in multiple component mixtures. The 3D plots of one component and two components (reactant acetic anhydride and product acetic acid) can be obtained from total 3D plots by using PCA, which are shown in the Figures 4a–c, clearly demonstrating the change trend of absorbance and time in the reaction process.
FIGURE 4: The 3D plots of principal components extracted from in situ IR monitoring data sets: (a) acetic anhydride and acetic acid, (b) acetic anhydride, and (c) acetic acid.
Analysis of Reaction Process
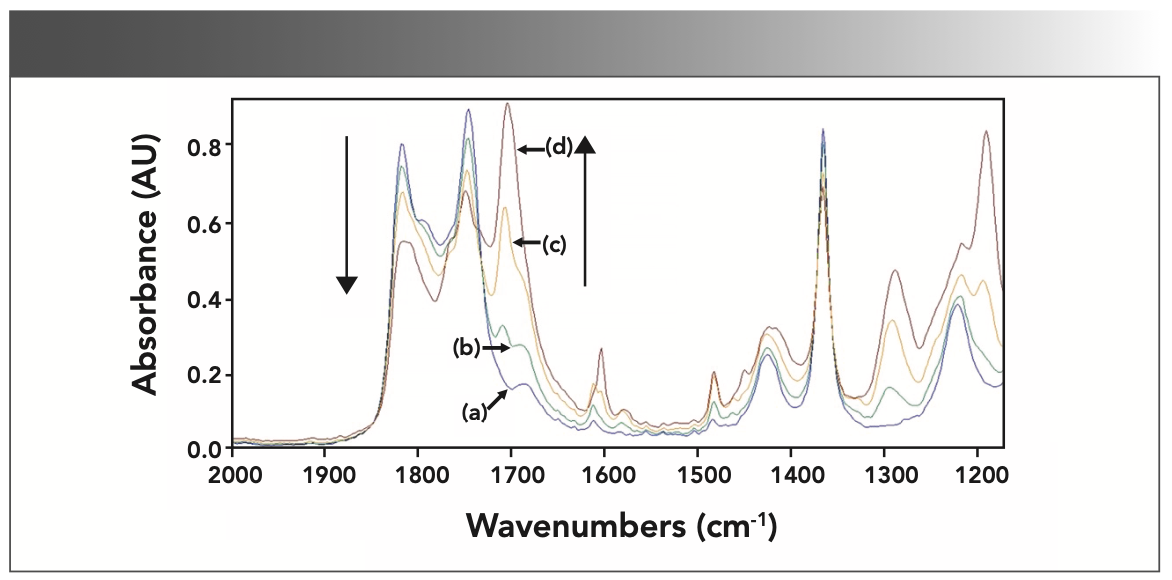
The IR spectra in the region of 1900–1150 cm-1 at 1, 7.9, 10, and 40 min monitored from the reactor are shown in Figure 5. The absorbance changes in peak height are demonstrated as line a, b, c, and d. When the selected spectra from the data set are overlaid, the changes over time in the spectra are obvious. However, because of the strongly overlapping nature of the spectra, a simple peak analysis is difficult. As expected, the characteristic peaks C=O of acetic anhydride (for example, at 1818 and 1749 cm-1, with the spectrum shown in line a) diminish, and a peak associated with the product, acetic acid emerges (1706 cm-1), with the spectrum shown in line d). The peak at 1706 cm-1 on the product spectrum, is assigned to the carbonyl stretching vibration of acetic acid. Therefore, this functional group is different from that of the reactant molecule. Consequently, the absorbance at peaks 1706 cm-1 is used as the measurement parameter for the product concentration. The absorbance of the acetic acid carbonyl peak 1706 cm-1 in the liquid state increases gradually with the reaction time prolonging, which indicates that the concentration of acetic acid increases.
FIGURE 5: IR spectra of aspirin synthesis reaction from 2000–1150 cm-1 at times (a) 1, (b) 7.5, (c) 10, and (d) 40 min. Two arrows show the disappearance (down) and emergence (up) of prominent features, respectively.
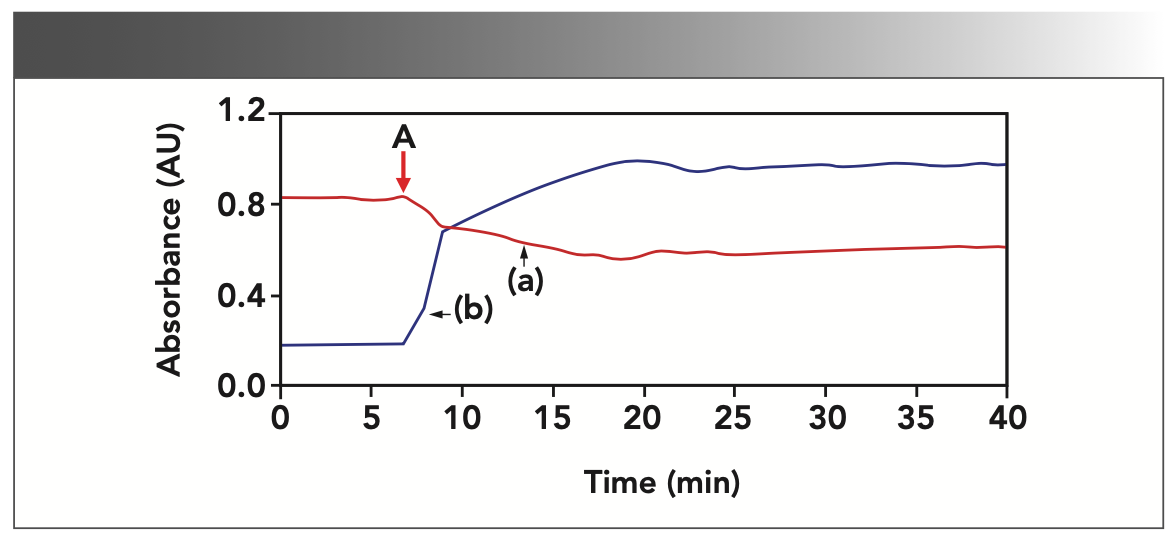
Two absorbance and time trendlines (Figure 6) calculated at the peaks 1818 and 1706 cm-1 clearly show the onset of changes when the catalyst was added 7 min after the data collection started. The decreased peak value of acetic anhydride (1818 and 1749 cm-1) and the increased peak value of acetic acid (1706 cm-1) are observed simultaneously, consistent with the carbonyl group change values reported in the literature (9). The asymmetrical stretching vibration peaks (C=O, acetic acid) reach their maximum value within 12 min, clearly demonstrating that the reaction was essentially complete and showed the rapid conversion of salicylic acid to aspirin.
FIGURE 6: Absorbance vs. time trendlines calculated at (line a) peak 1818 cm-1 and (line b) peak 1706 cm-1. The addition of sulfuric acid position is marked by a red arrow A at 7 min after the data collection started.
To analyze the changes of main component in the reaction system with time in detail, the real-time monitoring 3D spectrum during the reaction was processed by the ReactionSleuth package. The spectra scores of acetic anhydride and acetic acid with their time-based trendlines were obtained, as shown in Figure 7, which showed the concentration changes of the components when the acylation reaction had been monitoring for 40 min. The higher the score, the higher the concentration of the substance. The trendline of acetic anhydride exhibits more complex behavior over time in Figure 7(a). With the addition of the catalyst, the line drops sharply (A→B), then slowly drops to its lowest point (B→C), and then rises slightly (C→D) to balance. This trend shows the change in the concentration of acetic anhydride during the reaction. The concentration of acetic anhydride in the liquid phase will increase slightly (C→D) because of the precipitation and crystallization of aspirin. The trendline of acetic acid shows a trend opposite to that of acetic anhydride (in Figure 7b), and the whole change trend is the same as that of the peak at 1706 cm-1.
FIGURE 7: The spectra scores of (a) acetic anhydride and (b) acetic acid with their time-based trend lines. A to D show trendline changes.
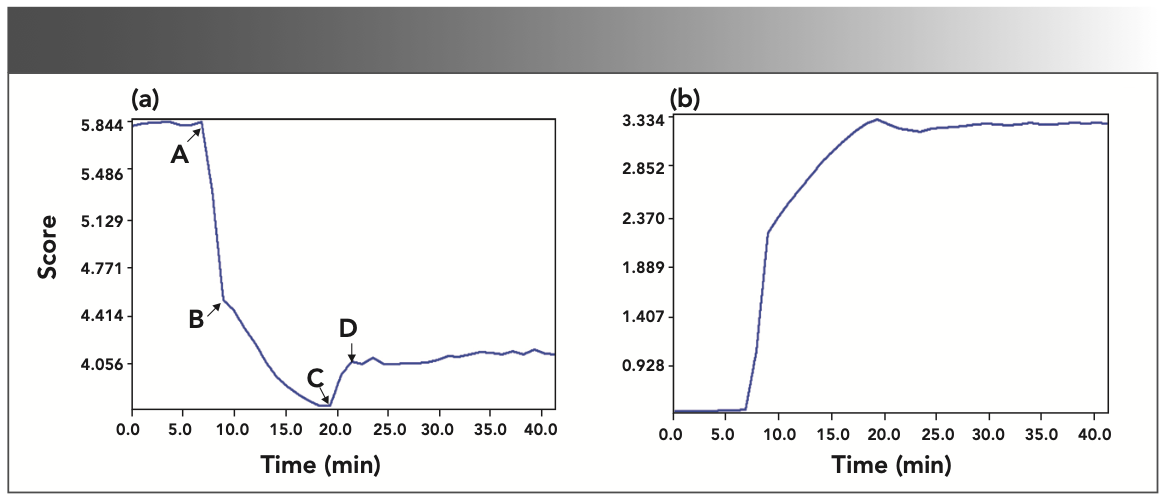
From Figure 7, there can be seen aspirin synthesis reaction with two different reaction rates. Approximately 2 min after the catalyst is added, the acetic anhydride concentration decreases sharply in the first stage. This first step of the reaction involves the phenolic hydroxyl group of the salicylic acid attacking one of the electrophilic carbons of the acetic anhydride to form an intermediate, which shows a quick process. But the rate in the next stage becomes slow. This process includes that the intermediate eliminates a hydrogen proton, and quickly converts to aspirin, generating an equivalent number of acetic acid. It can be clearly seen from the plots that the reaction finishes within 12 min, which is rather quickly. It is clear that the overall progress of the aspirin reaction can be monitored by the FT-IR spectroscopy, which is mainly utilized to monitor the presence or disappearance of the different carbonyl groups during the synthesis.
Conclusion
In this paper, the reaction of synthesize aspirin catalyzed by sulfuric acid was monitored by using in situ real-time FT-IR spectroscopy. By the study of experimental conditions and the optimization of the model, the absorption spectra of aspirin reaction system were well resolved. The variation data of the absorbance and time trendlines of carbonyl stretching peaks and the concentration changes of the components could be analyzed, which would be enough to monitor reaction progress and accurately determine the reaction endpoint of synthetic aspirin without treating the samples. This study demonstrated that the acetylation reaction rate of salicylic acid catalyzed by sulfuric acid is a rapid reaction mechanism and the conversion rate is high. The whole reaction process can be divided into two stages, where the first is faster and the second is slower. At the end of the reaction, a large number of aspirin products can be crystallized based on observation. The application of a real-time technique based on ATR-FT-IR spectroscopy can be helpful not only in monitoring the synthesis process of aspirin, but also in optimizing the process and reaction conditions, where it is no longer necessary to rely on samples grabbed from the reactor.
Data Availability
The data used to support the findings of this study are included within the article.
Conflicts of Interest
No conflict of interest exits in the submission of this manuscript, and manuscript is approved by all authors for publication. All the authors listed have approved the manuscript that is enclosed.
Acknowledgments
The authors are grateful to Yuanhua Sun and Yuanwang Tang for the analytical measurements.
References
(1) S.L. Lin, J. Pharm. Sci. 56, 1130–1140 (1967). DOI: 10.1002/jps.2600560918.
(2) M.M. Sena, and R.J. Poppi, J. Pharm. Biomed. Anal. 34, 27–34 (2004). DOI: 10.1016/j.japna.2003.08.011.
(3) M.M. Abdelrahman, Spectrochim. Acta Part A. Mol. Biomol. Spectrosc. 124, 389–396 (2014). DOI: 10.1016/j.saa.2014.01.020.
(4) K. Darwish, I. Salama, S. Mostafa, and M. El-Sadek, Chem. Pharm. Bull. 60, 1426– 1436 (2012). DOI: 10.1248/cpb.c12-00596.
(5) S. Neuberger, K. Jooß, D. Flottmann, G. Scriba, and C. Neusüß, J. Pharm. Biomed. Anal. 134, 122–129 (2017). DOI: 10.1016/j.jpba.2016.11.020.
(6) E. Otsuka, H. Abe, M. Aburada, and M. Otsuka, Drug Dev. Ind. Pharm. 36, 839–844 (2010). DOI: 10.3109/03639040903532053.
(7) R. Kurrey, M. Mahilang, M.K. Deb, J. Nirmalkar, K. Shrivas, S. Pervez, M.K. Rai, and J. Rai, Food Chem. 270, 459–466 (2019). DOI: 10.1016/j.foodchem.2018.07.129.
(8) A. Krüger, K. A. Bürkle, A. Hauser Mangerich, Nat. Commun. 11, 2174–2189 (2020). DOI: 10.1038/s41467-020-15858-w.
(9) H.Y. Chen and L.X. Ding, Organic Chemistry Experiments (China Agricultural Press, Beijing, China, 2017).
(10) X.E. Zhen, M. Zong, S.N. Gao, Y.G. Cao, L. Jiang, S.X. Chen, et al, Plos One 9, 98513–985122 (2014). DOI: 10.1371/journal.pone.0098513.
(11) X.H. Liang, J.E. Andrews, and J.A. De haseth, Anal. Chem. 68, 378–385 (1996). DOI: 10.1021/ac950870c.
Hongyan Chen is with the College of Science, at Beijing Forestry University, in Beijing, China, as well as with the Beijing Key Laboratory of Forest Food Processing and Safety at Beijing Forestry University, in Beijing, China. Hongda Yang is with the Beijing Key Laboratory of Wood Science and Engineering at Beijing Forestry University, in Beijing, China. Direct correspondence to: chenhongyan@bjfu.edu.cn ●

Newsletter
Get essential updates on the latest spectroscopy technologies, regulatory standards, and best practices—subscribe today to Spectroscopy.


