Publication
Article
Spectroscopy Supplements
Specific Recognition Technology of Infrared Absorption Spectra Based on Continuous Wavelet Decomposition
Author(s):
Because infrared (IR) absorption spectroscopy technology can offer high sensitivity and strong anti-interference capabilities, it is widely used in gas detection. To solve the problem of spectrum line aliasing in gas detection, this study examined the application of IR absorption spectroscopy technology based on time-frequency analysis in component identification. The second derivative spectrum of the IR absorption spectroscopy was processed by continuous wavelet transform to obtain the time-frequency characteristic matrix. The appropriate scale range was selected through the variance of wavelet coefficients. The correlation analysis of time and frequency on the time-frequency characteristic matrix was used for component identification. The experimental results showed that the correlation analysis of the time dimension can extract the characteristic absorption position of the gas to be measured in the gas mixture. The frequency correlation analysis at the characteristic absorption position can improve the recognition accuracy compared with the frequency correlation analysis in the entire spectral interval. The research in this article provides new ideas for the quantitative detection of gases.
Infrared (IR) absorption spectroscopy technology is an analysis method that has developed rapidly in recent years. Because of the advantages of noncontact, fast response, and high accuracy, especially in chemical composition analysis and gas mixture identification, it is widely used. Currently, the quantitative detection methods of IR absorption spectroscopy include techniques such as surface-enhanced IR absorption (SEIRA) spectroscopy (1,2), Fourier transform IR (FT-IR) spectroscopy (3), and cavity ring-down spectroscopy (CRDS) (4). The most commonly used pretreatment method in spectral quantitative analysis is derivative spectroscopy. Derivative spectroscopy can not only distinguish aliasing peaks to a certain extent, but it can also eliminate the influence of baseline drift. Therefore, it can improve the resolution of the spectrum. The second derivative spectrum can remove some of the high-frequency noise and mutual interference between components (5). This study applied the second derivative spectrum to qualitative analysis.
Many scientific research teams have done a lot of feasibility studies in the identification of spectral components and have achieved important results. Wang and others (6) studied the simulation and analysis of the second harmonic signal in tunable diode laser absorption spectroscopy (TDLAS) technology to provide a reference for subsequent gas detection experiments. Zhu and others (7) proposed a sparse non-negative least squares (SNNLS) algorithm for the qualitative analysis of mixtures in Raman spectroscopy. When the characteristic peaks of the components in the mixture are few and the concentration is low, or when the mixture constructed by different components has similar Raman spectral characteristics, there is a problem that the component characteristics are difficult to fully mine and the performance is reduced. Li and others (8) proposed to use continuous wavelet transform to improve the resolution of peaks, which inputted the initial parameters into the curve fitting to get a better fitting effect. Therefore, the accuracy of gas mixture component identification is improved by analyzing IR absorption spectroscopy.
The IR absorption spectrum reflects the relationship between the wavenumber and absorbance. On the microscopic level, the molecular absorption spectrum is reflected in the transition of the molecule from a lower energy level to a higher energy level. On the macroscopic level, the intensity of the transmitted light becomes weaker. From the perspective of signal analysis, the signal can be analyzed in the time dimension and frequency dimension to express various spectral information (9).
The signal is analyzed in time dimension and frequency dimension through continuous wavelet transform. Although Fourier transform has become the most common tool in signal processing, it cannot determine the specific moment when a certain frequency component occurs. Short-time Fourier transform (STFT) (10) can determine the frequency of the time interval through a windowing method and obtain the time-frequency characteristics of the signal. Because the time window of this method is fixed, it is difficult to obtain better frequency and time resolution for some signals with faster frequency changes. Wavelet transform has developed rapidly because of its multi-resolution characteristics.
To solve the problem of spectral aliasing and establish a more accurate component identification method, this study examined IR absorption spectroscopy technology. The time-frequency characteristic matrix was obtained by performing continuous wavelet transform on the second derivative spectrum of the IR absorption spectrum. The time-frequency characteristic matrix was analyzed with the variance of wavelet coefficients to obtain a suitable scale range. The characteristic absorption position of the gas to be measured in the gas mixture was obtained through correlation analysis of the time-frequency characteristic matrices in the time dimension. The correlation analysis of the frequency dimension was performed at the characteristic absorption position, which improved the identification accuracy. The simulation process analyzes the component identification method based on the morphological characteristics of the derivative spectrum. Finally, the gas detection experiment was carried out, which verified the effectiveness of IR absorption spectroscopy technology for the component identification method of the gas mixture.
Basic Principles
Lambert-Beer Law
When a beam of monochromatic light with frequency ν passes through a gas medium with light path L, the gas molecules absorbs part of the light energy. The transmitted intensity I(ν) and the incident light intensity I0(ν) satisfy the Lambert-Beer law (11):

where α (cm-1) is the absorption coefficient (12); C (mol·cm-3) is the concentration of the gas to be measured; and L (cm) is the optical path length of the sample cell.
The absorption coefficient (α) can be expressed by the following formula:

where P (atm) is the pressure of the gas to be measured; Xg is the mole fraction of gas in the sample; and Si (cm-2/atm) is the linear intensity of the spectrum, which is only related to temperature. Φi(ν) (cm) is the linear function; it represents the shape of the absorption spectrum of the gas to be measured (13–15), which is related to the temperature, pressure, type, and content of each component of the gas to be measured.
Wavelet Transform
As a signal time-frequency analysis method, the wavelet transform breaks through the defect that Fourier analysis does not have any resolution in the time domain. Wavelet transform has good localization properties in both time and frequency domains, and it can analyze the signal in the specified frequency range and periods at any scale, so it can focus on any details of the object (16).
Wavelet transform includes continuous wavelet transform and discrete wavelet transform. Continuous wavelet transform has the characteristic of multi-resolution analysis, which can analyze wavelength and spatial frequency at the same time. Therefore, continuous wavelet transform is used in the time-frequency analysis of non-stationary signals.
Spectral Component Identification Research
In spectral line analysis, there is often the problem of spectral line aliasing of different components, which increases the difficulty of spectrum analysis. In response to this problem, this section studied IR absorption spectroscopy technology based on time-frequency analysis. The time-frequency characteristic matrix with a suitable scale was obtained through the variance of wavelet coefficients, and it was analyzed for the correlation between time and frequency. Through the correlation analysis of the frequency dimension at the characteristic absorption position, the identification threshold was obtained, and the component identification of the gas mixture was completed.
Time-Frequency Characteristic Matrix Analysis
Continuous wavelet transform was performed on the second derivative spectrum, and the time-frequency characteristic matrix of the spectrum was analyzed from both time and frequency to realize the component identification of the gas mixture. To verify the accuracy of the proposed component identification method, the absorption spectra of methane and nitrogen dioxide with wavenumbers of 2900–2935 cm-1 in the Pacific Northwest National Laboratory (PNNL) spectral library were selected as the simulation basis, and a group of gas mixtures only containing methane and nitrogen dioxide was constructed. Among them, the concentration ratio of methane in the gas mixture was 0%, 20%, 40%, 60%, 80%, and 100%.
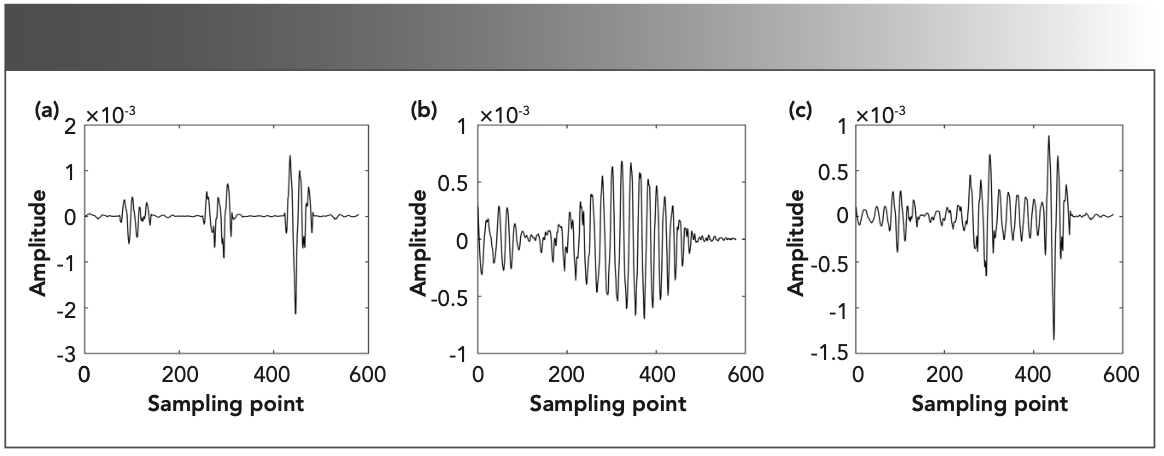
This paper uses the direct difference method (17) to obtain the second derivative spectra of methane, nitrogen dioxide, and the gas mixture with methane concentration ratio of 60%. The second derivative spectrum is shown in Figure 1.
FIGURE 1: The second derivative spectrum of the three gases: (a) methane, (b) nitrogen dioxide, and (c) methane, with a concentration ratio of 60%.
Continuous wavelet transform was used to process the second derivative spectrum, and the corresponding time-frequency characteristic matrix was obtained. The wavelet basis function chose Mexican Hat, which is the second derivative of the Gauss function. It has better localization in the time domain and frequency domain, and it is the closest to the second derivative spectrum in form. The second derivative spectrum of different gases have different shapes, so the scale range of the corresponding time-frequency characteristic matrix should be selected according to the measured component.
Taking methane as an example, the time-frequency characteristic matrix was studied to select the appropriate scale range. The variance of wavelet coefficients reflects the distribution of the energy of the signal fluctuation with the scale. Therefore, the variance of wavelet coefficients was used as the judgment basis. The time-frequency characteristic matrix of methane is shown in Figure 2a, and the variance of wavelet coefficients of methane is shown in Figure 2b. Figure 2b shows the distribution state of the scale relative to the energy in the time-frequency characteristic matrix. The appropriate scale range can be selected according to the energy distribution.
FIGURE 2: The time-frequency analysis of the second derivative spectrum: The time-frequency characteristic matrix of (a) methane, (c) nitrogen dioxide, (d) methane concentration ratio of 60%, and (b) the variance of continuous wavelet transform coefficients of methane.
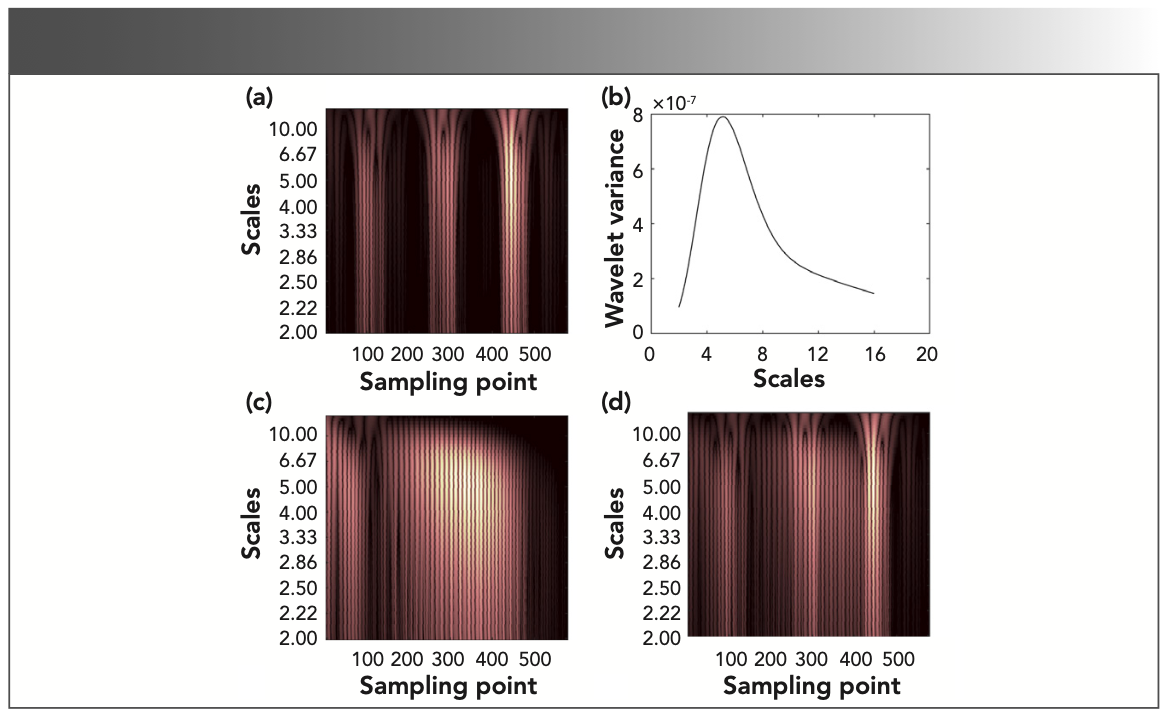
It can be seen from Figure 2 that the abscissa of the higher brightness part of the time-frequency characteristic matrix corresponded to the characteristic absorption position in the second derivative spectrum, and the ordinate of the higher brightness part corresponded to the characteristic absorption frequency at the characteristic absorption position.
Correlation Analysis
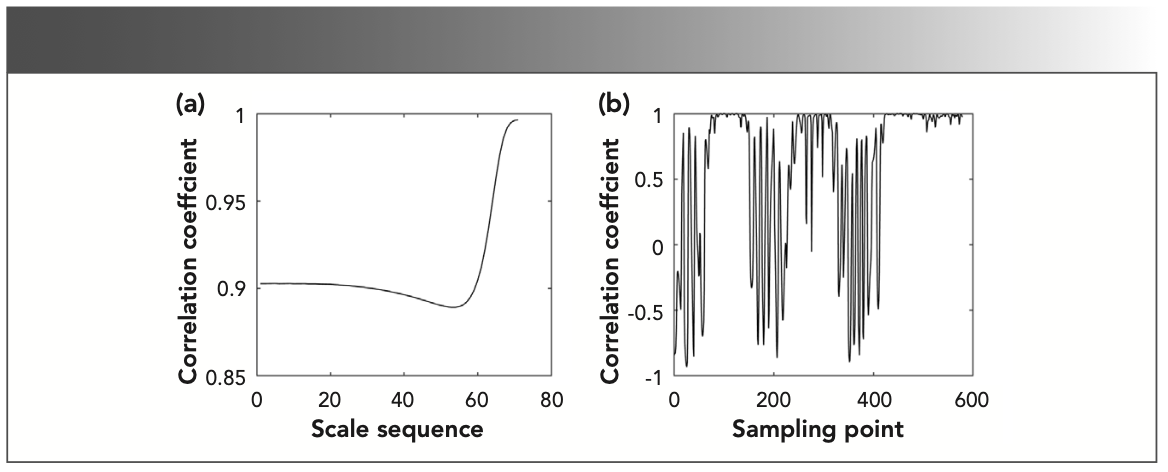
The time-frequency characteristic matrix includes information of frequency and time dimensions, and the frequency correlation and time correlation need to be analyzed separately. Frequency correlation is also called line correlation. The larger the line correlation coefficient, the higher the possibility that the gas mixture contains the gas to be measured. Time correlation is also called column correlation. The column correlation coefficient close to 1 indicated that the characteristic absorption position of the gas to be measured in the gas mixture. Taking the gas mixture with a methane concentration ratio of 60% and methane as an example for correlation analysis, the correlation curve is shown in Figure 3. It is worth noting that there is a corresponding relationship between the effective interval range of the scale sequence axis in Figure 3a and the effective interval range of the scales axis in Figure 2a, rather than an equal relationship between numbers.
FIGURE 3: Correlation curve of two time-frequency characteristic matrices of methane and gas mixture: (a) line correlation and (b) column correlation.
The column correlation analysis showed that there were characteristic absorption positions and non-characteristic absorption positions of the gas to be measured in the entire spectrum interval. The background interference and other components in the non-characteristic absorption position would interfere with the component identification of the gas to be measured in the gas mixture. Therefore, it was necessary to extract the characteristic absorption position of the gas to be measured in the gas mixture. Removing the influence of non-feature absorption position and then performing component identification based on line correlation analysis.
The size of the line correlation coefficient indicated whether the gas mixture contained the gas to be measured. As long as the line correlation coefficient at the characteristic absorption position was greater than the identification threshold of the strong part of the characteristic absorption, it can be considered that the gas mixture contained the gas to be measured.
According to Figure 2a and the relationship between the scale and energy in the variance of wavelet coefficients, the scales range corresponding to the characteristic absorption position of the gas mixture is 4.2–7.1, and the corresponding scale sequence range in Figure 3a is 5.0–29.0. Only by determining the line correlation coefficient in the scale sequence range 5.0–29.0 can infer whether there is methane in the gas mixture. As shown in Figure 3a, the line correlation coefficient of the time-frequency characteristic matrices between methane and gas mixture is greater than 0.85 in the scale sequence range 5.0–29.0, indicating that the gas mixture contains methane. From the column correlation curve in Figure 3b, it can be seen that the column correlation coefficient is almost 1 near the 100, 300, and 500 sampling points, indicating that the characteristic absorption position of methane is near the 100, 300, and 500 sampling points in the spectrum of gas mixture.
Select the Identification Threshold
The identification threshold of related components was obtained by correlation analysis. If the line correlation coefficient in the scale sequence at the characteristic absorption position was greater than the identification threshold, the gas mixture contained the gas to be measured. The time-frequency characteristic matrix of methane and the time-frequency characteristic matrices of the gas mixture with a methane concentration ratio of 0%, 20%, 40%, 60%, 80%, and 100% were analyzed for line correlation, and nitrogen dioxide is the same argument. The line correlation curve is shown in Figure 4. The solid line represents the line correlation between methane and the gas mixture, and the imaginary line represents the line correlation between nitrogen dioxide and the gas mixture. The concentration axis represents the concentration ratio of the gas to be measured in the gas mixture.
FIGURE 4: The line correlation curve of the time-frequency characteristic matrices of methane, nitrogen dioxide, and gas mixtures of different concentration ratios.
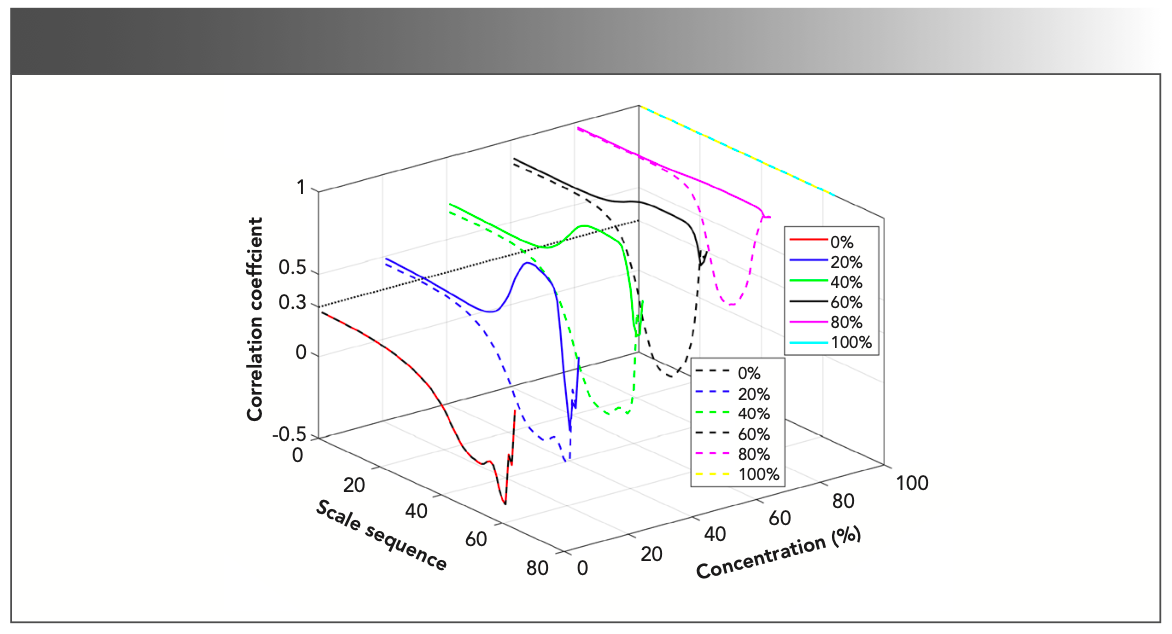
It can be seen from Figure 2 that the scales range in the time-frequency matrix corresponding to the characteristic absorption position is 4.2–7.1, and the corresponding scale sequence range is 5.0–29.0. Therefore, as long as the line correlation coefficient in the scale sequence 5.0–29.0 is judged, it is possible to know whether there is the gas to be measured in the gas mixture. It can be seen from Figure 4 that the line correlation coefficient of the line correlation curve in the interval of the scale sequence of 5.0–29.0 is above 0.3, and the identification threshold can be estimated to be 0.3.
Verification the Identification Threshold
In the “Select the Identification Threshold” section, through the correlation analysis of the time-frequency characteristic matrices of methane, nitrogen dioxide and their gas mixture, the scale sequence is in the interval of 5.0–29.0, and the correlation coefficient is greater than 0.3. It can be considered that the gas mixture contains the gas to be measured for comparison.
Gas Detection
Data Acquisition
The experimental device was a Spectrum GX I spectrometer produced by PerkinElmer. The resolution of the instrument was 0.15 nm, and the measured wavelength range was 2080–2375 nm. The total light path of the multi-pass gas absorption cell was 4.8 meters.
For the experimental conditions, the temperature was 17±0.5 °C, and the relative humidity was 30%. The nitrogen background was subtracted by the software. Each spectrum was scanned 16 times and the average was taken.
The experimental gas was the gas mixture of propane, propylene, and methyl-benzene. A group of experimental gases were the examples, as shown in Table I.

Data Processing
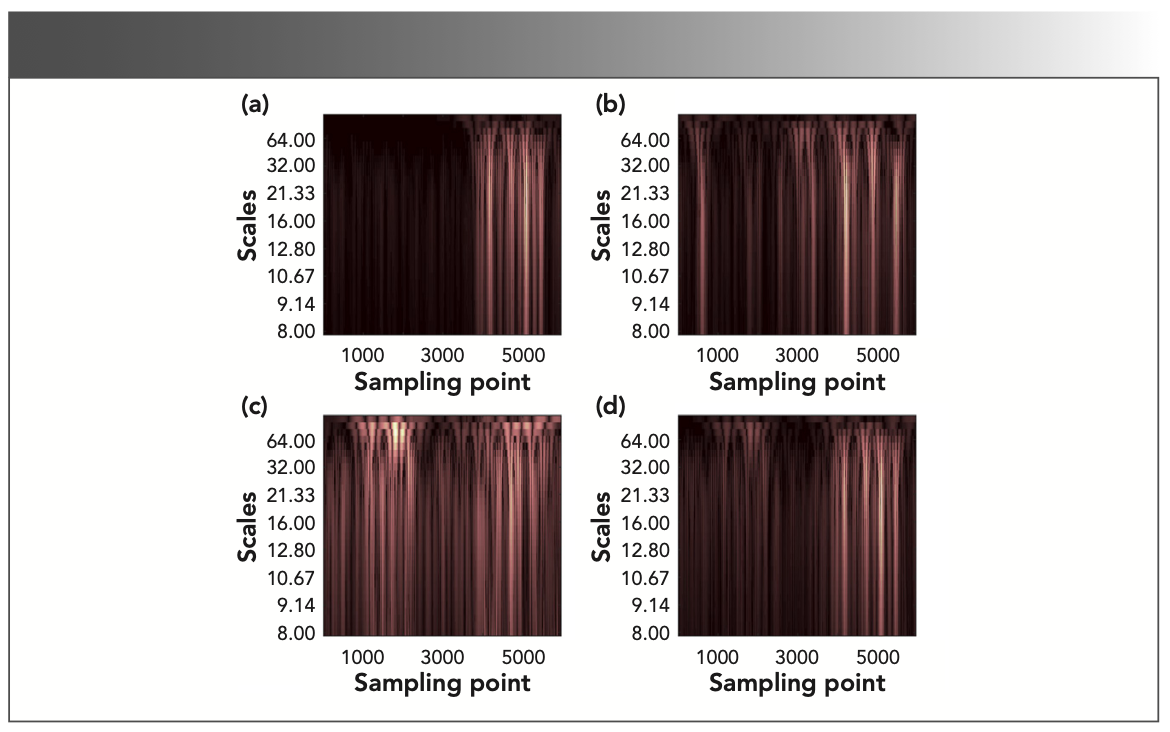
Taking gas1 as an example, continuous wavelet transform was performed on the second derivative spectrum of the IR absorption spectrum from propane, propylene, methylbenzene, and gas1, and the scale range of 8.0–256.0 was selected according to the variance of wavelet coefficients; this can then determine the time-frequency characteristic matrix of the corresponding gas, as shown in Figure 5.
FIGURE 5: The time-frequency characteristic matrix of different gases: (a) propane, (b) propylene, (c) methylbenzene, and (d) gas1.
Correlation analysis was performed on three pairs of time-frequency characteristic matrices of propane, propylene, methylbenzene, and gas1, respectively. The corresponding correlation curves are shown in Figure 6.
FIGURE 6: The line correlation curve of the three gases: (a) propane, (b) propylene, and (c) methylbenzene with gas1. The column correlation curve of the three gases: (d) propane, (e) propylene, and (f) methylbenzene with gas1.
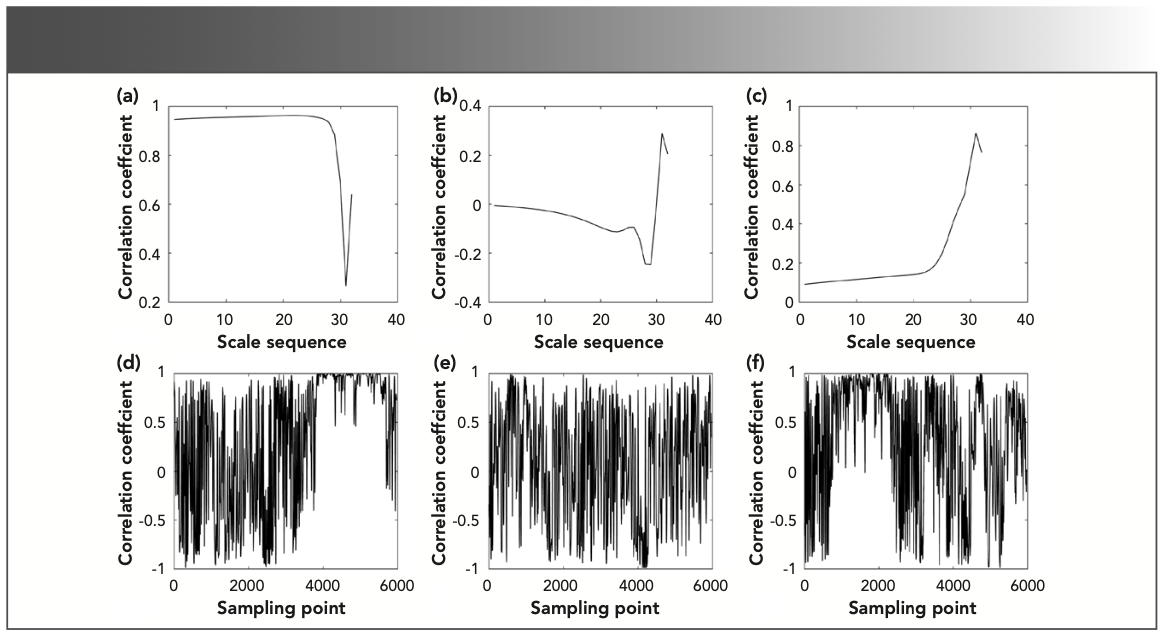
It can be seen from Figure 5 that the scale range corresponding to the characteristic absorption position in the time-frequency characteristic matrix is 11.0–32.0, and the scale sequence range corresponding to the line correlation curve in Figure 6 is 10.0–25.0. As shown in Figure 6a, the line correlation coefficient of the time-frequency characteristic matrices of propane and gas1 in the interval 10.0–25.0 was greater than 0.9, and greater than the identification threshold of 0.3. It can be considered that there is propane in gas1. The line correlation coefficients of propylene, methylbenzene, and gas1 are less than the identification threshold in the same interval. It was impossible to confirm whether propylene and methyl- benzene were contained in gas1.
The line correlation coefficients of the two time-frequency characteristic matrices of propane and gas1 exceeded 0.9 in the interval 10.0–25.0. There was no need to perform line correlation analysis at the characteristic absorption position. The characteristic absorption position of methylbenzene was 750–2300 sampling points, and the characteristic absorption position of propylene cannot be analyzed. The two time-frequency characteristic matrices of methylbenzene and gas1 are subjected to line correlation analysis at the above-mentioned characteristic absorption positions. The line correlation curves before and after the characteristic absorption position was extracted are shown in Figure 7.
FIGURE 7: The line correlation curve before and after the characteristic absorption position are extracted.
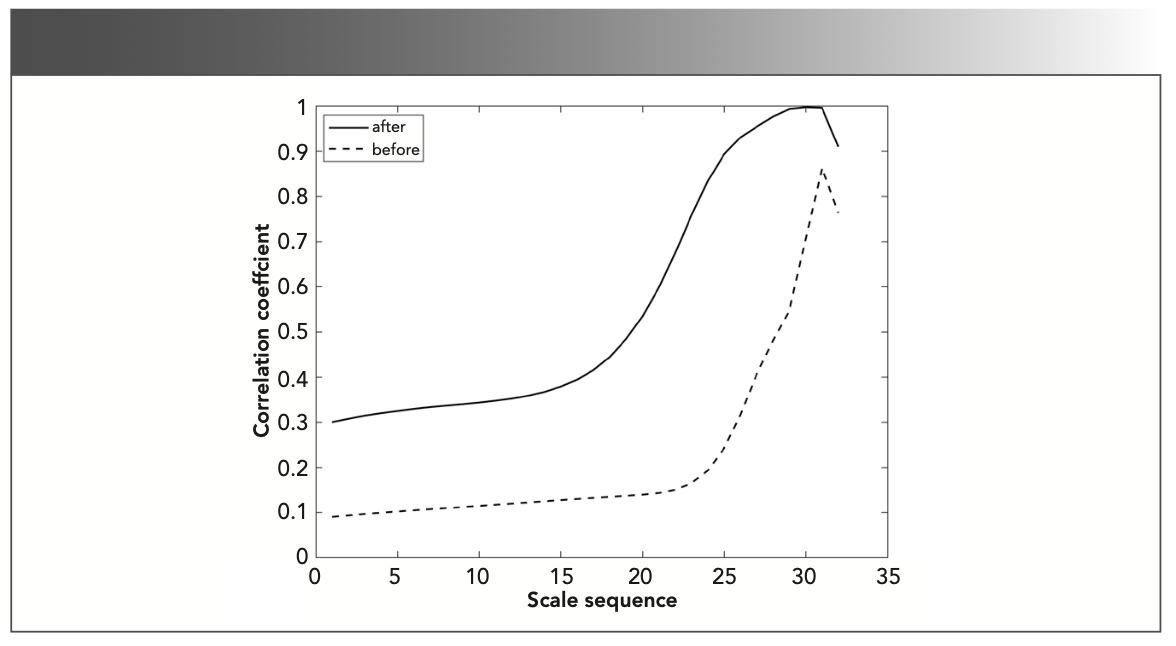
The imaginary line represents the line correlation curve between methylbenzene and gas1 before the characteristic absorption position was extracted, and the solid line represents the line correlation curve between methylbenzene and gas1 after the characteristic absorption position is extracted. As can be seen from Figure 7, the line correlation coefficient of the time-frequency characteristic matrices of methylbenzene and gas1 in the interval 10.0–25.0 is greater than 0.3 after extracting the characteristic absorption position (greater than the identification threshold), and it can be considered that methylbenzene exists in gas1. The characteristic absorption position of the gas to be measured in the gas mixture was not extracted, and the line correlation analysis between the gas to be measured and the gas mixture was performed in the entire spectrum interval. It was determined that gas1 contains propane. After extracting the characteristic absorption position of the gas to be measured in the gas mixture through column correlation analysis, the line correlation analysis between the gas to be measured and the gas mixture is performed on the characteristic absorption position. It is determined that gas1 contains propane and methylbenzene. The concentration of propylene in gas1 was too low to be identified from the gas mixture through the correlation analysis of the time-frequency characteristic matrix.
Gas2 and gas3 were analyzed respectively by the same method. The line correlation analysis was performed between the gas to be measured and the gas mixture in the entire spectrum range. It was determined that gas2 contains propylene. The line correlation analysis was performed between the gas to be measured and the gas mixture in the characteristic absorption position, and it was determined that gas2 contained propane and propylene, but it was impossible to determine whether gas2 contained methylbenzene. The line correlation analysis between the gas to be measured and the gas mixture was performed in the entire spectrum range. It was determined that gas3 contains propylene. The characteristic absorption position of propane and methylbenzene could not be found, and it could not be determined whether gas3 contained propane and methylbenzene.
Both gas1 and gas2 were gas mixtures of propane, propylene, and methylbenzene. Line correlation analysis in the entire spectral interval showed that gas1 contained propane and gas2 contained propylene. Line correlation analysis at the characteristic absorption position shows that gas1 contained propane and methylbenzene and gas2 contained propane and propylene. The experimental results showed that the correlation analysis after extracting the characteristic absorption position can eliminate the influence of other components, background interference, and noise in the non-characteristic absorption position on the recognition result, expanding the range of noise interference and improving the accuracy of component identification. The IR absorption spectroscopy technology based on time-frequency analysis could effectively identify the target component from the gas mixture when the concentration reaches a certain level.
Conclusion
The above research shows that IR absorption spectroscopy technology based on time-frequency analysis has the advantages of high sensitivity and high resolution. Derivative spectroscopy can reduce the effects of background and noise. The time-frequency characteristic matrix obtained by continuous wavelet transform processing the second derivative spectrum can be used for time and frequency correlation analysis. The irrelevant gas research further illustrates the rationality of selecting the identification threshold. By analyzing the column correlation, extracting the characteristic absorption position of the gas to be measured, and then, by performing the line correlation analysis, the identification accuracy can be improved. Simulation analysis and experimental results show the feasibility of this method. Therefore, the application of IR absorption spectroscopy technology based on time-frequency analysis in the field of trace gas detection will be more extensive, and there will be better development prospects.
Conflicts of Interest
The authors declare that they have no competing interests.
Acknowledgments
This research has been supported by the Natural Science Foundation of Hebei Province (F2014202065), the National Natural Science Foundation of China (61505142), and the open project of the Key Laboratory of Micro Optoelectro Mechanical System Technology at Tianjin University, in the Ministry of Education.
References
(1) S.M. Eid, K.M. Kelani, O.M. Badran, M.R. Rezk, and M.R. Elghobashy, Anal. Chim. Acta 1117, 60–73 (2020). DOI: 10.1016/j.aca.2020.04.040.
(2) D. Rosas-Vara, J.R. Molina-Contreras, F. Villalobos-Pina, J.C. Zenteno, B. Buentello-Volante, O.F. Chacon-Camacho, et al, Chem Pap 74(4), 1079–1086 (2020). DOI: 10.1007/s11696-019-00948-x.
(3) S. Yasar, R. Tosun, and Z. Sonmez, Measurement 161, 107895 (2020). DOI: 10.1016/j.measurement.2020.107895.
(4) H. Wu, J. Chen, A.W. Liu, S.M. Hu, and J.S. Zhang, Chin. J. Chem. Phys. 33(1), 1–7 (2020). DOI: 10.1063/1674-0068/cjcp1910173.
(5) A.P. Fellows, M.T.L. Casford, and P.B. Davies, Appl. Spectrosc. 74(5), 597–615 (2020). DOI: 10.1177/0003702819898536.
(6) L.L. Wang, and M. Jia, Laser J. 41(3), 25–28 (2020). DOI: 10.14016/j.cnki.jgzz.2020.03.025.
(7) F. Yan, Q.B. Zhu, M. Huang, C.Z. Liu, L.W. Zhang, and H. Zhang, Chin. J. Anal. Chem. 48(2), 298–305 (2020). DOI: 10.19756/j.issn.0253.3820.191256.
(8) Y.L. Li, Q. Wang, N. Sun, W.P. Zhou, and C.H. Liu, Spectrosc. Lett. 46(7), 507–515 (2013). DOI: 10.1080/00387010.2012.762403.
(9) A. Cicone, and H.M. Zhou, Numer. Math. Theor. Meth. Appl. 10(2), 278–298 (2017). DOI: 10.4208/nmtma.2017.s05.
(10) S. Chaudhary, S. Taran, V. Bajaj, and A. Sengur, IEEE Sens. J. 19(12), 4494–4500 (2019). DOI: 10.1109/JSEN.2019.2899645.
(11) J.N. Wang, B. Li, G.Y. Lin, Q.J. Ma, S.R. Wang, and M.X. Piao, Spectrosc. Lett. 52(2), 113–120 (2019). DOI: 10.1080/00387010.2019.1569063.
(12) B. Sergej, C. Kijatkin, D. Berben, and M. Imlau, Appl. Sci. 9(22), 4933 (2019). DOI: 10.3390/app9224933.
(13) S. Buckley, Spectroscopy 31(10), 24–30 (2016).
(14) P. Ineichen, Remote Sens. 10(3), 435 (2018). DOI: 10.3390/rs10030435.
(15) L. M. Dingemans, V.M. Papadakis, P. Liu, A.J.L. Adam, and R.M. Groves, J. Eur. Opt. Soc-Rapid 13, 40 (2017). DOI: 10.1186/s41476-017-0068-2.
(16) D. Zhen, Z.L. Wang, H.Y. Li, H. Zhang, J. Yang, and F.S. Gu, Appl. Sci. 9(18), 3902 (2019). DOI: 10.3390/app9183902.
(17) Y. Zhang and M.R. Zhou, Infrared Technol. 29(6), 345–348 (2007). DOI: 10.3969/j.issn.1001-8891.2007.06.009.
Yongbo Yu, Houfei Shang, Nan Gao, Zhaozong Meng, and Zonghua Zhang are with the School of Mechanical Engineering at Hebei University of Technology, in Tianjin, China. Zhenhui Du is with the State Key Laboratory of Precision Measuring Technology and Instruments at Tianjin University, in Tianjin, China. Gao and Du are also with the Key Laboratory of Micro Optoelectro Mechanical System Technology at Tianjin University, in Tianjin, China. Jinyi Li is with the Key Laboratory of Advanced Electrical Engineering and Energy Technology at Tiangong University, in Tianjin, China. Direct correspondence to: ngao@hebut.edu.cn ●

Newsletter
Get essential updates on the latest spectroscopy technologies, regulatory standards, and best practices—subscribe today to Spectroscopy.


