Real-Time Chemometric Analysis of Multicomponent Bioprocesses Using Raman Spectroscopy
Quantitative measurement is essential for modern bioreactor synthesis, which plays a crucial role in the production of foods and pharmaceuticals. These complex processes rely on living organisms, and require fast, high-performing inline analytics for effective process control and intervention. In this study, a glycerol-fed, lab-scale E. coli bioprocess producing representative pharmaceutical compounds was monitored offline with a portable, high-sensitivity Raman spectrometer. Sampling and high performance liquid chromatography (HPLC) analysis provided the ground truth calibration for a chemometric model developed using an easy-to-use, built-for-Raman chemometric software package. The chemometric model developed demonstrates the ability of this approach to offer spectroscopic prediction of feedstock, active pharmaceutical ingredients (API), and side product concentrations. This specific combination of compact spectrometer and AI-driven analysis software opens the door for the application of real-time, continuous, and non-invasive Raman spectroscopy in bioprocess monitoring, even for users without prior chemometric or Raman experience.
Fermentation has been used for thousands of years in the production of foods, such as beer, wine, bread, yogurts, sauerkraut, vinegar, and more, using natural microorganisms. Much more recently, genetically modified microorganisms have been developed to produce complex molecules of interest from simple feed stocks—often in batch-fed processes, where nutrients are added during the fermentation process (1). The regular or continuous measurement of these nutrient (and product) levels can be used to guide the process to significantly improve product quality, consistency, and yield.
Bioprocess development and production are very sensitive to microorganism contamination, which can generate unwanted by products or compete with the desired cell line to reduce yield, thereby costing time, effort, and money. For this reason, it is preferable to perform process and contamination monitoring measurements in-line and non-invasively at the fermenter, for example optically through a view port. This avoids breaking the sterile seal, and it can provide much faster feedback than traditional offline sampling methods (2).
Raman spectroscopy, with its unsurpassed specificity and tremendous application simplicity, is a prime candidate for continuous in-line measurements. Raman’s ability to distinguish many different chemicals in parallel, its insensitivity to water, and the ability to deploy using a simple probe-based system or through a view port makes it well-suited for the monitoring and control of bioprocesses with greater consistency and yield. Recent technological advances have made Raman spectroscopy more affordable, accessible, and attractive to this biotechnology audience (3). However, the transformation of spectroscopic measurements into quantitative concentration information, often called chemometric analysis, remains a barrier to the full acceptance of this approach.
Here, we present the combination of affordable, sensitive, and reliable Raman instrumentation with artificial intelligence (AI)-powered analysis software designed for spectroscopy newcomers that can, together, make in-line Raman measurements accessible to a much wider audience in the biotechnology field, from laboratory to production, and without specialist training.
Materials and Methods
A biochemical process was conducted which produces two representative active pharmaceutical ingredients (API) of interest (Product 1 and Product 2) using a genetically modified E. coli strain and glycerol as feedstock. As part of the process, three side products (Acid 1, Acid 2, Acid 3) are also generated. The fermentations were run in a fermenter with 50 L capacity.
In this study, samples were extracted hourly from the bioreactor, and analyzed using high performance liquid chromatography (HPLC), to provide ground truth concentration measurements for all products, acids, and feedstock (glycerol). In parallel, Raman spectra were collected for each of the extracted samples, and the combined data set was used to train the chemometric analysis. Cell density was also determined for each extracted sample using optical density measurements performed at 800 nm using a standard photometer, providing a complementary indicator of E. coli population throughout the process (Figure 1). Two runs were performed using different feeding conditions to cover variations in the biochemical process, with 22 samples taken hourly during the first run, and 27 samples during the second run.

.")
FIGURE 1: Samples were extracted from the bioreactor hourly for offline measurement with a portable Raman system, complemented by HPLC and optical density measurements (representative 785 nm Raman system schematic courtesy of Wasatch Photonics).

For each sample, Raman spectra were recorded with a compact, portable Raman spectrometer with an integrated 785 nm laser providing up to 450 mW of excitation power (Wasatch Photonics), which was fiber-coupled to an external Raman probe for flexibility. The spectrometer utilized a high-throughput f/1.3 optical bench configured with a 25 µm slit and a thermoelectric cooling (TEC) detector regulated to 10 °C for dark noise reduction and thermal stability. The use of a low f/# (high numerical aperture) optical bench was chosen to increase the amount of Raman scattering that could be collected from the sample, thereby reducing measurement time to provide more rapid process feedback, and making a more expensive, highly cooled detector unnecessary.
The Raman probe was equipped with an immersion tip for offline Raman measurements of the extracted samples (MarqMetrix, Inc.). This dip probe uses a sapphire ball lens to achieve a very short working distance of about 100 µm, making it possible to collect Raman spectra from optically dense media; its short path length minimizes light scattering from the microorganism population present in bioreactor samples. This type of immersion probe is also rated for high temperature and pressure, making it a viable option for in situ bioprocess monitoring.
The Raman spectra acquired covered the Raman fingerprint region, specifically 270 to 2000 cm-1 with 7 cm-1 resolution. Approximately 20 Raman spectra were collected and averaged for each of the extracted samples, using full laser power and an acquisition time of 1500 ms per spectrum to achieve full-scale measurement. Although extended Raman spectral measurements up to 3500 cm-1 are available in a similar footprint, and could offer additional information from fundamental Raman bands, the fingerprint range is often sufficient to achieve high quality chemometric analysis. Similarly, resolution below 8 cm-1 is seldom needed when performing multivariate analysis of organic compounds.
Results
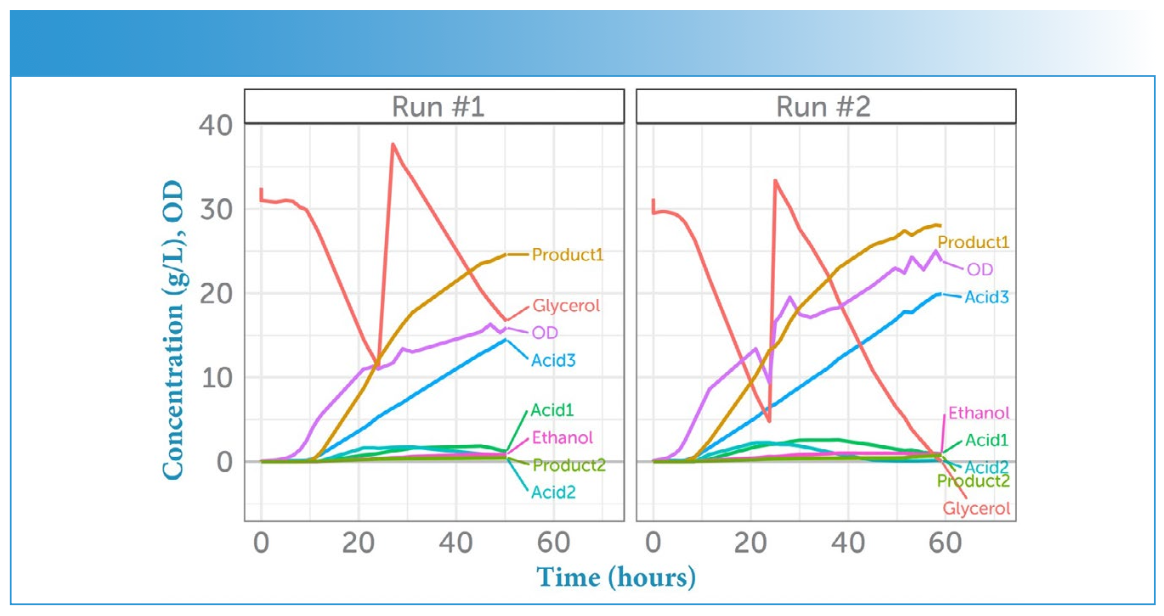
The evolution of the concentrations for the feedstock (glycerol), the pharmaceutically active products (Product 1, Product 2), and all acid side products (Acid 1, Acid 2, Acid 3) as determined via HPLC are shown for both experimental runs in Figure 2, as is the optical density (OD) of the extracted samples. The second addition of the feedstock glycerol is evident in its spike in concentration approximately 25 h into each run. The corresponding Raman spectra for the hourly samples are displayed in Figure 3 as a time series, and show a similar dramatic change upon the addition of more glycerol.

, both API products (Product 1 and Product 2), as well as the side products (Acid 1, Acid 2, Acid 3) as a function of time for both runs (Run #1 vs. Run #2). The feedstock was provided at the start of each run, and again after about 24 h, causing a spike in its concentration. Optical density (OD) measurements to track the E. coli population growth are overlaid in purple.")
FIGURE 2: Concentrations in time. Evolution of the concentration of feedstock (glycerol), both API products (Product 1 and Product 2), as well as the side products (Acid 1, Acid 2, Acid 3) as a function of time for both runs (Run #1 vs. Run #2). The feedstock was provided at the start of each run, and again after about 24 h, causing a spike in its concentration. Optical density (OD) measurements to track the E. coli population growth are overlaid in purple.

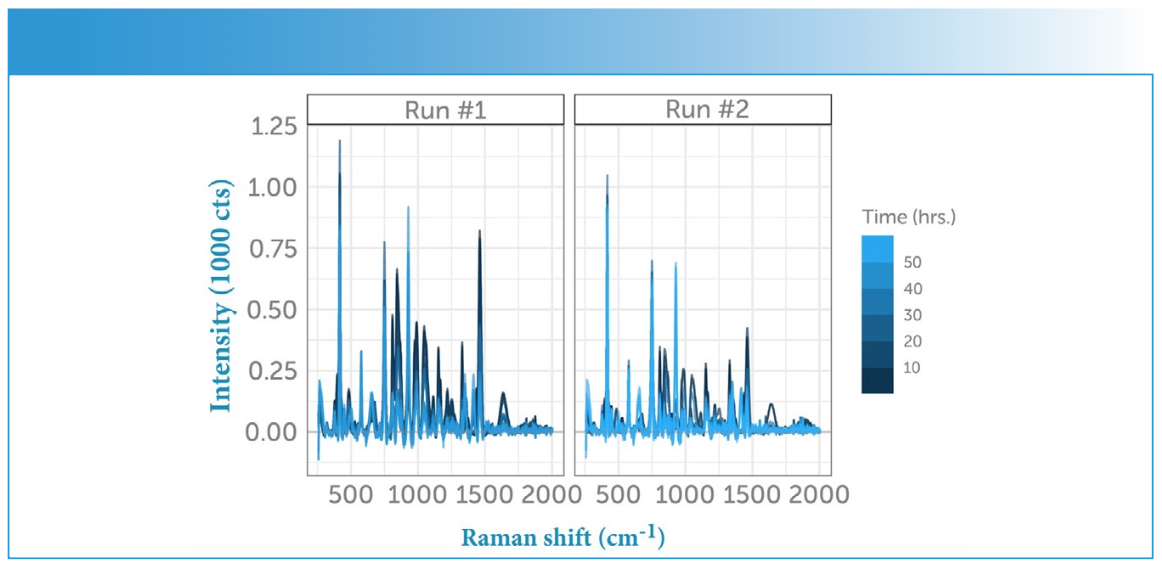
. The feedstock (glycerol) was provided at the start of the run, and again after about 24 h, causing a dramatic change in the Raman spectrum. Note how the peaks in the spectrum change and back- ground fluorescence increases as the feedstock is converted into the APIs and byproducts by the increasing population of E. coli.")
FIGURE 3: Averaged sample spectra. Evolution of the Raman spectra in time for both runs (Run #1 vs. Run #2). The feedstock (glycerol) was provided at the start of the run, and again after about 24 h, causing a dramatic change in the Raman spectrum. Note how the peaks in the spectrum change and back- ground fluorescence increases as the feedstock is converted into the APIs and byproducts by the increasing population of E. coli.

Three compounds were dominant in the fermentation: the feedstock (glycerol), API Product 1, and side product Acid 3. Analysis was focused on those three components as representative of the bioprocess, as all other compounds were only present in very low concentration.
Unlike the HPLC and optical density (OD) measurements, which can be tied directly to a specific component in the bioreactor, each raw Raman spectrum contains information about all components in the mixture. Each compound present contributes its own unique signature of peaks to the combined Raman spectrum, as does the growing E. coli population. Therefore, as the feedstock is converted into APIs and byproducts, the pattern of peaks and their intensities change, providing a rich source of information about the chemical composition inside the bioreactor over time. The increase in OD as a measure of cell density, for example, is reflected in the Raman spectra as a substantial increase in fluorescence background and is due to E. coli’s complex organic structure.
Data Analysis: Preprocessing
Before attempting to predict the chemical composition of the bioreactor mixture from its Raman spectra, it is advisable to remove the dominant background from each spectrum in a preprocessing step known as baseline subtraction, as shown in Figure 4. First, derivative transformation is sometimes used as an alternative to baseline subtraction because it can also effectively isolate the locations and relative magnitude of the peaks within the spectrum. These types of preprocessing transformations help to bring out the important spectral features, while suppressing irrelevant interferences.


FIGURE 4: Baseline corrected averaged sample spectra. Evolution of the Raman spectra after removal of the fluorescence background using baseline subtraction in the RamanMetrix software package. The changing composition inside the bioreactor is evident in the change in dominant Raman peaks and their intensity with time.
As can be seen in Figure 4, the increase in the intensity of the main product’s sharp Raman peaks with time is now clearly visible in the baseline-corrected spectra. The resulting spectra are still very complex, and thus accurate answers depend upon acquiring Raman spectra with a good signal-to-noise ratio (S/N), thermal stability, and a high degree of reproducibility. This is because the spectral differences needed to distinguish between similar compounds and changes in concentration can be small, and may emerge only from the chemometrics.
To perform preprocessing and analysis more easily, the Raman spectra were imported into the web-based front end of the RamanMetrix software package. A simple graphical interface, as shown in Figure 5, guides the user through the recommended preprocessing steps in the correct order. For beginning users, many parameters and options are preset and hidden for simplicity, whereas for advanced users additional options and parameters can be made available to allow fine-tuning and control (4).

 for the RamanMetrix analysis soft- ware showing the application of baseline correction parameters at the pre- processing stage.")
FIGURE 5: Graphical user interface (GUI) for the RamanMetrix analysis soft- ware showing the application of baseline correction parameters at the pre- processing stage.

For this study, baseline correction was enabled, as was the “normalization” option, which removes the impact of integration time, laser power, and any other relevant recorded experimental settings. The spike removal feature was not implemented, as no signal spikes were present for any pixels on the Raman spectrometer detector at the 1500 ms acquisition time used. Likewise, the wavenumber and intensity correction features were not required, as these features were available in the native Raman software for the Wasatch Photonics spectrometer. Although use of these corrections is not essential when all measurements and predictions are performed with the same equipment, they are good practice, and in fact essential when transfer of chemometric models between instruments is needed on the process line.
Data Analysis: Chemometric Modelling
The goal of chemometric analysis in this study was to determine whether analyte concentrations can be predicted accurately from the Raman spectra. Unlike sample extraction and traditional offline analysis, Raman analysis could potentially be performed in situ with a probe or through a bioreactor window without breaking the sterile seal of the vessel and risking contamination of the fermentation process.
Once preprocessing was complete, a chemometric model was developed in the RamanMetrix software by importing the concentration data determined by HPLC as metadata and associating it with the corresponding Raman spectra. From there, it was possible to choose from a selection of proven modeling approaches, from simple regressions to advanced neural networks, with guidance through the selection of parameters and options according to the desired level of detail. This made it possible to easily compare different modeling approaches, optimizing the prediction accuracy for each analyte of interest.
Three analytes were selected for modeling: the feedstock (glycerol), the main product (Product 1), and the main side product (Acid 3). Principal component analysis (PCA) is frequently used for analysis of Raman spectra because it simplifies the data set by identifying spectral patterns that differ between measurements. Each of these component spectra can then be examined for the Raman peaks expected for the different analytes to ensure that the spectra make sense chemically.
Since the goal in this experiment was a quantification prediction, a support vector machine (SVM) model based in PCA scores with six components was utilized. This is a somewhat “local” model (as opposed to a regression line across the full data set range), which is a bit more flexible. Six components might also seem very flexible, but both cross-validation on the calibration data and the good predictions for the test samples show that the model did not overfit the training data. Cross-validation (leaving samples out in a round-robin fashion for error estimates) proposed an even higher number of components, so this was manually reduced to six components. The model was trained on a combined data set from the two runs for better generalization to future runs.
Model Performance
To quantify the model performance, three samples from different time points in the fermentation process were excluded from the model calculation for use as test samples: 1) Run #2, sample #7 at 7.5 h, 2) Run #1, sample #15 at 25.5 h, and 3) Run #2, sample #20 at 47.6 h. Model predictions were then performed using these “unseen” sample spectra. The comparison between actual and predicted concentration for the three analytes of interest is shown in Figure 7.

 and predicted concentrations (dots) for the three main analytes as a function of time for each run (Run #1 vs. Run #2).")
FIGURE 7: Concentrations in time. Comparison of actual concentrations (lines) and predicted concentrations (dots) for the three main analytes as a function of time for each run (Run #1 vs. Run #2).
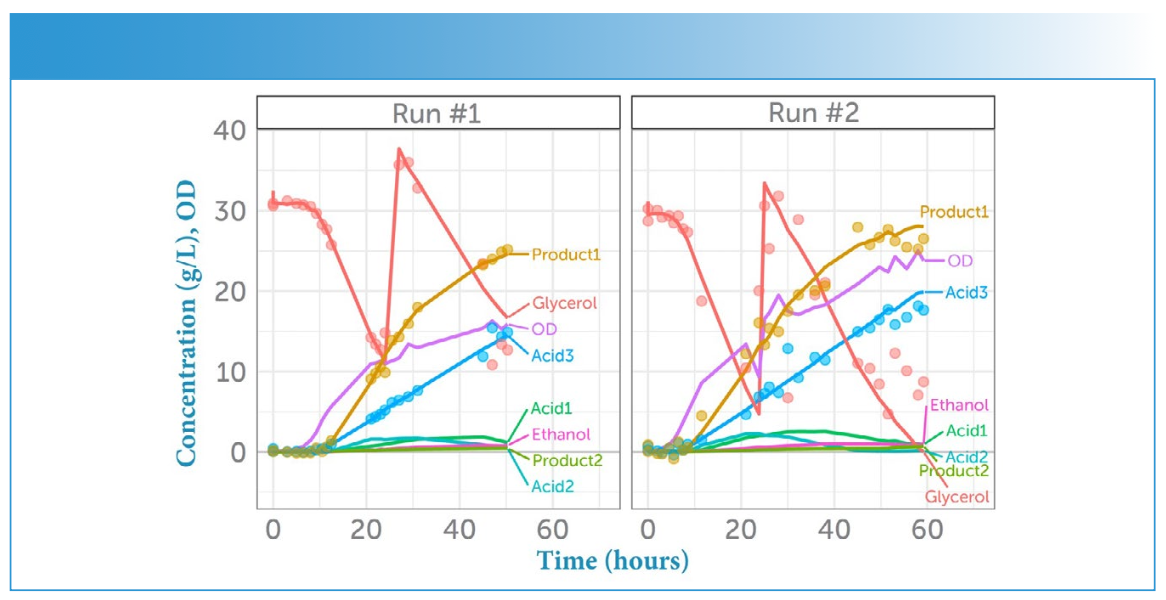
We see a very good prediction in both calibration and test for Acid 3 and Product 1. The prediction for glycerol is not quite as good for the calibration samples at lower concentrations, which might be due to the weak Raman spectrum of glycerol. Plotting the concentration predicted by Raman spectroscopy against the known concentrations from HPLC measurements, as shown in Figure 7, we see that the predictions are very good for all three analytes for Run #1. The greatest deviation from prediction was observed for glycerol, specifically in the second half of the run (at lower concentration, and at a point in the process when OD and hence cell density was high, contributing additional background fluorescence).
The model predictions were easily performed as part of the standard workflow provided by the RamanMetrix software. All preprocessing steps were automatically repeated on the new test samples and the same model that developed with the training samples was applied to the test samples to predict the new concentrations.
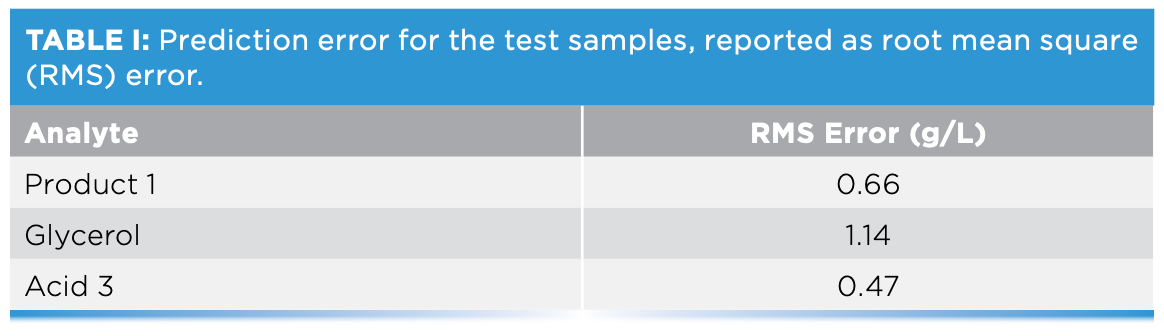
Because HPLC “ground truth” measurements were known for the three test samples, the deviation between predicted and actual concentrations could be determined. Model performance, reported as the root mean square error of the prediction determined from the averaged test spectra, is shown in Table I.


Discussion
The concentration predicted via Raman spectroscopy tracked very closely with the actual concentrations for all three analytes modeled, through most of the bioprocess. Furthermore, compared to the spread of the concentrations 0 to 20–30 g/L for these main analytes, the prediction error obtained from the model was low. Notably, it was highest for the feedstock, which is the component which would require the least accuracy in practice. In future, training of the models with additional runs would develop it further to account for run-to-run variations in factors like seed bacteria quality, trace contamination, and the feedstock. Future work, currently in progress, will transition to measurements through a view port to further prove out the technique.
Conclusion
Overall, given the ease and speed of Raman spectroscopy, and the potential advantages of in-line testing, Raman measurements analyzed with chemometric modeling are a promising alternative to offline measurements for rapid, accurate bioprocess monitoring. Combining compact, reliable, and sensitive Raman instrumentation with user-friendly, AI-driven chemometric analysis software opens the door to in-line monitoring of fermentation processes, making Raman more accessible for the non-expert seeking to apply this powerful technique.
Acknowledgments
We would like to thank Lars Regestein and Annika Lenic from the Leibniz Institute for Natural Product Research and Infection Biology (Hans Knöll Institute, Jena, Germany) for the opportunity to access the fermentation process, for the laboratory analyses, and for their valuable support.
References
(1) Smith, J. E. Bioprocess/Fermentation Technology. In Biotechnology, 5th ed.; Cambridge University Press, 2009, 49–72. DOI: 10.1017/CBO9780511802751
(2) Gustavsson, R.; Mandenius, C. F.; Löfgren, S.; Scheper, T.; Lindner, P. In situ Microscopy as Online Tool for Detecting Microbial Contaminations in Cell Culture, J. Biotech. 2019, 296, 53–60. DOI: 10.1016/j.jbiotec.2019.03.011
(3) Challener, C. A. Advances in Inline Monitoring for Improved Bioreactor Performance: Process and bioreactor performance are directly impacted by real-time monitoring capabilities. BioPharm Int. 2023, 36 (9), 22–28. https://link.gale.com/apps/doc/A765796504/AONE?u=anon~966f443b
(4) Storozhuk, D.; Ryabchykov, O.; Popp, J.; Bocklitz, T. RAMANMETRIX: A Delightful Way to Analyze Raman Spectra. arXiv preprint 2022. DOI: 10.48550/arXiv.2201.07586
Joerg Weber, Andreas Latza, Oleg Ryabchykov, and Oliver Valet are with Biophotonics Diagnostics GmbH, in Jena, Germany. Darina Storozhuk is with the Leibniz Institute of Photonic Technology, in Jena, Germany. Cicely Rathmell, Dieter Bingemann, and David Creasey are with Wasatch Photonics, in Morrisville, NC. Direct correspondence to: marketing@wasatchphotonics.com ●


NIR Spectroscopy Explored as Sustainable Approach to Detecting Bovine Mastitis
April 23rd 2025A new study published in Applied Food Research demonstrates that near-infrared spectroscopy (NIRS) can effectively detect subclinical bovine mastitis in milk, offering a fast, non-invasive method to guide targeted antibiotic treatment and support sustainable dairy practices.

Nanometer-Scale Studies Using Tip Enhanced Raman Spectroscopy
February 8th 2013Volker Deckert, the winner of the 2013 Charles Mann Award, is advancing the use of tip enhanced Raman spectroscopy (TERS) to push the lateral resolution of vibrational spectroscopy well below the Abbe limit, to achieve single-molecule sensitivity. Because the tip can be moved with sub-nanometer precision, structural information with unmatched spatial resolution can be achieved without the need of specific labels.

New AI Strategy for Mycotoxin Detection in Cereal Grains
April 21st 2025Researchers from Jiangsu University and Zhejiang University of Water Resources and Electric Power have developed a transfer learning approach that significantly enhances the accuracy and adaptability of NIR spectroscopy models for detecting mycotoxins in cereals.

AI-Powered SERS Spectroscopy Breakthrough Boosts Safety of Medicinal Food Products
April 16th 2025A new deep learning-enhanced spectroscopic platform—SERSome—developed by researchers in China and Finland, identifies medicinal and edible homologs (MEHs) with 98% accuracy. This innovation could revolutionize safety and quality control in the growing MEH market.

