Simultaneous Measurement of Chlorophyll and Water Content in Navel Orange Leaves Based on Hyperspectral Imaging
Here, hyperspectral imaging was used to simultaneously estimate chlorophyll and water content of Gannan navel orange leaves.
Chlorophyll and leaf water content are important nutritional indicators of the Gannan navel orange tree. Hyperspectral imaging was used to simultaneously estimate chlorophyll and water content of Gannan navel orange leaves. The genetic algorithm (GA) and successive projections algorithm (SPA) were applied in selecting characteristic wavelengths after average spectra were extracted from the region of interest (ROI). The hyperspectral effective information was extracted using the partial least squares (PLS) model. The results derived from these techniques were then compared. The prediction model of chlorophyll and water content built using SPA on 8 and 14 selected wavelengths (3.15% and 5.15% of the total number of wavelengths) exhibited higher coefficients of determination r of 0.98 and 0.93 and root mean square error of prediction (RMSEP) values of 3.40 and 0.04, respectively. The results show that the accuracy of the quantitative analysis conducted by hyperspectral imaging can be improved through appropriate wavelength selection. Although the RMSEP value of SPA-PLS was slightly higher than that of GA-PLS, the SPA-PLS model can be used for applications because it was simpler and easier to interpret.
Chlorophyll and leaf water content indirectly reflect the ability of plant growth and photosynthesis and they are closely related to the nutritional status of the plant, which is one of the most important indicators of the Gannan navel orange photosynthetic capacity and developmental stage. Chlorophyll is a green pigment found in cyan bacteria and the chloroplasts of algae and plants. It is an extremely important biomolecule that is critical in photosynthesis, which allows plants to absorb energy from light. Chlorophyll absorbs light mostly in the blue region of the electromagnetic spectrum. However, chlorophyll is a poor absorber of green and near-green regions of the spectrum, hence the green color of tissues containing chlorophyll (1). Traditional measurement of chlorophyll and water in a leaf damages the blade and is time consuming. Typical methods include spectrophotometry (2) and gravimetric methods.
In recent years, hyperspectral imaging has gained wide acceptance in different fields by virtue of its advantages over other analytical techniques. The most important advantage is its ability to record spectra and images simultaneously. The rapid, nondestructive, and reliable features were first used in military and remote sensing (3), and then were applied in astronomy (4), food (5), agriculture (6), and pharmaceuticals (7). Hyperspectral imaging at visible (vis) and short near infrared (SNIR) regions has been used to estimate chlorophyll or water content (8–10) in leaf samples.
Among numerous wavelength selection methods, partial least squares (PLS) has been extensively used to enhance the performance of models constructed (11). Genetic algorithms (GA) add complexity to the computation when the number of selected wavelengths increases (12). Sorol and colleagues (13) applied several wavelength selection algorithms to sort informative wavelengths in building a PLS model to predict the degrees Brix (sugar content) of sugar cane juice. They found that the best results were obtained using GA. A novel forward selection method called the successive projections algorithm (SPA) has been used to obtain a simpler model for minimizing wavelength collinearity. Chen and colleagues (14) used SPA to optimize the NIR spectroscopic quantitative model for potable spirits; they obtained a good predictive correlative coefficient of 0.9477 using only 1.17% of the total number of wavelengths.
Typically, only one variable quantity has been discussed in hyperspectral data of a leaf. In this study, chlorophyll and water content were investigated at the same time for Gannan navel orange leaves. Thus, constructing a robust model using selected informative wavelengths to improve modeling efficiency and prediction accuracy was crucial (15). GA and SPA were chosen as efficient wavelength selection methods for improving the PLS model.

Figure 1: Chlorophyll content measurement to select the location
Materials and Methods
Gannan navel orange leaves covering every stage of growth period from 20 navel orange trees were obtained from an orchard in Jian county, Ganzhou city, Jiangxi province, China. The first batch of 58 samples was collected on October 5, 2012, and the second batch of 78 samples was collected on November 1, 2012. Orange chlorophyll content was measured using a SPAD-502Plus chlorophyll meter (Spectrum Technologies, Inc.). The value provided by the meter indicates the relative content of chlorophyll in the leaves. The meter can measure the chlorophyll content of leaves within only a small spot, so five points on the leaves were sampled to measure the content in a given region. The average of the five positions was determined to generate the chlorophyll content as shown in Figure 1.

where W is water content, W1 is leaf fresh weight, and W2 is leaf dry weight.
Data Acquisition
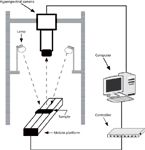
The leaf data were collected by the hyperspectral imaging system as shown in Figure 2, which consists of a line-scan spectrograph (ImSpecter, V10E, Spectra Imaging Ltd.), a charge-coupled device (CCD) camera (Hamamatsu, C8484-05G), two halogen lamps (20 W, Osram), and a precision sample stage with a motion controller. The working distance of the hyperspectral lens to the displacement platform was 50 cm, and the light source was 65 cm above the samples. The angles of the two lamps were adjusted to ensure the light source was centered on the stage and to obtain a uniform illumination. A black plastic base plate was placed on the stage. To avoid baseline drift, the hyperspectral imaging system was preheated for 30 min. The line-scan spectrograph collected spectral images over a wavelength range of 382–999 nm with a spectral resolution of 2.8 nm. The sample stage was driven by a stepping motor with a user-defined speed 16 mm/s. The exposure time, camera resolution, and spectral sampling interval were set at 20 ms, 1344 × 1024 and 2.44 nm, respectively. Next, 254 wavelengths were sampled to generate a 1344 × 1024 × 254 hyperspectral image cube. The first batch of 58 leaves and the second batch of 78 leaves were measured separately on October 10, 2012, and November 5, 2012.

Figure 2: Hyperspectral imaging system.
The relative reflectance (Rλ) image was obtained by collecting a sample image, a dark image, and a white image, and was processed according to the following equation:

where Iλ is the recorded hyperspectral image, Bλ is the dark image (with 0% reflectance) recorded by turning off the lighting source with the lens of the camera completely closed, and Wλ is the white reference image (PTFE white board with 99% reflectance) (16). The above data collection and correction processes were implemented using software called spectraSENS1.5.
Results
Data Processing and Analysis
The 136 samples were randomly divided into a prediction set (45 samples) and a calibration set (91 samples). Table I shows the properties of the samples used for calibration and prediction of the PLS models for both chlorophyll and water content.

Table I: Descriptive statistics for sample measurement
A square region of interest (ROI) (17) was defined by a 7 × 7 pixels area that overlaps with the region assessed by the chlorophyll meter. The ROI for water content covers the entire leaf. This is shown in Figure 3. The mean relative reflectance for each image was generated by averaging the spectral responses of each pixel in the respective ROI. In total, 136 mean reflectance spectra of chlorophyll and water were separately obtained from 136 samples.

Figure 3: Regions of interest of the orange leaf: (a) chlorophyll, (b)
Wavelength Selection
GA was applied in the spectral analysis to select several intervals and calculate all PLS model combinations of these selected intervals. The average spectrum of ROI was imported Matlab R2010a and the parameters were set as follows: The number of groups was 30, crossover probability was 0.50, compiled probability was 0.01, and the number of iterations was 100, run 100 times independently. Finally, each output the 0–1 binary coded string, calculated wavelength point identification of the probability of "1."

Figure 4: NIR average spectra from all 136 samples of the (a) chlorophyll
Figure 5 shows the frequency of wavelength selection, 13 optimal wavelengths of chlorophyll were 491, 494, 557, 560, 562, 640, 643, 645, 662, 665, 667, 911, and 913 nm. We chose 63 optimal water content wavelengths: 389, 391, 443, 445, 447, 455, 457, 460, 469, 472, 474, 477, 547, 550, 552, 569, 572, 574, 596, 599, 601, 618, 630, 633, 635, 638, 655, 701, 784, 787, 789, 821, 823, 826, 828, 831, 833, 882, 884, 899, 904, 906, 909, 911, 913, 916, 918, 938, 940, 943, 945, 948, 950, 953, 955, 970, 972, 975, 984, 987, 989, 996, and 999 nm.

Figure 5: Selected wavelength using GA: (a) chlorophyll, (b) water
The SPA is a forward selection method, which begins with one wavelength, and then incorporates a new one at each iteration until a specified number N of wavelengths is reached (18). More details on the steps involved in SPA application can be found in previous studies (19–21). The wavelengths selected by the SPA method can be used as the input of the multiple linear regression (MLR), PLS, and other regression algorithms.
The SPA method was used to select informative individual wavelengths among the spectra (Figure 5). We gained eight optimal wavelengths of chlorophyll: 389, 394, 418, 494, 538, 643, 706, and 884 nm. We obtained 14 optimal wavelengths of water content: 384, 406, 450, 545, 596, 660, 677, 694, 738, 789, 828, 893, 950, and 998 nm.

Figure 6: Selected wavelength using SPA: (a) chlorophyll, (b) water content.
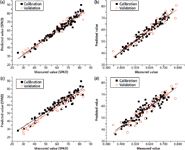
The PLS models were established with the selected wavelengths as shown in Figure 7.

Figure 7: Predicted values with PLS models: (a) chlorophyll-GA-PLS, (b) water-GA-PLS, (c) chlorophyll-SPA-PLS, (d) water-SPA-PLS.
Table II shows the number of variables used in each model. The percentage of wavelengths used to develop the chlorophyll-GA-PLS, chlorophyll-SPA-PLS, water-GA-PLS, and water-SPA-PLS models were 5.12%, 3.15%, 24.8%, and 5.51%, respectively. The PLS method is also relatively complex because of its complex algorithm (22). The accuracy of GA-PLS models was higher than SPA-PLS models, but the GA-PLS models used more wavelengths. GA-PLS was considered sufficiently suitable for the prediction of chlorophyll and water content in Gannan navel orange leaves.

Table II: Results of model predictions based on different algorithms
Conclusions
Hyperspectral imaging was successfully utilized for the simultaneous detection of chlorophyll and water content in Gannan navel orange leaves. Two wavelength selection methods, GA-PLS and SPA-PLS, were compared. The appropriate selection of wavelengths can enhance the performance of a model. GA-PLS provided better performance than SPA-PLS. GA-PLS was developed with a large number of wavelengths (5.12% and 24.8% of the total number of wavelengths), which makes it relatively more complex compared to SPA-PLS (which only used 3.15% and 5.51% of the total number of wavelengths). However, the GA-PLS approach provided a better prediction accuracy, so it is better suited for industrial application.
References
(1) X.B. Zou, J.W. Zhao, and H.P. Mao, Appl. Spectros. 64, 786–794 (2010).
(2) S. Meyns, R. Illi, and B. Ribi, Archiv für Hydrobiologie 132, 129–139 (1994).
(3) C. Wu et al., Int. J. Remote Sensing 31(9), 2309–2324 (2010).
(4) E. Hege et al., Proc. SPIE5159, 380–391 (2003).
(5) S. Monteiro et al., ISPRS J. Photogrammetry and Remote Sensing 62, 2–12 (2007).
(6) R. Lyon et al., AAPS Pharm Sci. Tech. 3, 17 (2002).
(7) D. Ferris et al., J. Lower Genital Tract Dis. 5, 5–72 (2001).
(8) X. Zou et al., Chemom. Intell. Lab. Syst. 104, 365–270 (2010).
(9) E.R. Hunt and B.N. Rock, Remote Sensing of Environment 30, 43–54 (1989).
(10) F.M. Danson, M.D. Steven, T.J. Malthus, and J.A. Clark, Int. J. Remote Sensing 13, 461–470 (1992).
(11) A.S. Bangalore, R.E. Shaffer, and G.W. Small, Anal. Chem. 68, 4200–4212 (1996).
(12) J. Koljonen, T.E.M. Nordling, and J.T. Alander, J. Near Infrared Spectrosc. 16(3), 189–197 (2008).
(13) N. Sorol, E. Arancibia, S.A. Bortolato, and A.C. Olivieri, Chemom. Intell. Lab. Syst. 102, 100–109 (2010).
(14) B. Chen, X.L. Meng, and H. Wang, J. Inst. Anal. 26(1), 66–69 (2007) (in Chinese).
(15) C.M. Andersen and R. Bro, J. Chemom. 24, 728–737 (2010).
(16) G.K. Naganathan, L.M. Grimes, J. Subbiah, C.R. Calkins, A. Samal, and G.E. Meyer, Comput. Electron. Agric. 64, 225–233 (2008).
(17) Y. Uno, S.O. Prasher, R. Lacroix, P.K. Goel, Y. Karimi, A. Viau, and R.M. Patel, Comput. Electron. Agric. 47, 149–161 (2005).
(18) M.C.U. Araújo, T.C.B. Saldanha, R.K.H. Galvão, T. Yoneyama, H.C. Chame, and V. Visani, Chemom. Intell. Lab. Syst. 57(2), 65–73 (2001).
(19) R.K.H. Galvao et al., Chemom. Intell. Lab. Syst. 92, 83–91 (2008).
(20) R.K.H. Galvao, M.F. Pimentel, M.C.U. Araújo, T. Yoneyama, and V. Visani, Anal. Chim. Acta 443(1), 107–115 (2001).
(21) N. Goudarzi and M. Goodarzi, Anal. Methods 2, 758–764 (2010).
(22) M. Min and W.S. Lee, Transaction of ASAE 48, 455-461 (2005).
Yande Liu and Guang-Wei Zhang are with the Institute of Mechanical and Electrical Machinery Technology and Application Research at East China Jiaotong University in Nanchan, China. Deli Liu is with the Agriculture and Food Bureau in Xingguo Jiangxi, China. Direct correspondence to: 373241281@qq.com

Geographical Traceability of Millet by Mid-Infrared Spectroscopy and Feature Extraction
February 13th 2025The study developed an effective mid-infrared spectroscopic identification model, combining principal component analysis (PCA) and support vector machine (SVM), to accurately determine the geographical origin of five types of millet with a recognition accuracy of up to 99.2% for the training set and 98.3% for the prediction set.
2 Commerce Drive
Cranbury, NJ 08512
All rights reserved.