Terahertz Spectral Characterization of Plasma Spray–Deposited Nickel Film on an Alumina Cylinder
Plasma spray–deposited metal films are of interest for many industrial applications. Four samples of spray-deposited nickel layers on an alumina layer were examined by high resolution terahertz time-domain spectroscopy (THz-TDS). The absorbance spectra of these samples reveal that all samples exhibited absorption peaks at approximately 6 and 8 THz. These absorbance peaks are consistent with those reported for nickel-based dilute alloys (Ni > 98%). Analysis of the absorbance spectra for all samples from 1 cm-1 to 300 cm-1 reveal a systematic shift in absorbance peak frequency of the samples. Because these samples were fabricated by a spray-deposition technique, some lattice dilation occurred because of hydrogen embrittlement. The shift in absorbance peaks occurred because of the lattice dilation of the same samples. Observed absorbance peaks at 403 cm-1, 720 cm-1, and 898 cm-1, for samples HHT-111, HHT-129, HHT-81, respectively, are a close match for nickel oxide (NiO) phonon excitation modes. The peaks support the hypothesis of excess energy generation via nonradiative phonon excitation because of lattice vibration at elevated temperatures under a radio frequency (RF) field.
Plasma spray–deposition of metal films are of interest for many industrial applications. Here, the combined operations of particle melting, quenching, and consolidation are carried out in a single process. Brillouin Energy Corporation has developed a uniquely fabricated, hydrogen gas–based reactor, referred to as a “hydrogen hot tube” (HHT). These reactors can generate controlled heat energy on demand for potential industrially useful applications. Details of the experimental arrangement are given in the literature (1). In this case, a plasma-sprayed nickel film on a ceramic layer plays a crucial role for the reported excess energy generation.
The concept of excess energy generation continues to evolve. A report from Brillouin (1) summarizes the origin from a comparison of the time-integrated electrical power input to the time-integrated calorimetric thermal power output. When the thermal output exceeds the electrical input, the presumption is that the excess energy is generated from something other than chemical, electrical, mechanical, or morphological mechanisms. This assumption stems from many reports in the field where the integrated excess power is one or more orders of magnitude greater than what can be sourced from those mechanisms cited above. The controlled electron capture hypothesis proposes a mechanism that can explain the excess energy. The scope of this paper does not include the detail analysis of any of those possibilities and may be addressed in a future study.
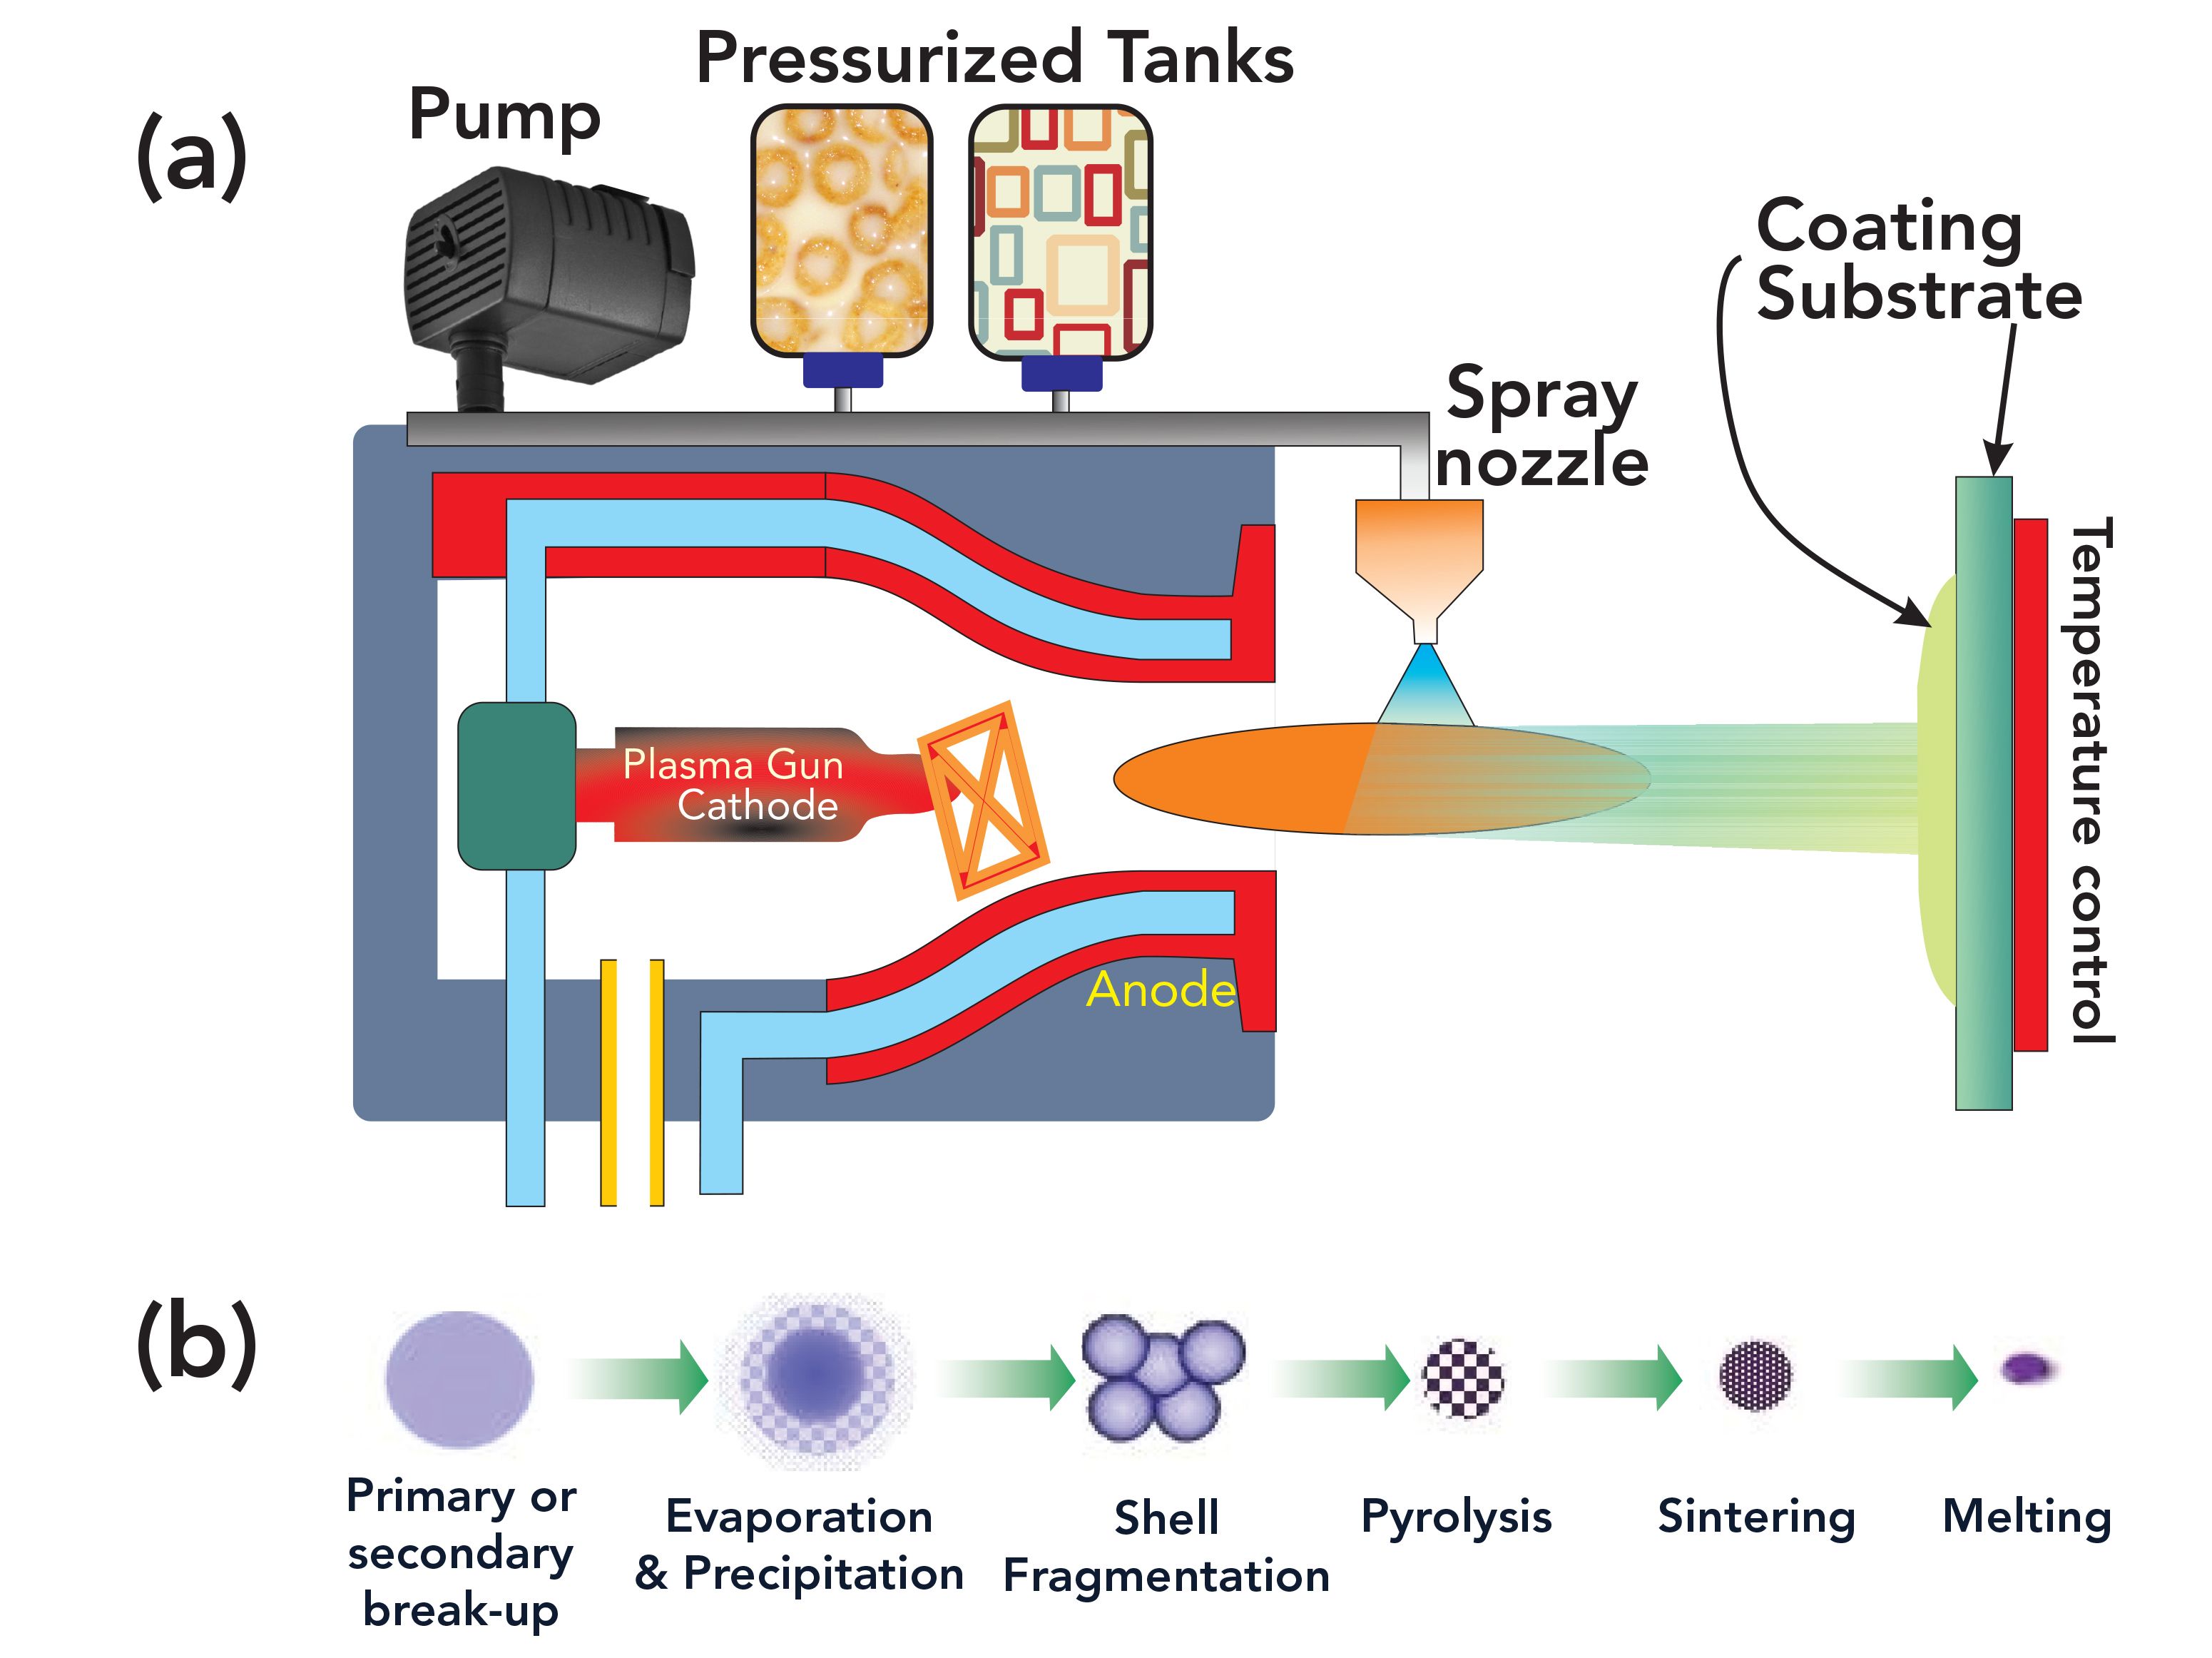
The plasma spray process involves the injection of powder particles (such as metallic, ceramic, or cermet powders) into the plasma jet created by heating an inert gas in an electric arc confined within a water-cooled nozzle, as seen in Figure 1. The final properties of the resulting film may be uniquely studied by spectral analysis. Terahertz spectroscopy provides the highest sensitivity analyses of the absorbance characteristics of the material, because terahertz radiation (T-ray) is sensitive to a wide range of resonances present in a material (2,3).
FIGURE 1: (a) Main components of a plasma spray–deposition system, and (b) process flow for deposition.
Recently, we reported on the lattice dilation of plasma sprayed nickel films via terahertz imaging (4) that overcomes the Abbe diffraction limit for the generation of high-resolution images via the terahertz nanoscanning route. A camera-less terahertz imaging technique was used (4). It was found that the lattice of plasma spray–deposited nickel films was dilated because of hydrogenation during the spraying process. Furthermore, it was found that a systematic dilation also occurred under various experimental stresses. A sample of metallic nickel was also measured in an identical way and served as a calibration of the imaging process.
The lattice dilation is the root cause for hydrogen embrittlement and a nano- to micro-crack formation in metals. This is well-known for steel. The nickel lattice is dilated by virtue of the plasma-spray deposition (5). Plasma-spray deposition is a very well-controlled process and reproducible. Thus, we assume that the lattice dilation should also be controllable, as mentioned in the literature (5). Because the HHT experiments are done under an applied radio frequency (RF) field, the nickel lattice is subjected to simultaneous lattice dilation and time variation. This fits the definition of time-crystal-like nonequilibrium (5).
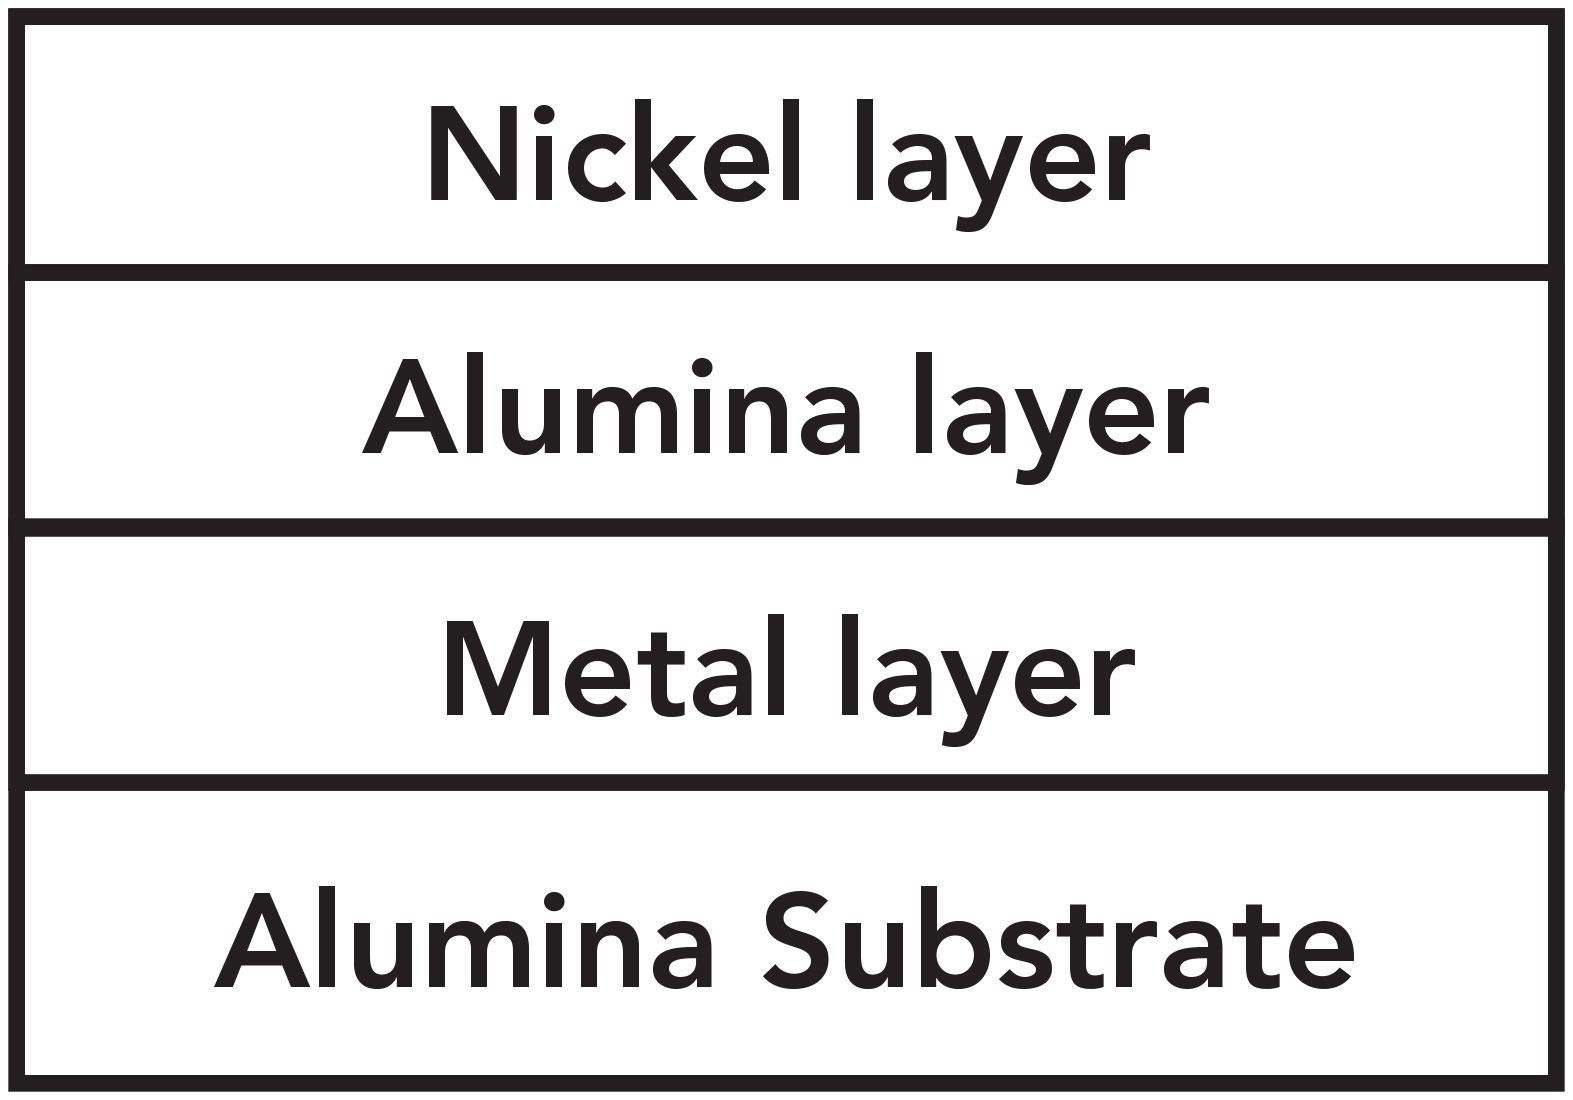
In this paper, we report terahertz spectroscopic analyses of HHT samples (5). Unlike the lattice imaging reported earlier (5), we describe here the terahertz spectral analysis of specific nickel layers for four HHT samples. The principle of terahertz time-domain spectroscopy is outlined below. Figure 1 depicts the main components of a plasma spray–deposition system as well as the process flow from the beginning to the final deposition. Here, a sequential spray-deposition of the layers was used, as indicated in Figure 2. Although deposition and operation take place under reducing conditions, subsequent exposure to air can lead to nickel oxide formation for the surface layer. The possibility of nickel oxide (NiO) formation was deduced from the terahertz absorbance spectra.
FIGURE 2: A planarized sketch of the HHT tube sample.
Terahertz Time-Domain Spectroscopy
Specific details concerning electro-optic dendrimer based terahertz time-domain spectroscopy principles and applications have been described extensively (2,3). This new mechanism of terahertz generation is referred to as dendrimer dipole excitation (6). The interaction of terahertz radiation (T-ray) with molecules excite a wide range of resonances present in a given sample. These resonances may occur from molecular vibrations, rotations, translations, torsions, or conformations. As such, the T-ray photons are affected by the interaction with the molecular matrix, which is determined by a specific resonance. Therefore, quantification of such an interaction may be used for identifying the physical properties of the sample because the observed change in energy or frequency reveals important information concerning the nature of the interaction. Infrared and Raman spectroscopy may yield similar information but are unable to detect many resonance states, which may be possible using terahertz spectroscopy. Terahertz photons are uniquely sensitive to the vibrational states of the entire molecule as opposed to a specific bond or charge state. All materials may be considered as a matrix consisting of atoms and molecules. Molecular simulation, especially molecular dynamics (7), reveals that there are numerous vibrational and conformational states possible when a molecule is not at its lowest energy state. Because most materials remain at their lowest energy state under normal and steady state conditions, T-ray perturbation is expected to access and stimulate possible available states in the low frequency regions. Therefore, the transmitted or reflected T-ray beam will report and communicate unique information about a material being probed. Quantitative predictions of such information is material-specific and best determined by experimental measurements. For example, a T-ray absorbance spectrum of a specific sample will exhibit unique absorption peaks corresponding to a range of resonances present only in that material. As such, the sensitivity of T-ray spectroscopy to the detection of these subtle resonances provides an ultra-sensitive probing technique for characterizing materials, which may be expanded to other materials, such as pharmaceuticals and semiconductors.
Terahertz spectral analysis may be done in more than one way, because there are several different Fourier transform variations available. A common approach is to express the damped signal (material response) in terms of the normalized absorbance in the unit of decibels, dB_norm, where the measured absorption is normalized to 0 for a frequency channel with maximum power. Other parameters may also be computed from the same measured data via the software package included in the TNS3DI instrument used in this study. Available parameters (plots and data) include: the real and imaginary parts of the Fourier spectrum, with its magnitude defined by √Re2 + Im2; and the dual plot of magnitude and phase; and amplitude, which is defined by 2(√Re2+Im2 )/n), where n is the total number of points, and the power spectral density is calculated from the amplitude sum squared. These options allow us a suitable parameter description to be utilized for each different need. For this study, the spectra are analyzed in terms of frequency (Hz) and wavenumber (1/cm) for the interpretation of the absorbance peaks of the present material system.
Experimental
Four HHT tubular samples were obtained and designated as HHT-77, HHT-81, HHT- 129, and HHT-111. All samples were manufactured by sequentially plasma-spraying the respective layers on an alumina tube, as depicted in Figure 2. Sample HHT-77 is as the manufactured sample, with no HHT experiment being performed on it. Samples HHT-81 and HHT-129 were subjected to the HHT experiment and produced higher energy than input, whereas HHT-129 produced even higher energy than HHT- 81. Sample HHT-111 also produced some excess energy but less than both HHT-129 and HHT-81. The plasma-spray deposition of these samples occurred under reducing conditions. However, it is assumed that some oxidation might have occurred on the exposed surface after deposition, which produced NiO on the surface layer, as seen from the spectral analysis.
All samples were polished at a steep oblique angle for exposing the different constituent layers. As shown in Figure 3, the nickel layer on top of the ceramic layer is exposed by polishing at the nickel-ceramic interface. The T-ray beam was focused on the exposed nickel layer next to the ceramic layer.
FIGURE 3: Image of sample-77 (left), and sample-81 (right), after polishing and mounting both on the nanoscanner. The green circle indicates the area of interest for the low-energy nuclear reaction (LENR) effect.
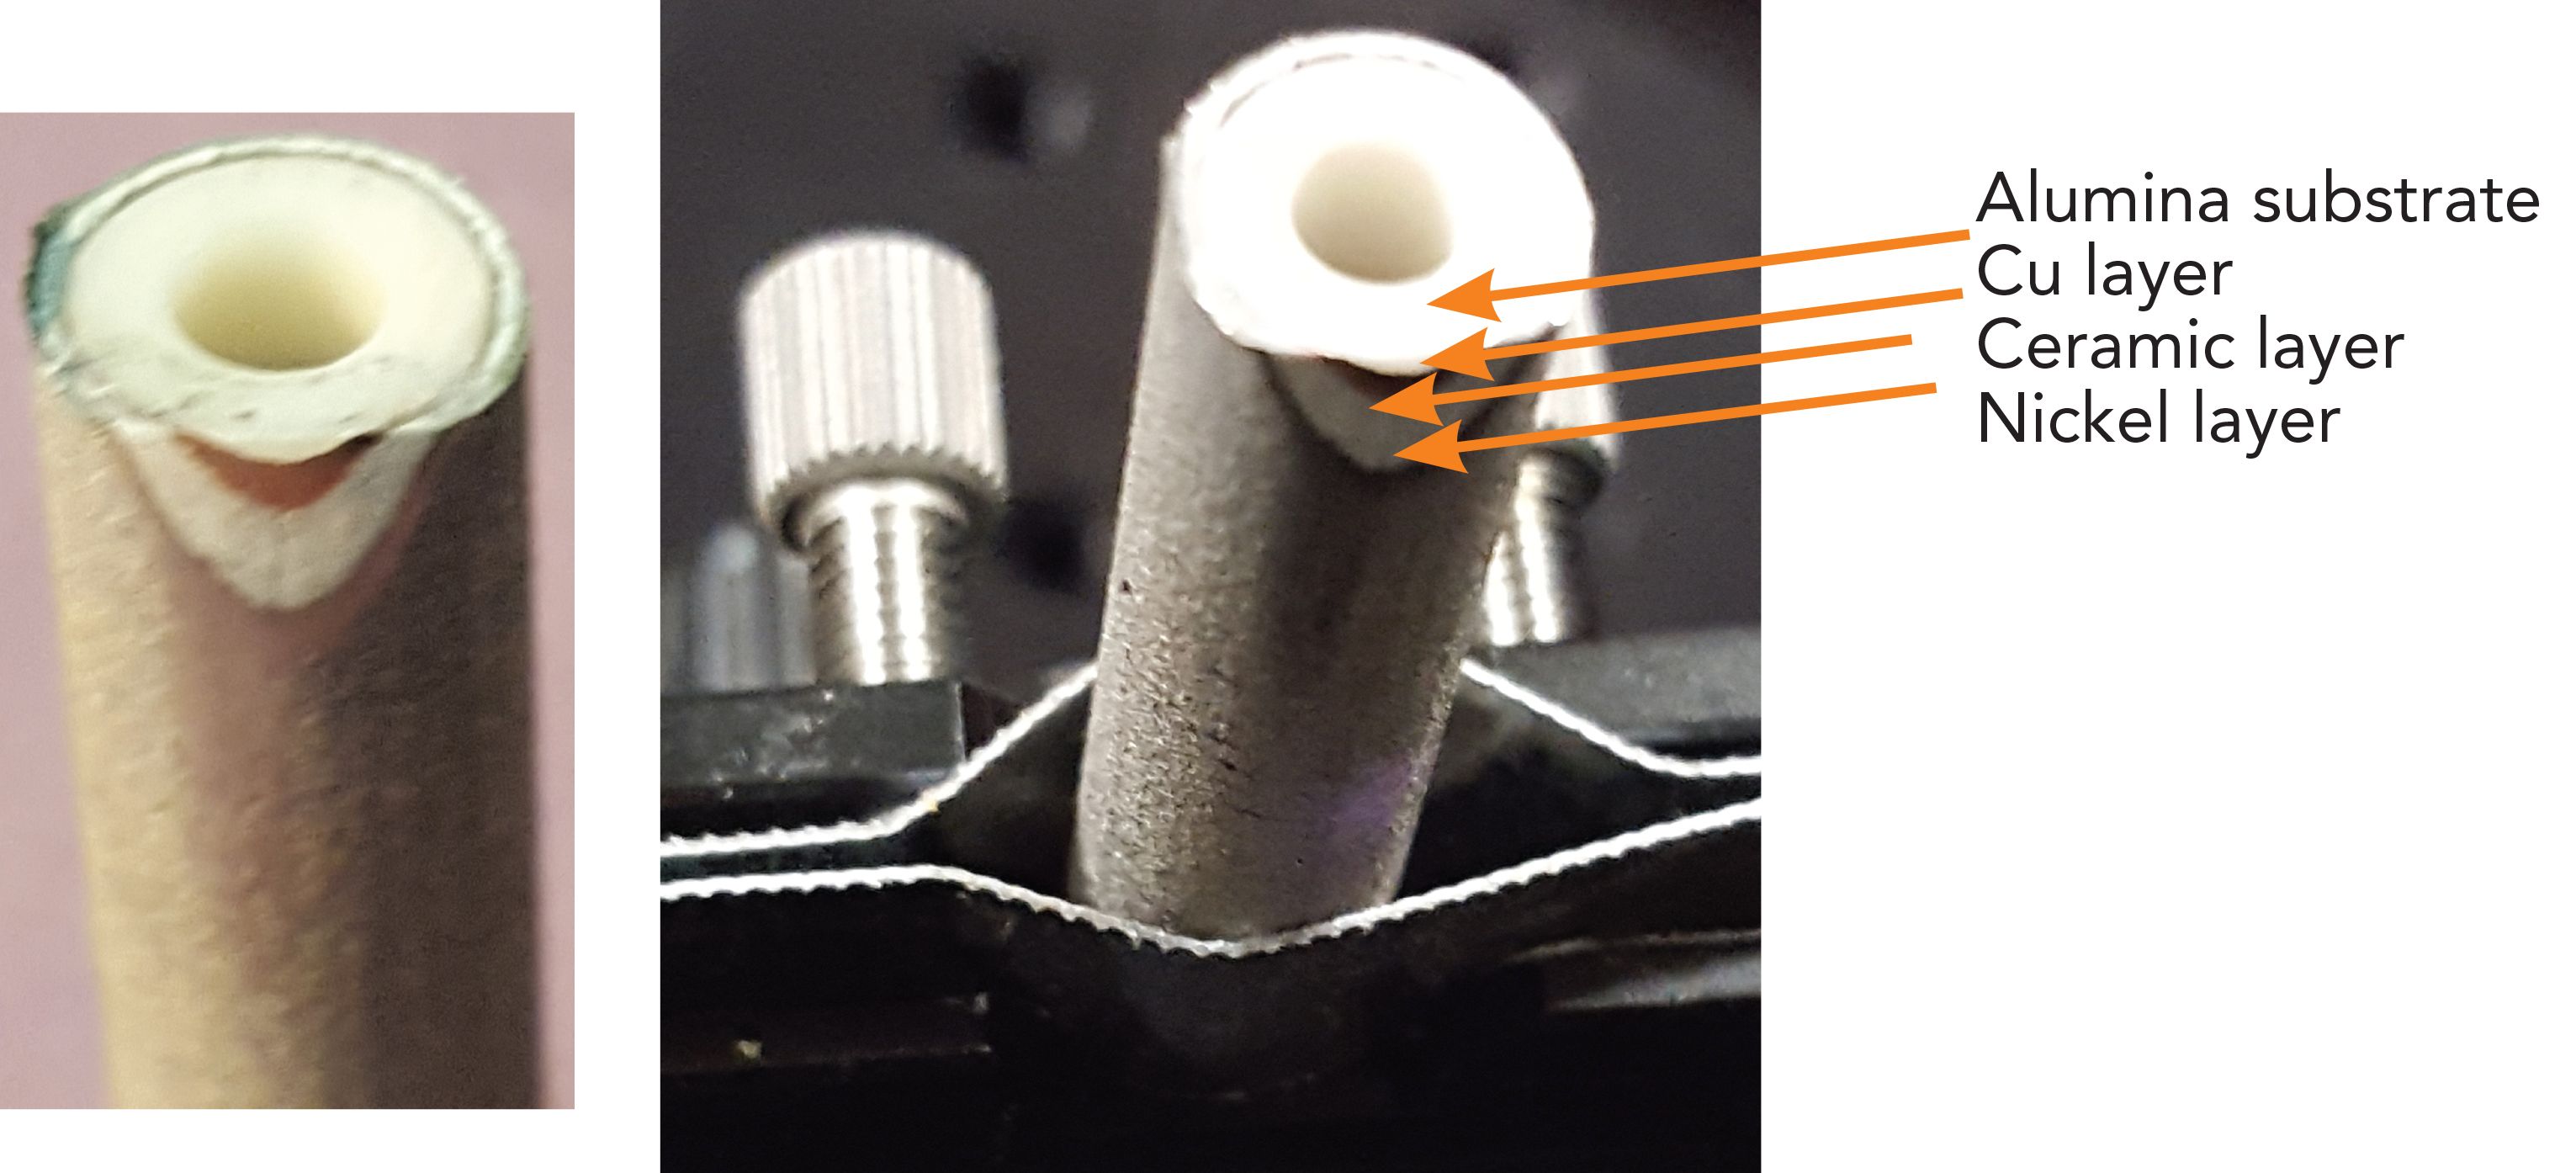
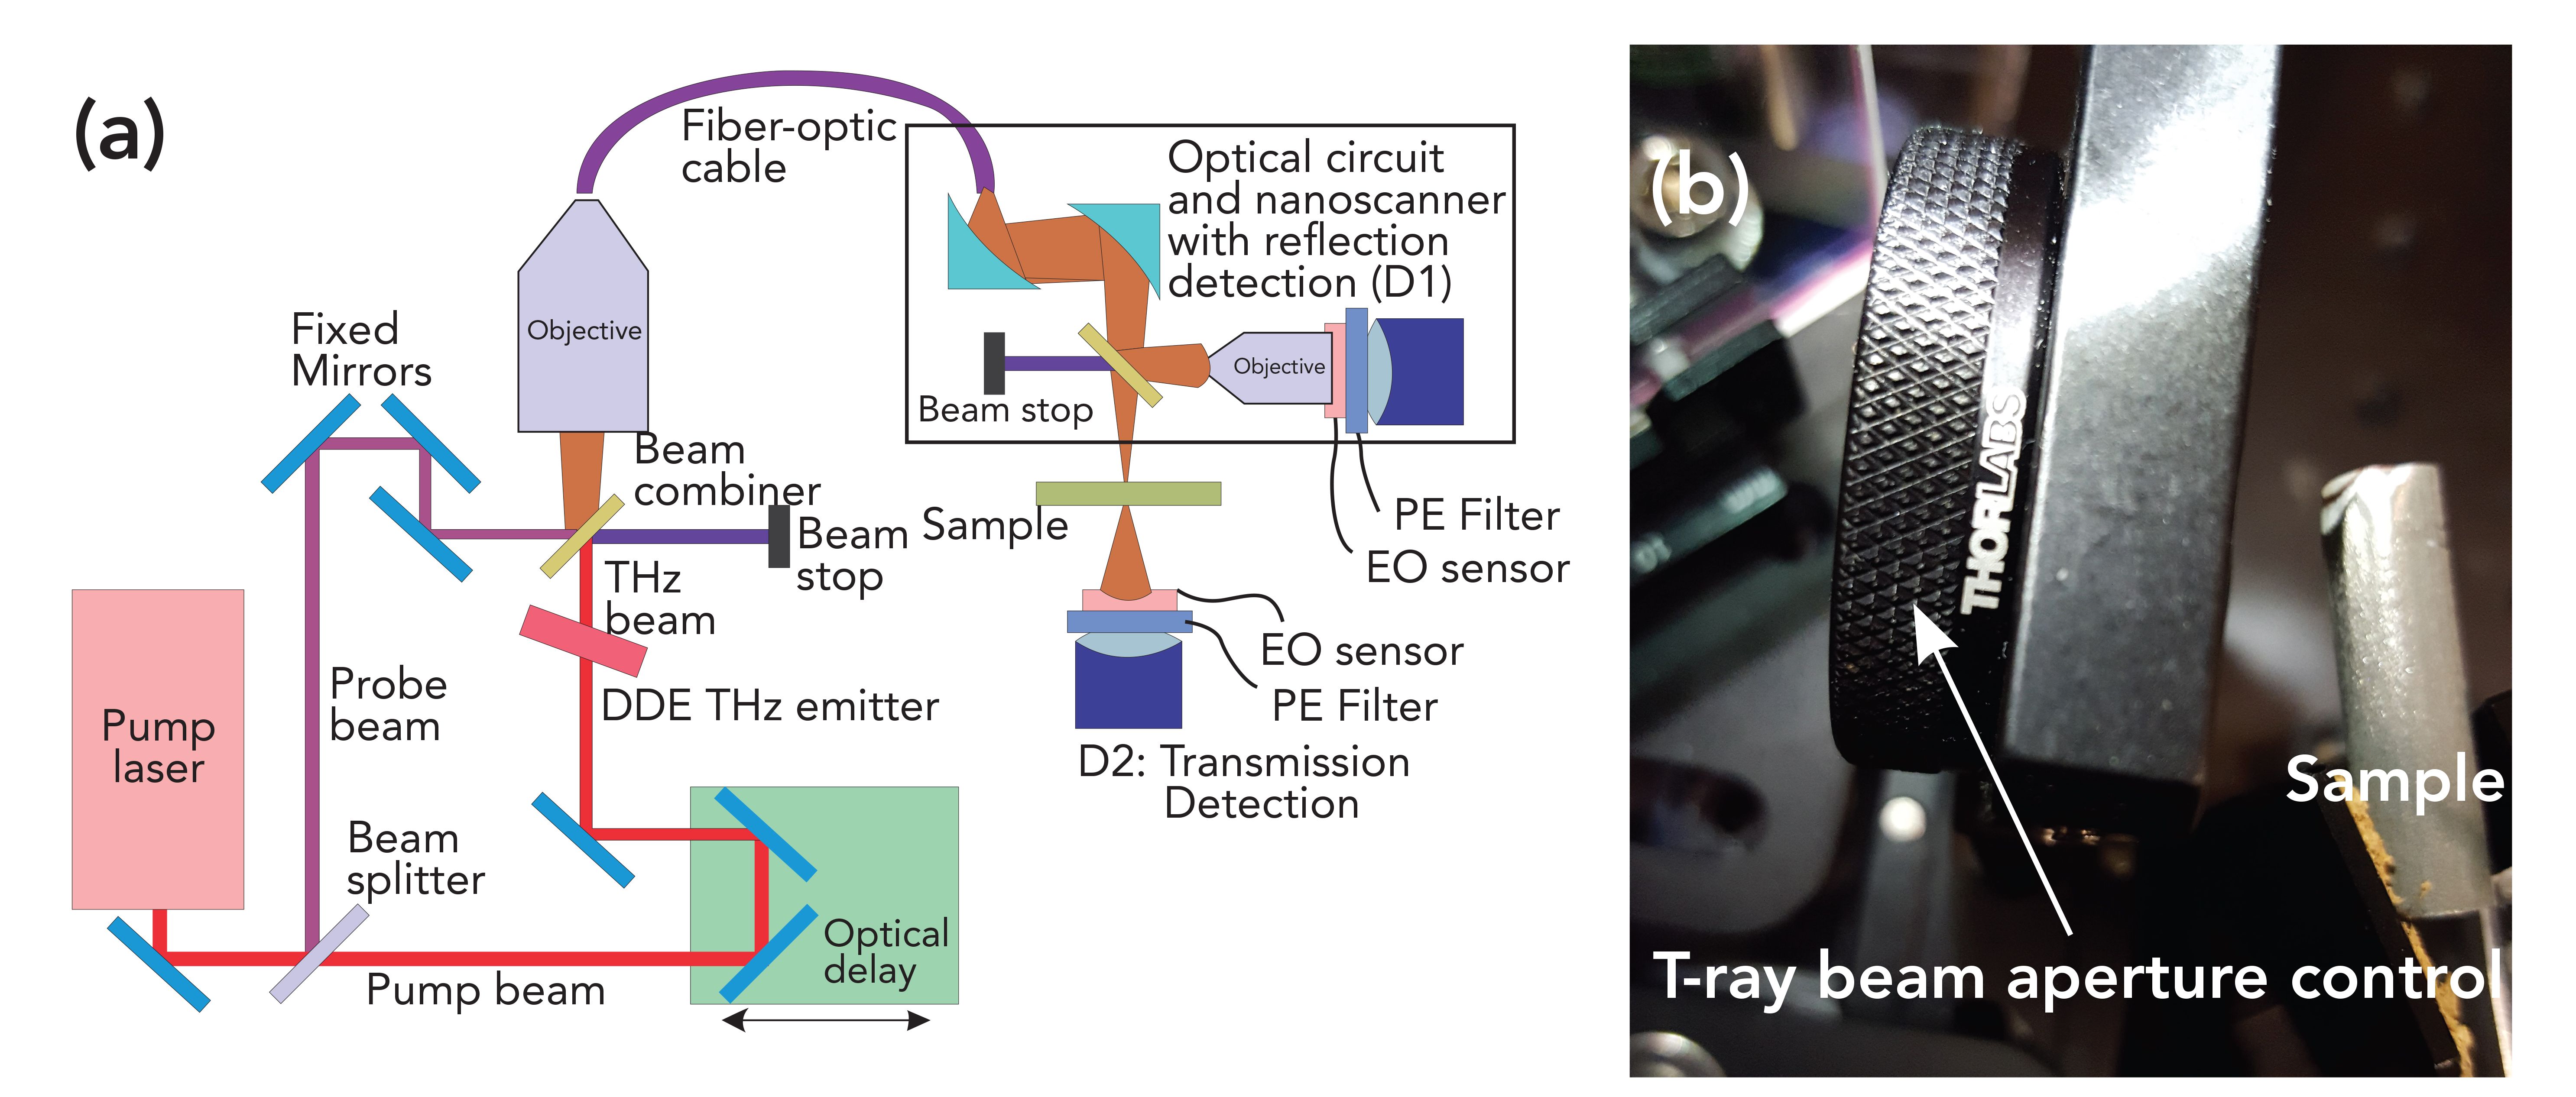
All samples were mounted individually on the terahertz nanoscanning spectrometer and three-dimensional imager (TNS3DI from Applied Research & Photonics) with the help of a special fixture (Figure 3). Figure 4a shows the schematic diagram of the TNS3DI experimental setup whereas Figure 4b exhibits the mounted sample and the beam control aperture of the TNS3DI (7). The nanoscanner was manipulated by the front-end software on all three orthogonal axes to pinpoint an area that is rich in nickel but located near the nickel-ceramic interface (4). Once the correct spot was chosen, the built-in kinematic screws were adjusted for maximum reflection, thereby ensuring a vertical incidence of the T-ray beam on the sample surface (Figure 4). The time-domain terahertz spectral signal (the pump-probe interferogram) was acquired by the built-in front-end software for each sample. Details of the time-domain measurement and terahertz pump-probe technique have been described elsewhere (2,3) and are not repeated here. As indicated before, the TNS3DI uses a dendrimer dipole excitation-based continuous wave terahertz source producing >200 mW of stable power (5), and the detected (damped) signal reflected by the sample gave a measured power of ~2 mW. The detected intensity was recorded in terms of the number of T-ray photons.
FIGURE 4: (a) Experimental layout (adapted from reference [7]), and (b) T-ray beam incidence arrangement on the sample mounted on the nanoscanner.
Four interferograms were acquired for each sample, and the average interferogram was used for subsequent analysis. A special Fourier transform called the Lomb-Scargle periodogram (8) was used to compute the absorbance spectra of each sample. The Lomb-Scargle periodogram is a well-known algorithm for detecting and characterizing periodicity in unevenly sampled time-series. Some details of this algorithm and its implementation are found in the literature (8,9). Since most experimentally collected data in the time-domain are unevenly spaced in time, the Lomb-Scargle periodogram is the most effective way to compute the absorbance frequency spectrum from experimental data. The algorithm defines a second series of evenly spaced abscissa (time) values using a variable offset term in the definition of the power spectral density. This results in an algorithm that is equivalent to the least-squares fitting of sine curves (at specified frequencies) to the data (8). Further detail of the Lomb-Scargle algorithm is outside the main topic of this paper and the readers are encouraged to review the literature for more details (8).
Results
Terahertz absorbance spectra obtained from the aforementioned Lomb-Scargle periodogram analysis are discussed in this section. Figure 5 exhibits the frequency domain absorbance spectra of all four samples corresponding to the nickel rich area over the range of 0.1 THz to ~32 THz. Many distinct absorbance peaks are visible for all samples (Figure 5). Given that the absorbance peaks are well-defined in the spectrum itself, the frequency and the wavenumber value corresponding to chosen peaks were read off the spectrum without the aid of any curve-fitting algorithm. While there are several absorbance peaks visible in Figure 5, the meanings of many of them are not clearly analyzed at this point. However, it was explained elsewhere (2) that many of these peaks are expected to be meaningful. As such, the observation of these additional peaks offers an opportunity for further theoretical and experimental investigations and justifies the emergence of this new branch of THz-TDS.
FIGURE 5: Frequency domain absorbance spectra of all four samples corresponding to the nickel rich area. This gives a broader view of the spectra over 0.1 to ~32 THz. Many distinct absorbance peaks visible for all samples. These peaks are further analyzed in Figure 6.
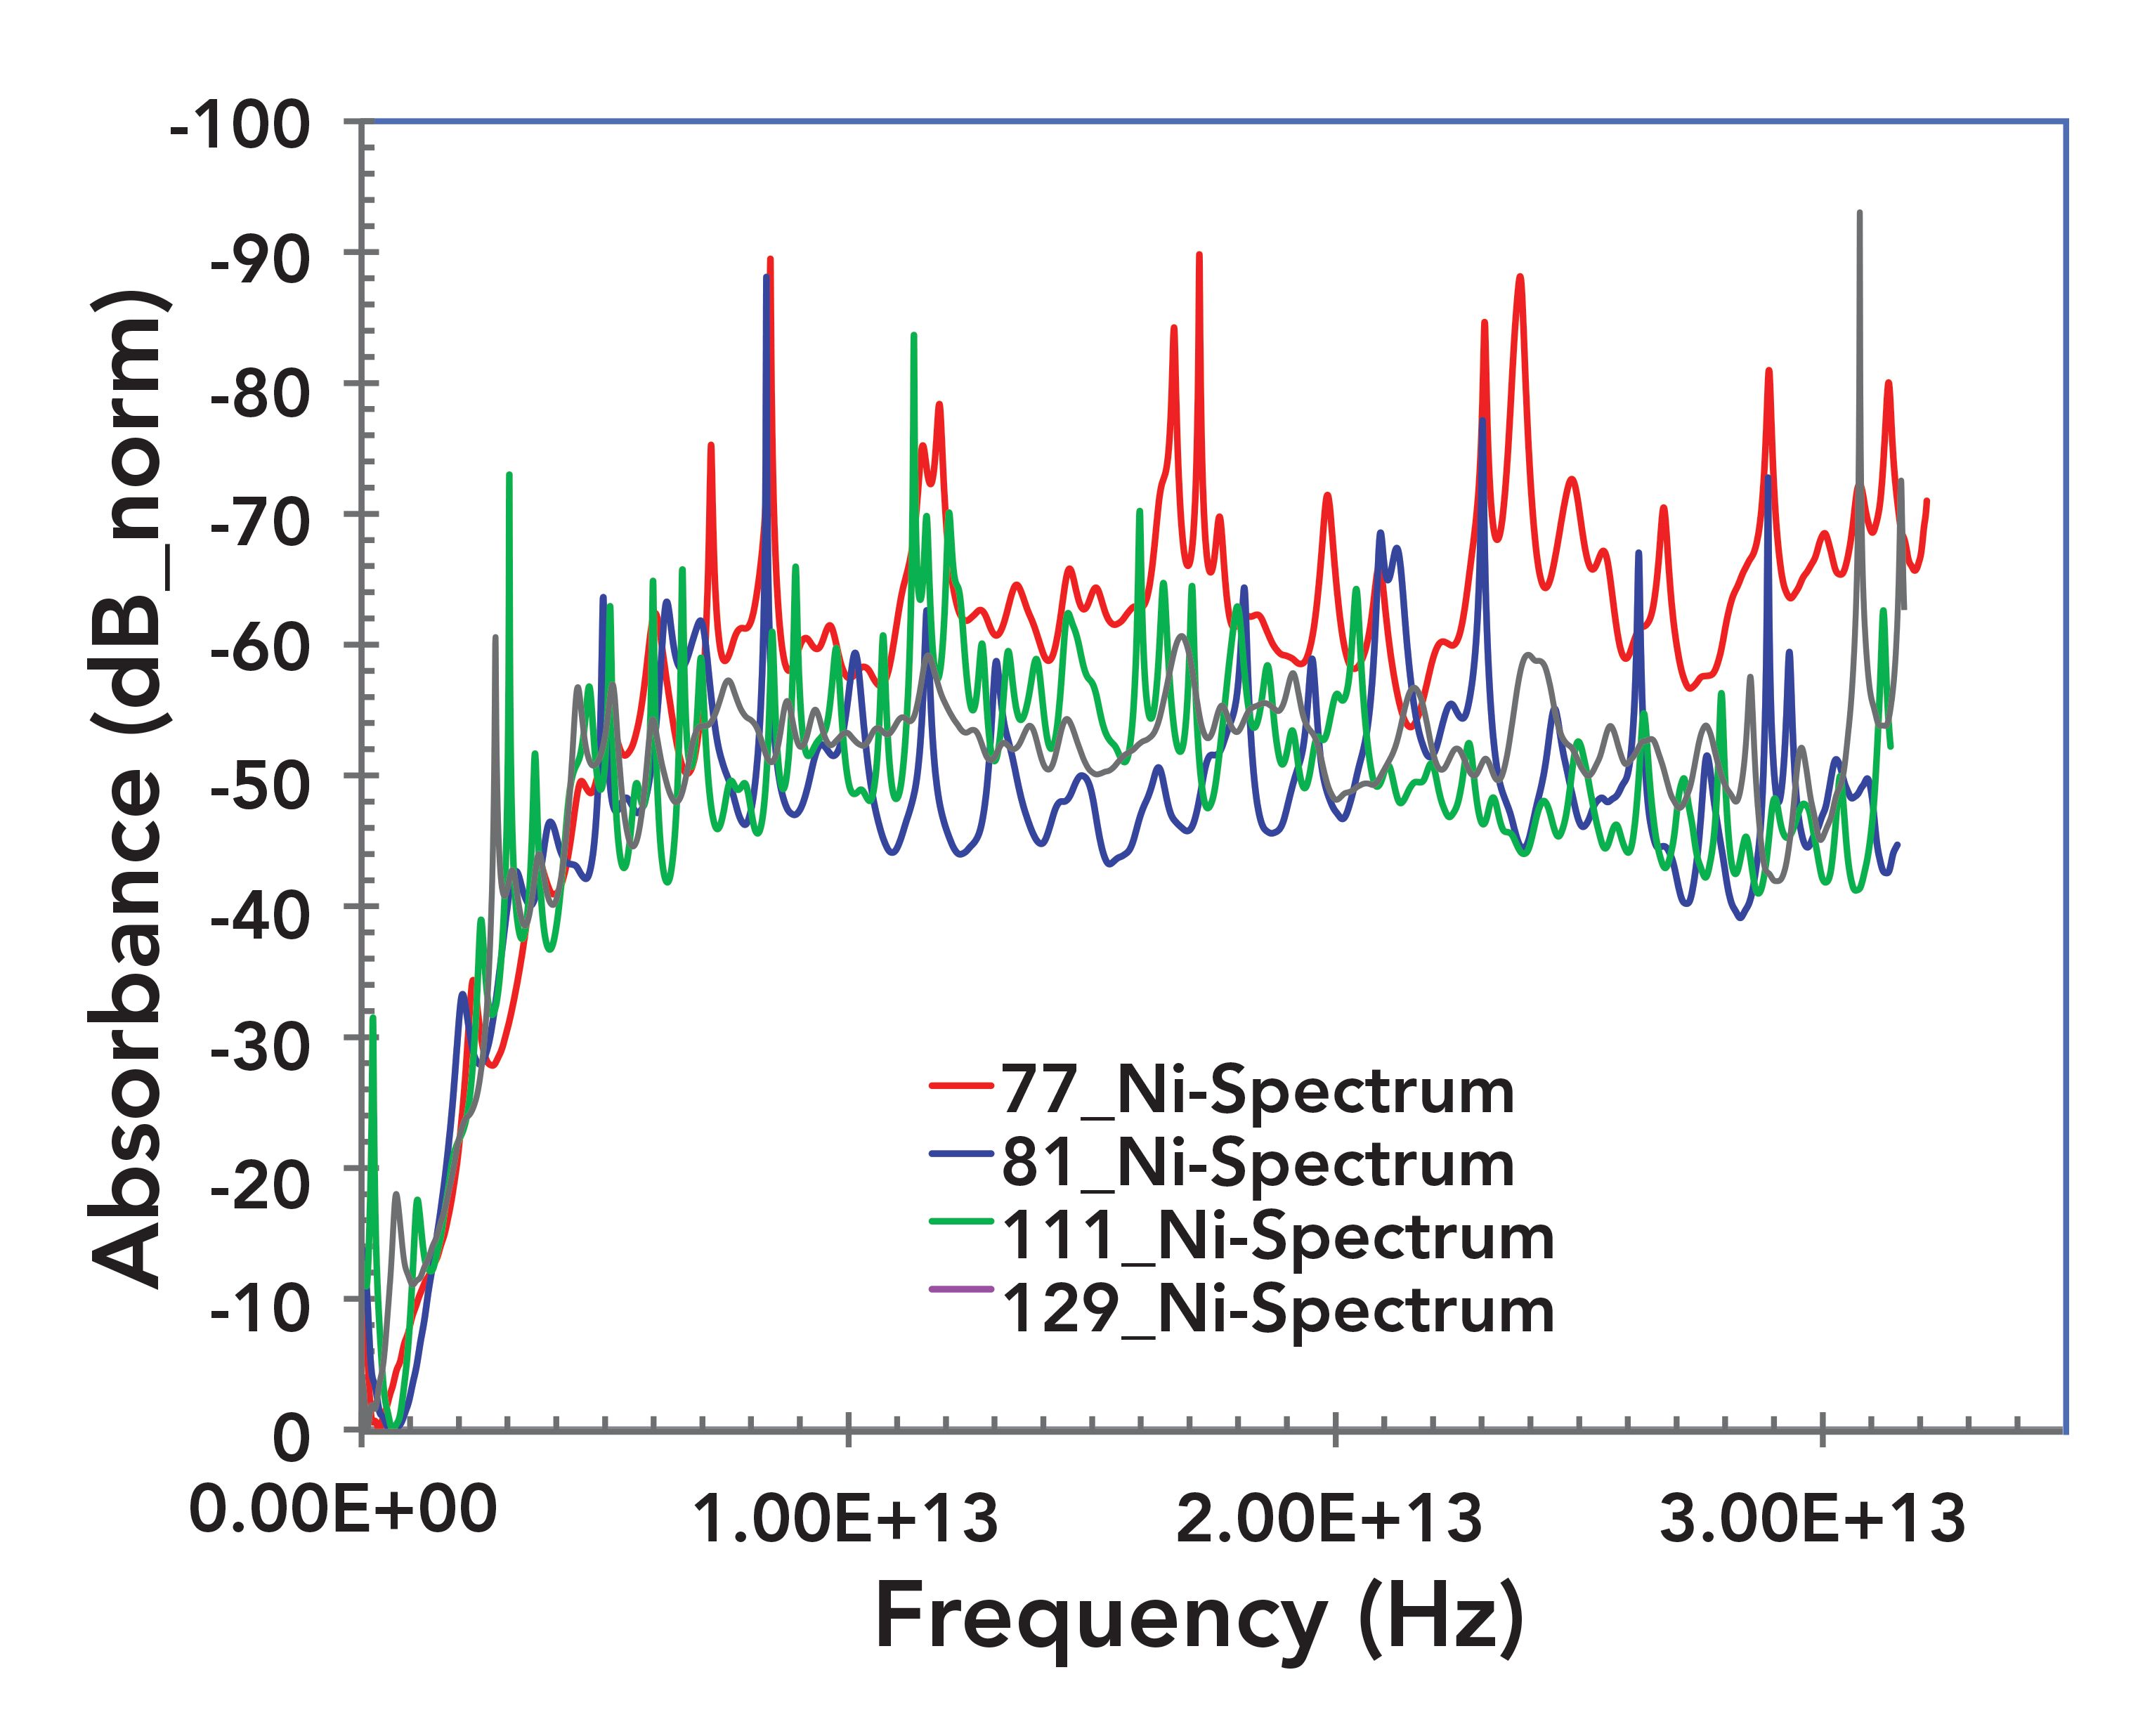
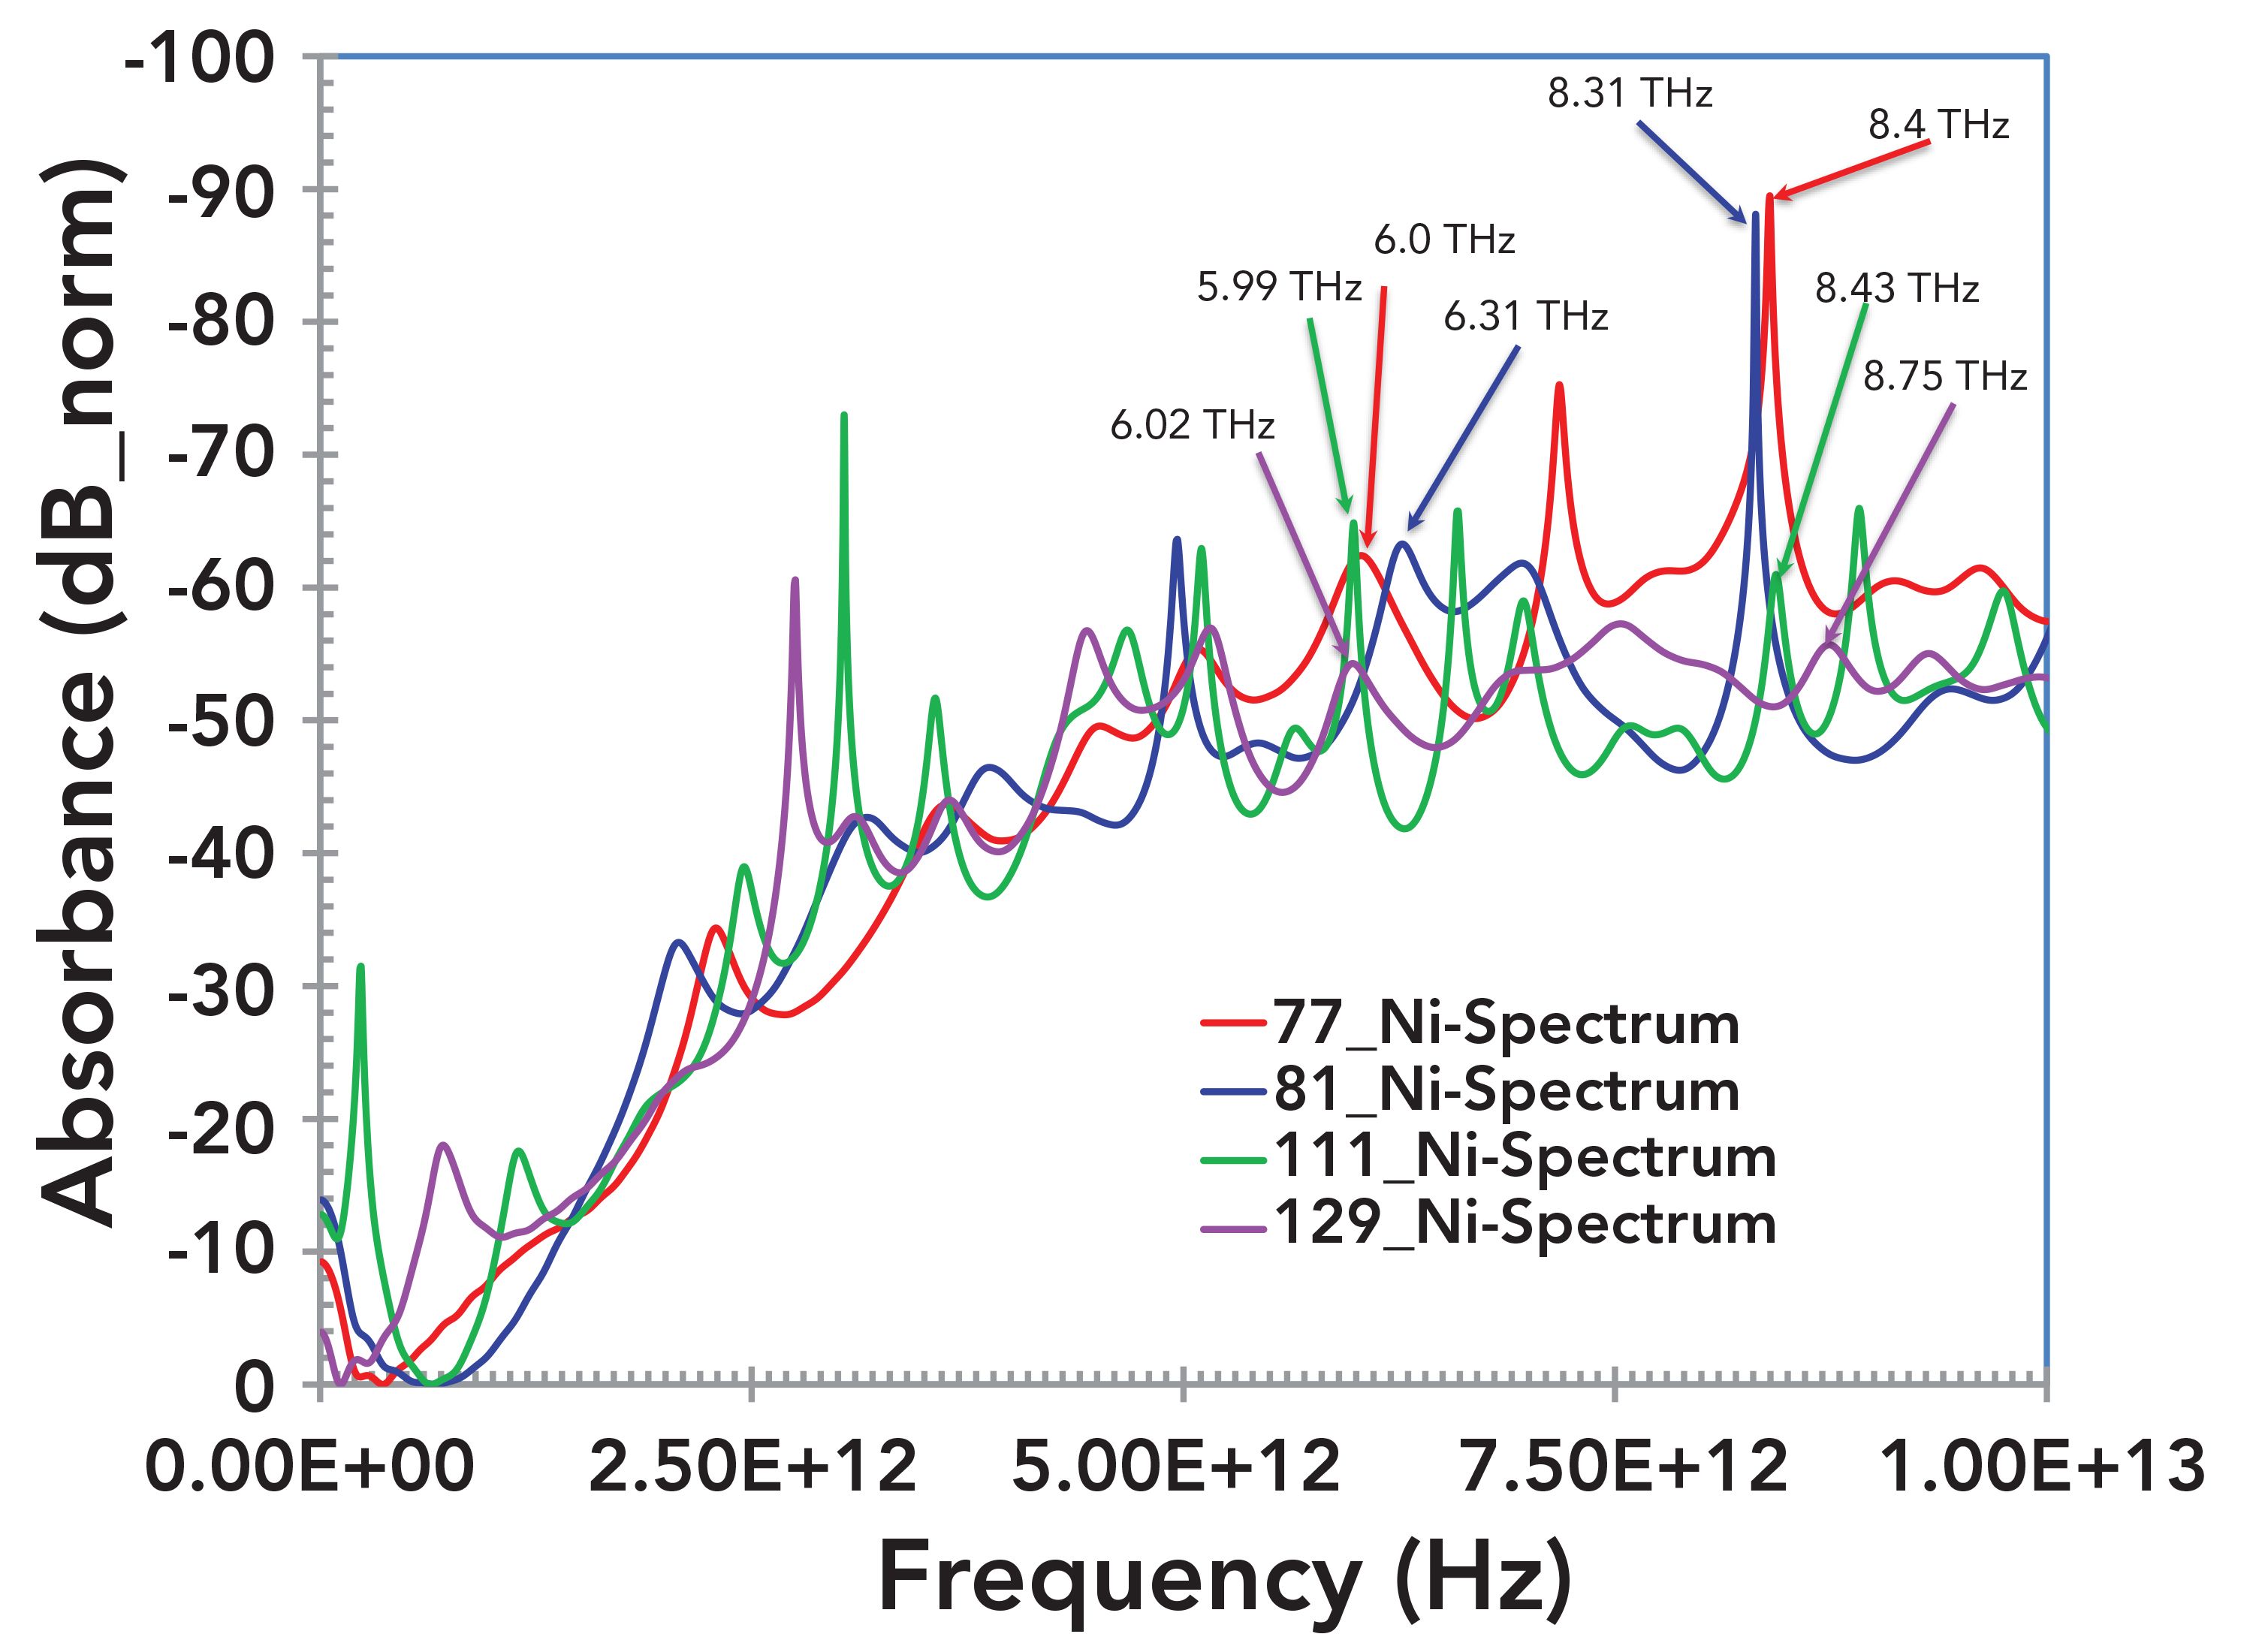
Figure 6 exhibits a closeup of the spectra in Figure 5, where the x-axis was truncated to 10 THz to facilitate the examination of absorbance peaks. It is seen from Figure 6 that all four samples exhibit prominent absorption peaks at or around 6 THz and around 8 THz. The observed absorbance peaks at ~6 THz and ~8 THz are consistent with the observation for nickel based dilute alloys (Ni > 98%) (10), similar to those deposited on these samples. In their work (10), the authors have calculated the real and imaginary parts of the resonance and localized modes. They reported strong resonance for nickel at ~6 THz and ~8 THz. Thus, the observation of the absorbance peaks at ~6 THz and ~8 THz of the present study is assigned to the nickel as expected (10).
FIGURE 6: A closeup of the spectra in Figure 5. The x-axis is truncated to 10 THz to facilitate examination of absorbance peaks. A few peaks are identified for all four samples by the respective characteristic frequencies.
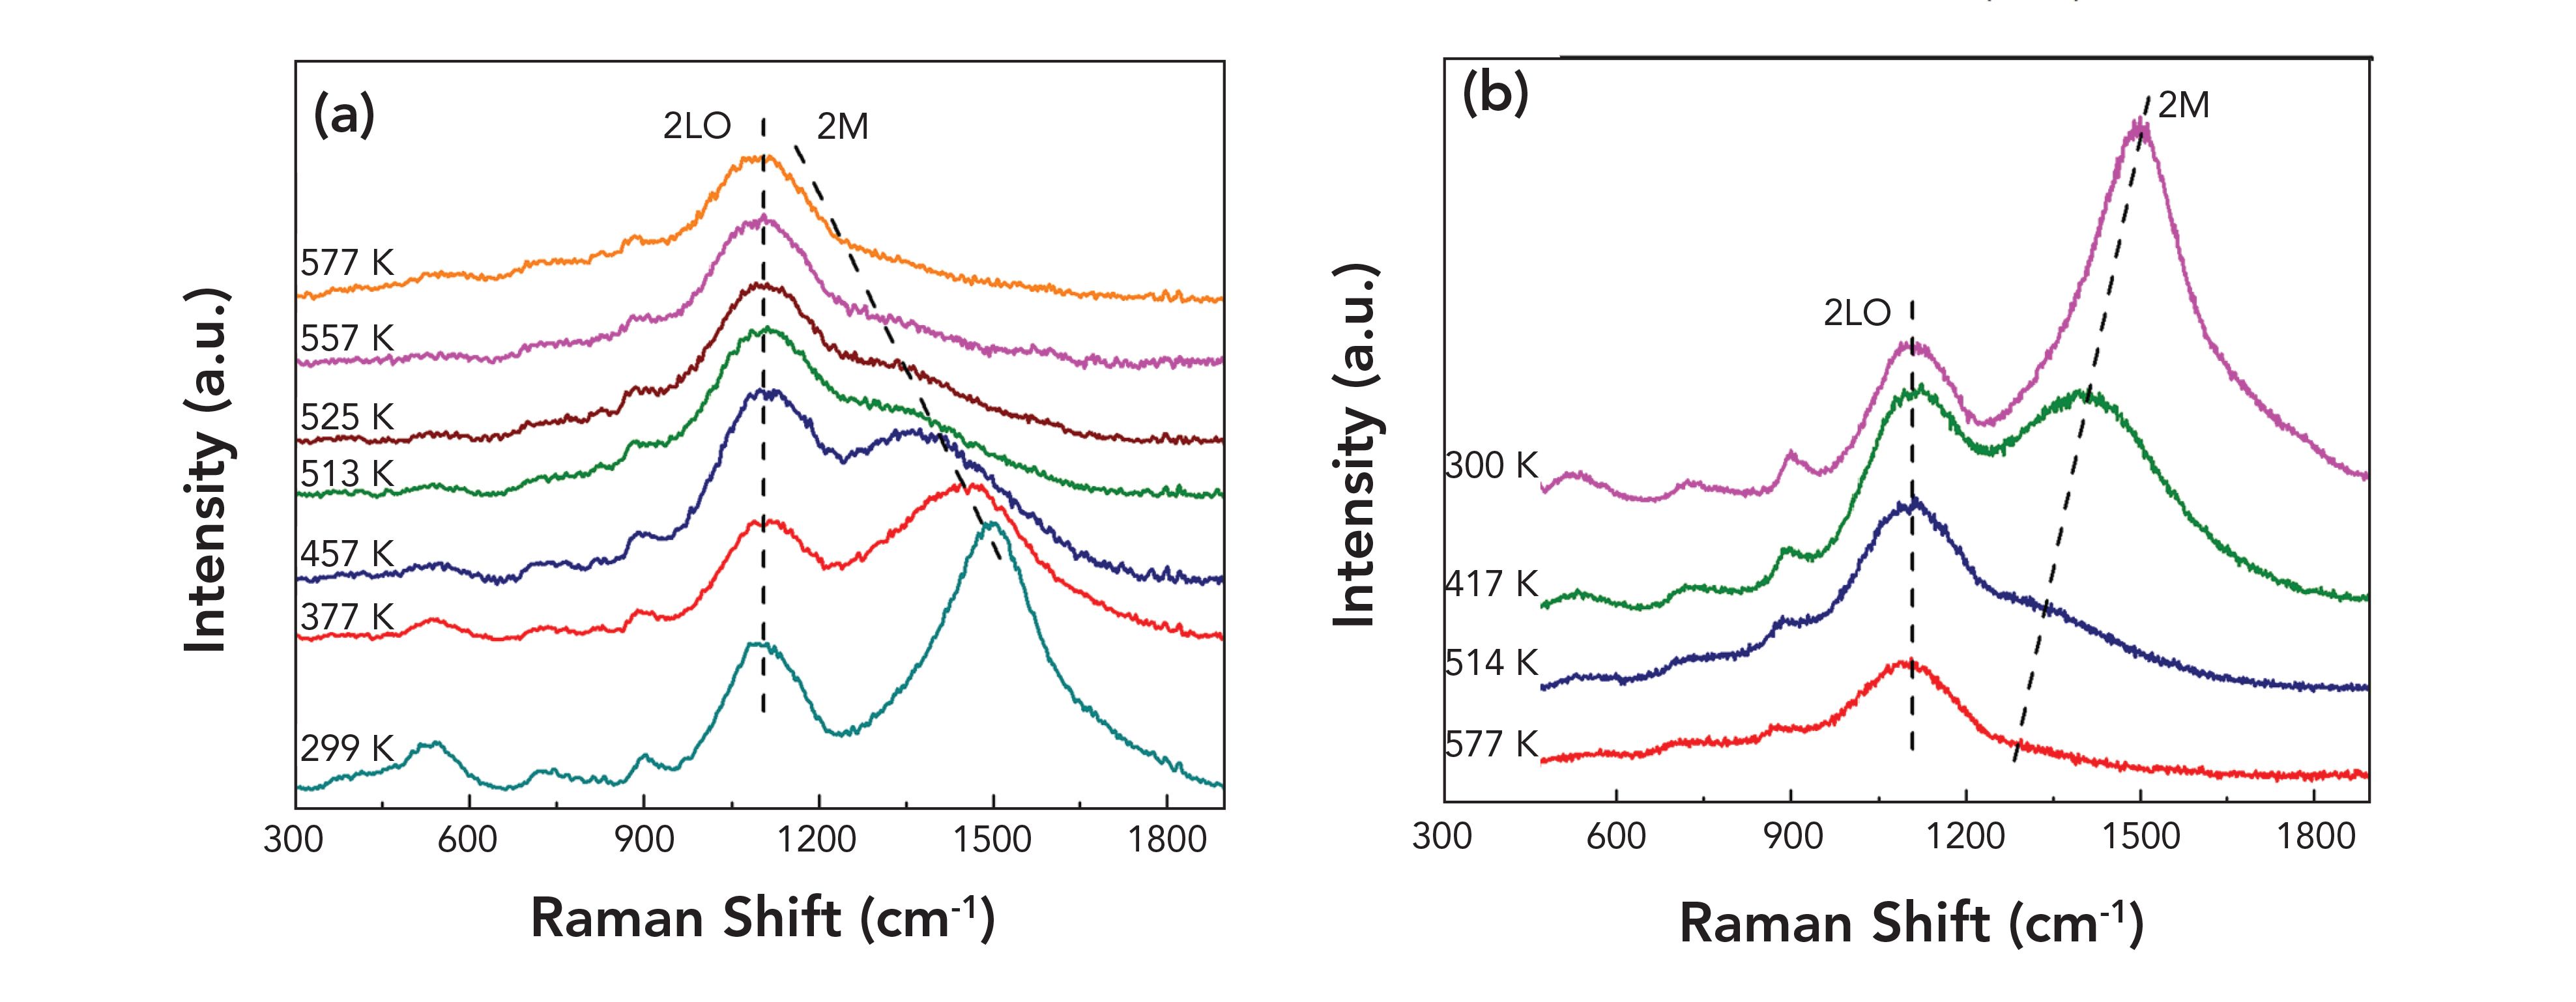
All spectra were also plotted as a function of wavenumbers (1/cm) as shown in Figure 7 for an easier comparison with literature. Figures 8–10 exhibit three different closeups of Figure 7 in terms of wavenumbers. Figure 8 shows a closeup of spectra for all samples from 1 cm-1 to 300 cm-1. Individual spectra are identified for each sample; they exhibit shift in peak frequencies with respect to each other. This systematic shift is consistent with previous observation of the systematic lattice dilation (4). Figure 9 exhibits an absorbance peak at 403 cm-1 for sample HHT-111; this peak has been reported for NiO (11). Similarly, the peaks at 720 cm-1 is observed for sample HHT-129 and 898 cm-1 has been observed for sample HHT-81 (see Figure 10). Both of these peaks are assigned to NiO (11). The literature also indicates that “One can recognize the transverse optical (TO) phonon mode at ~403 cm-1 and the longitudinal optical (LO) phonon mode at ~520 cm-1. The two-phonon excitations observed at ~720 cm-1, 899 cm-1, and 1100 cm-1 correspond to 2TO, TO+LO, and 2LO modes, respectively” (11). Evolution of the Raman spectrum of NiO at different temperatures are adapted from (11) for comparison purposes, see Figure 11.
FIGURE 7: Terahertz absorbance spectra of four samples from the nickel-rich area. These are the same spectra as in Figure 5, plotted as a function of wavenumbers for the ease of comparison with literature.
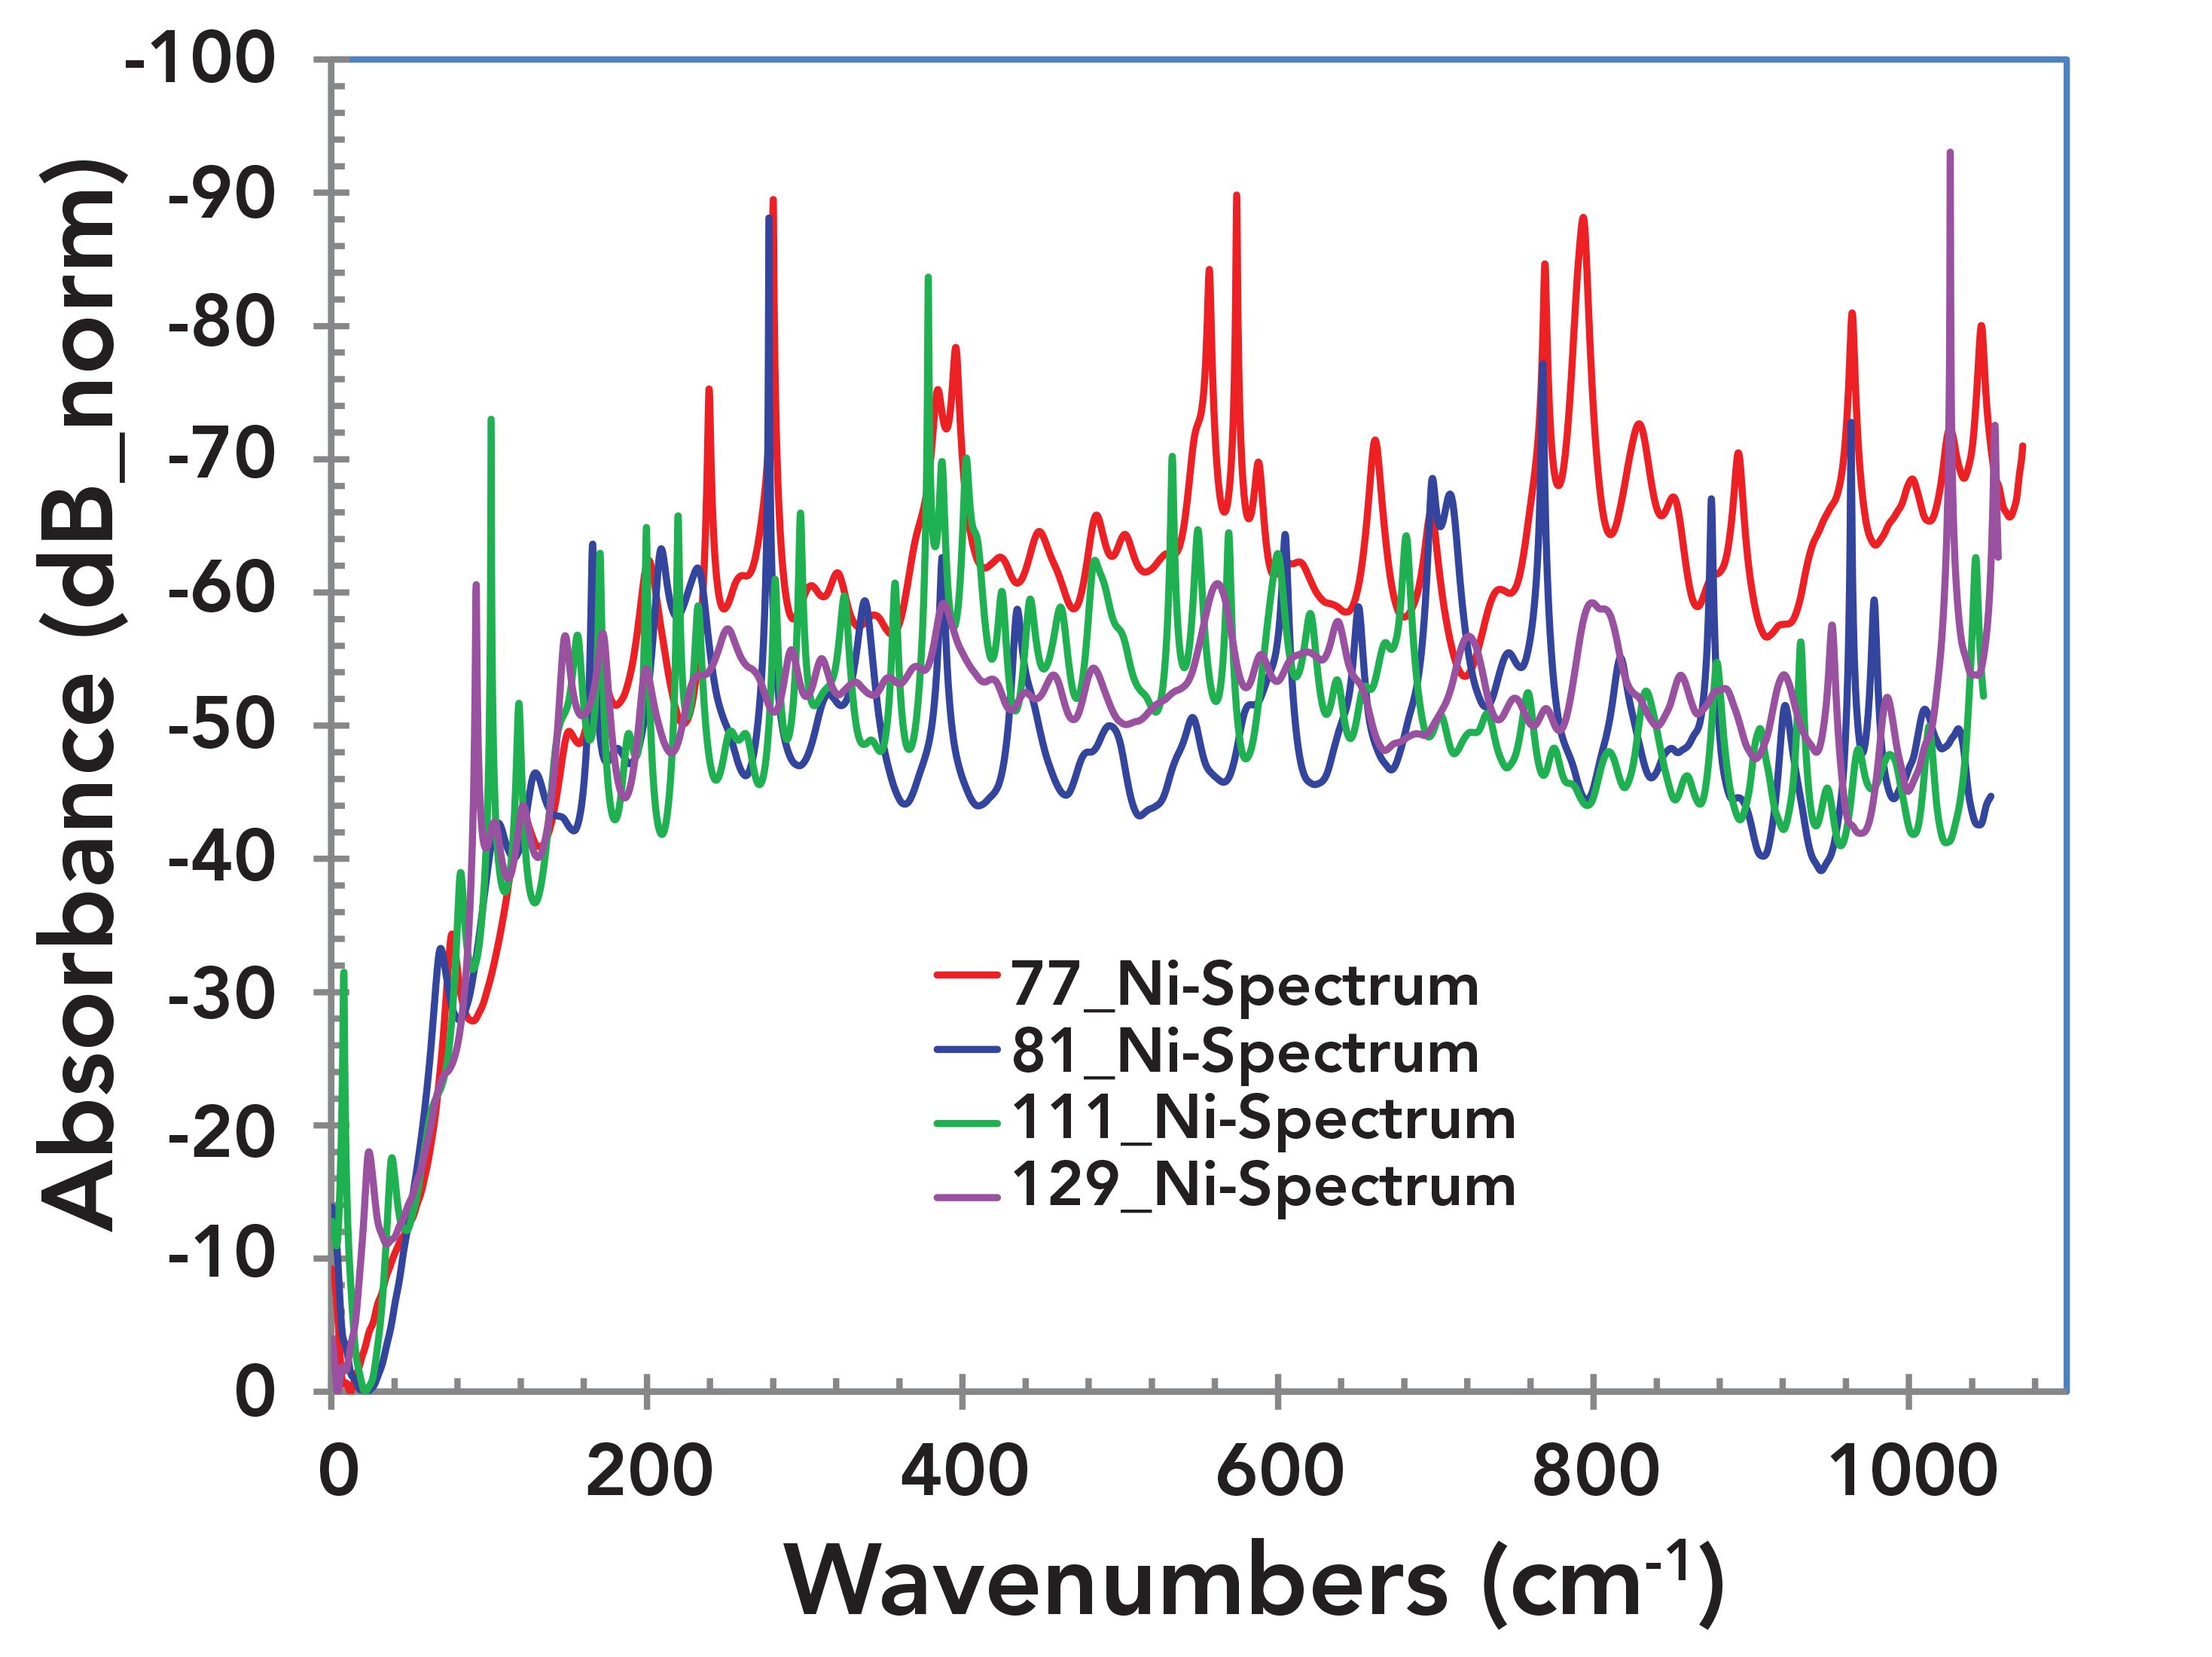
FIGURE 8: Enlarged of Figure 7. Absorbance spectra of four samples from the nickel rich area from 1 cm-1 to 300 cm-1 showing shift in frequency with respect to each other. This is consistent with previous observation of the systematic lattice dilation.
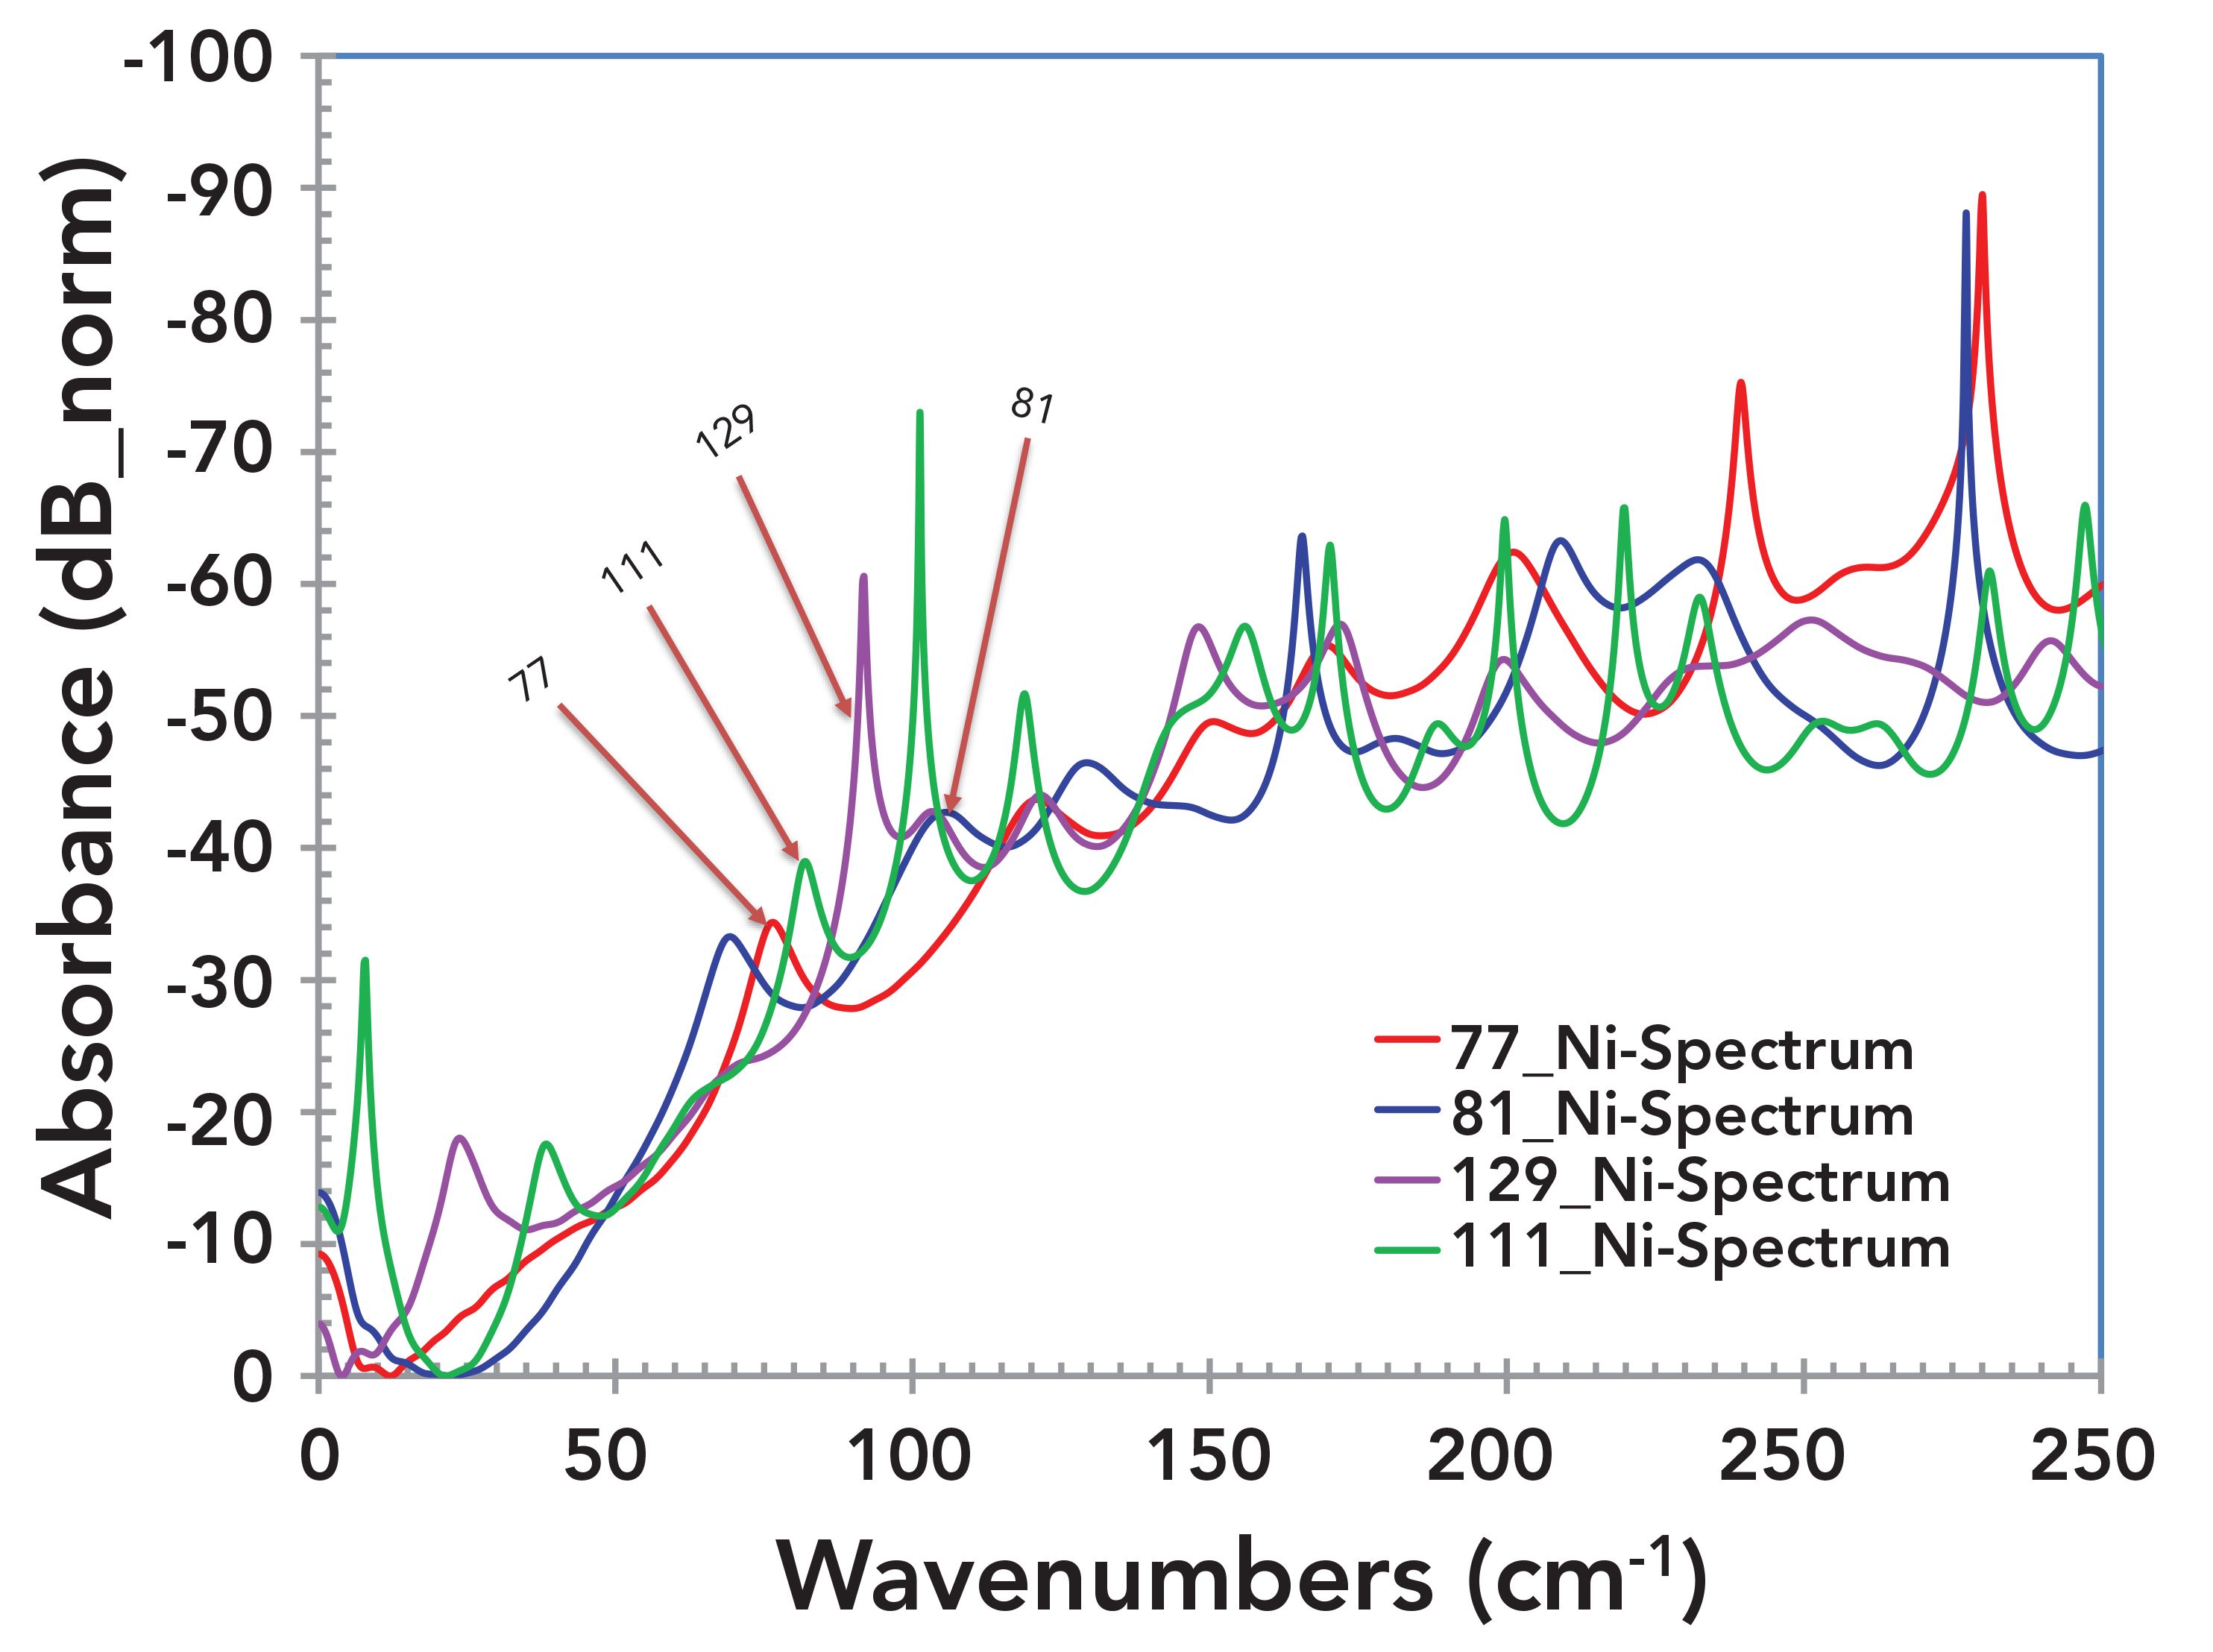
FIGURE 9: Enlarged image of Figure 7. Absorbance spectra of four samples from the nickel rich area from 300 cm-1 to 600 cm-1. The peaks at 403 cm-1 have been reported for NiO (2).
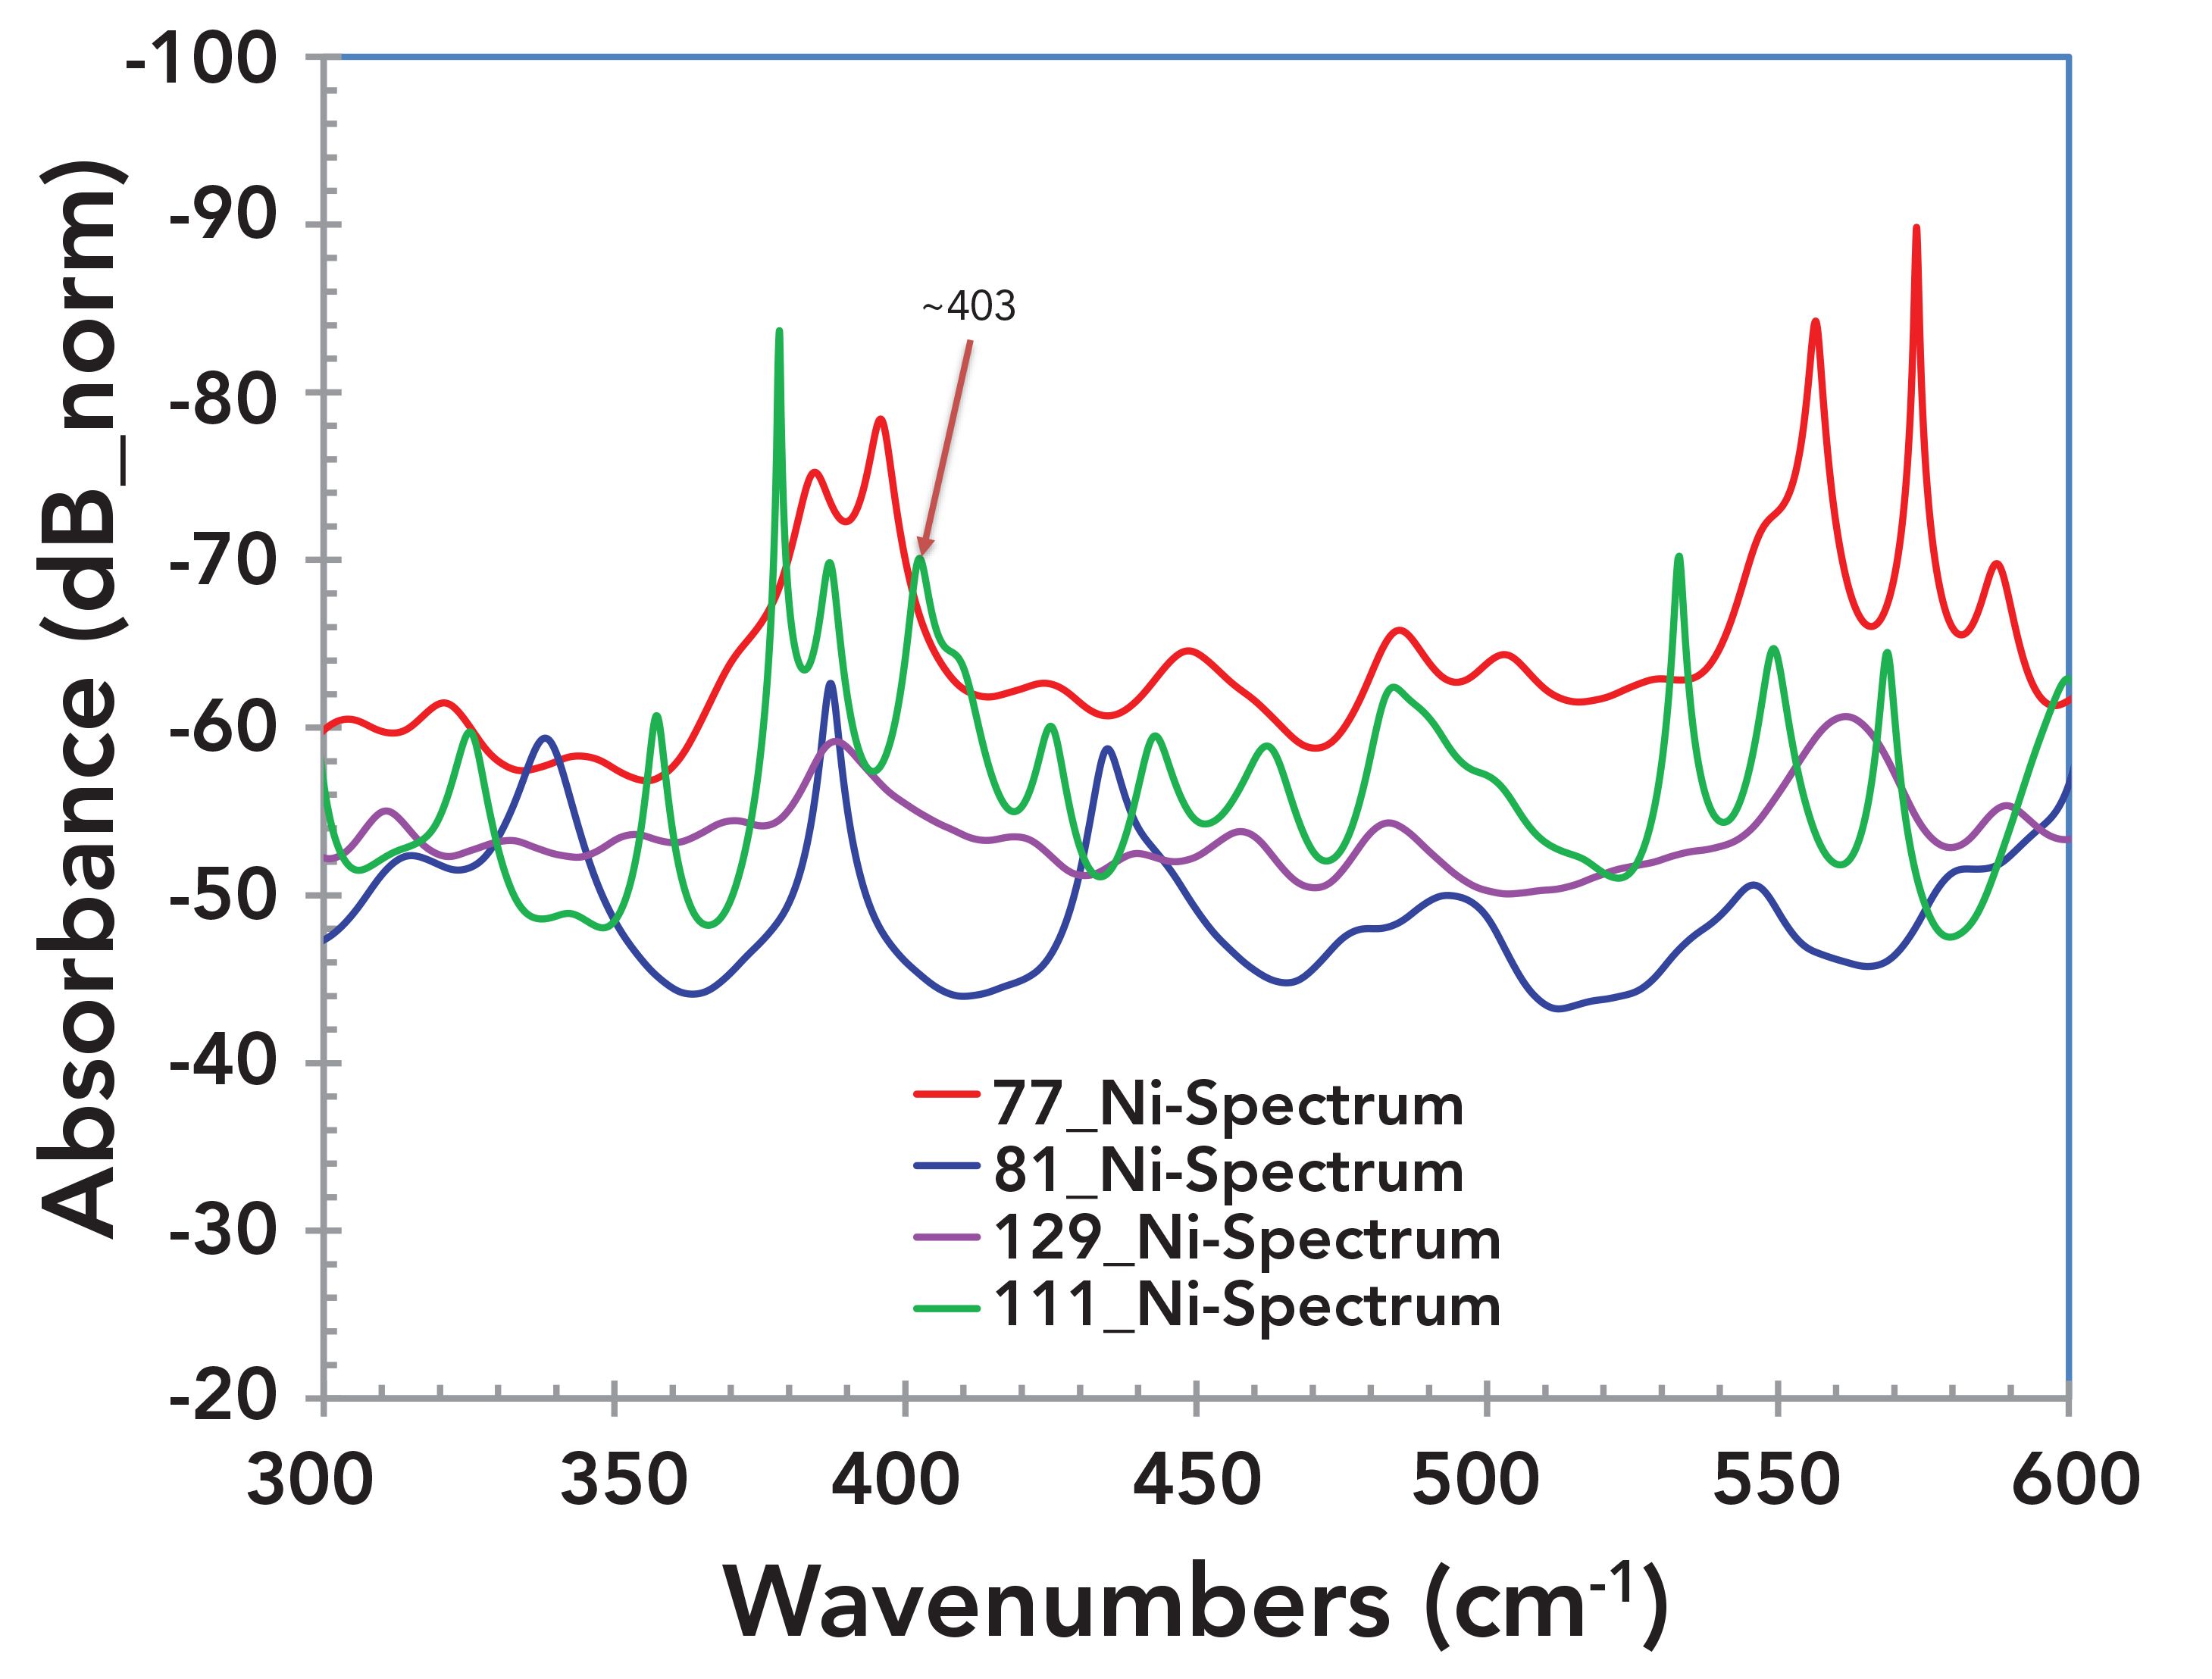
FIGURE 10: Enlarged image of Figure 7. Absorbance spectra of four samples from the nickel rich area from 600 cm-1 to ~1065 cm-1. The peaks at 720 cm-1 and 899 cm-1 have been reported for NiO (2).
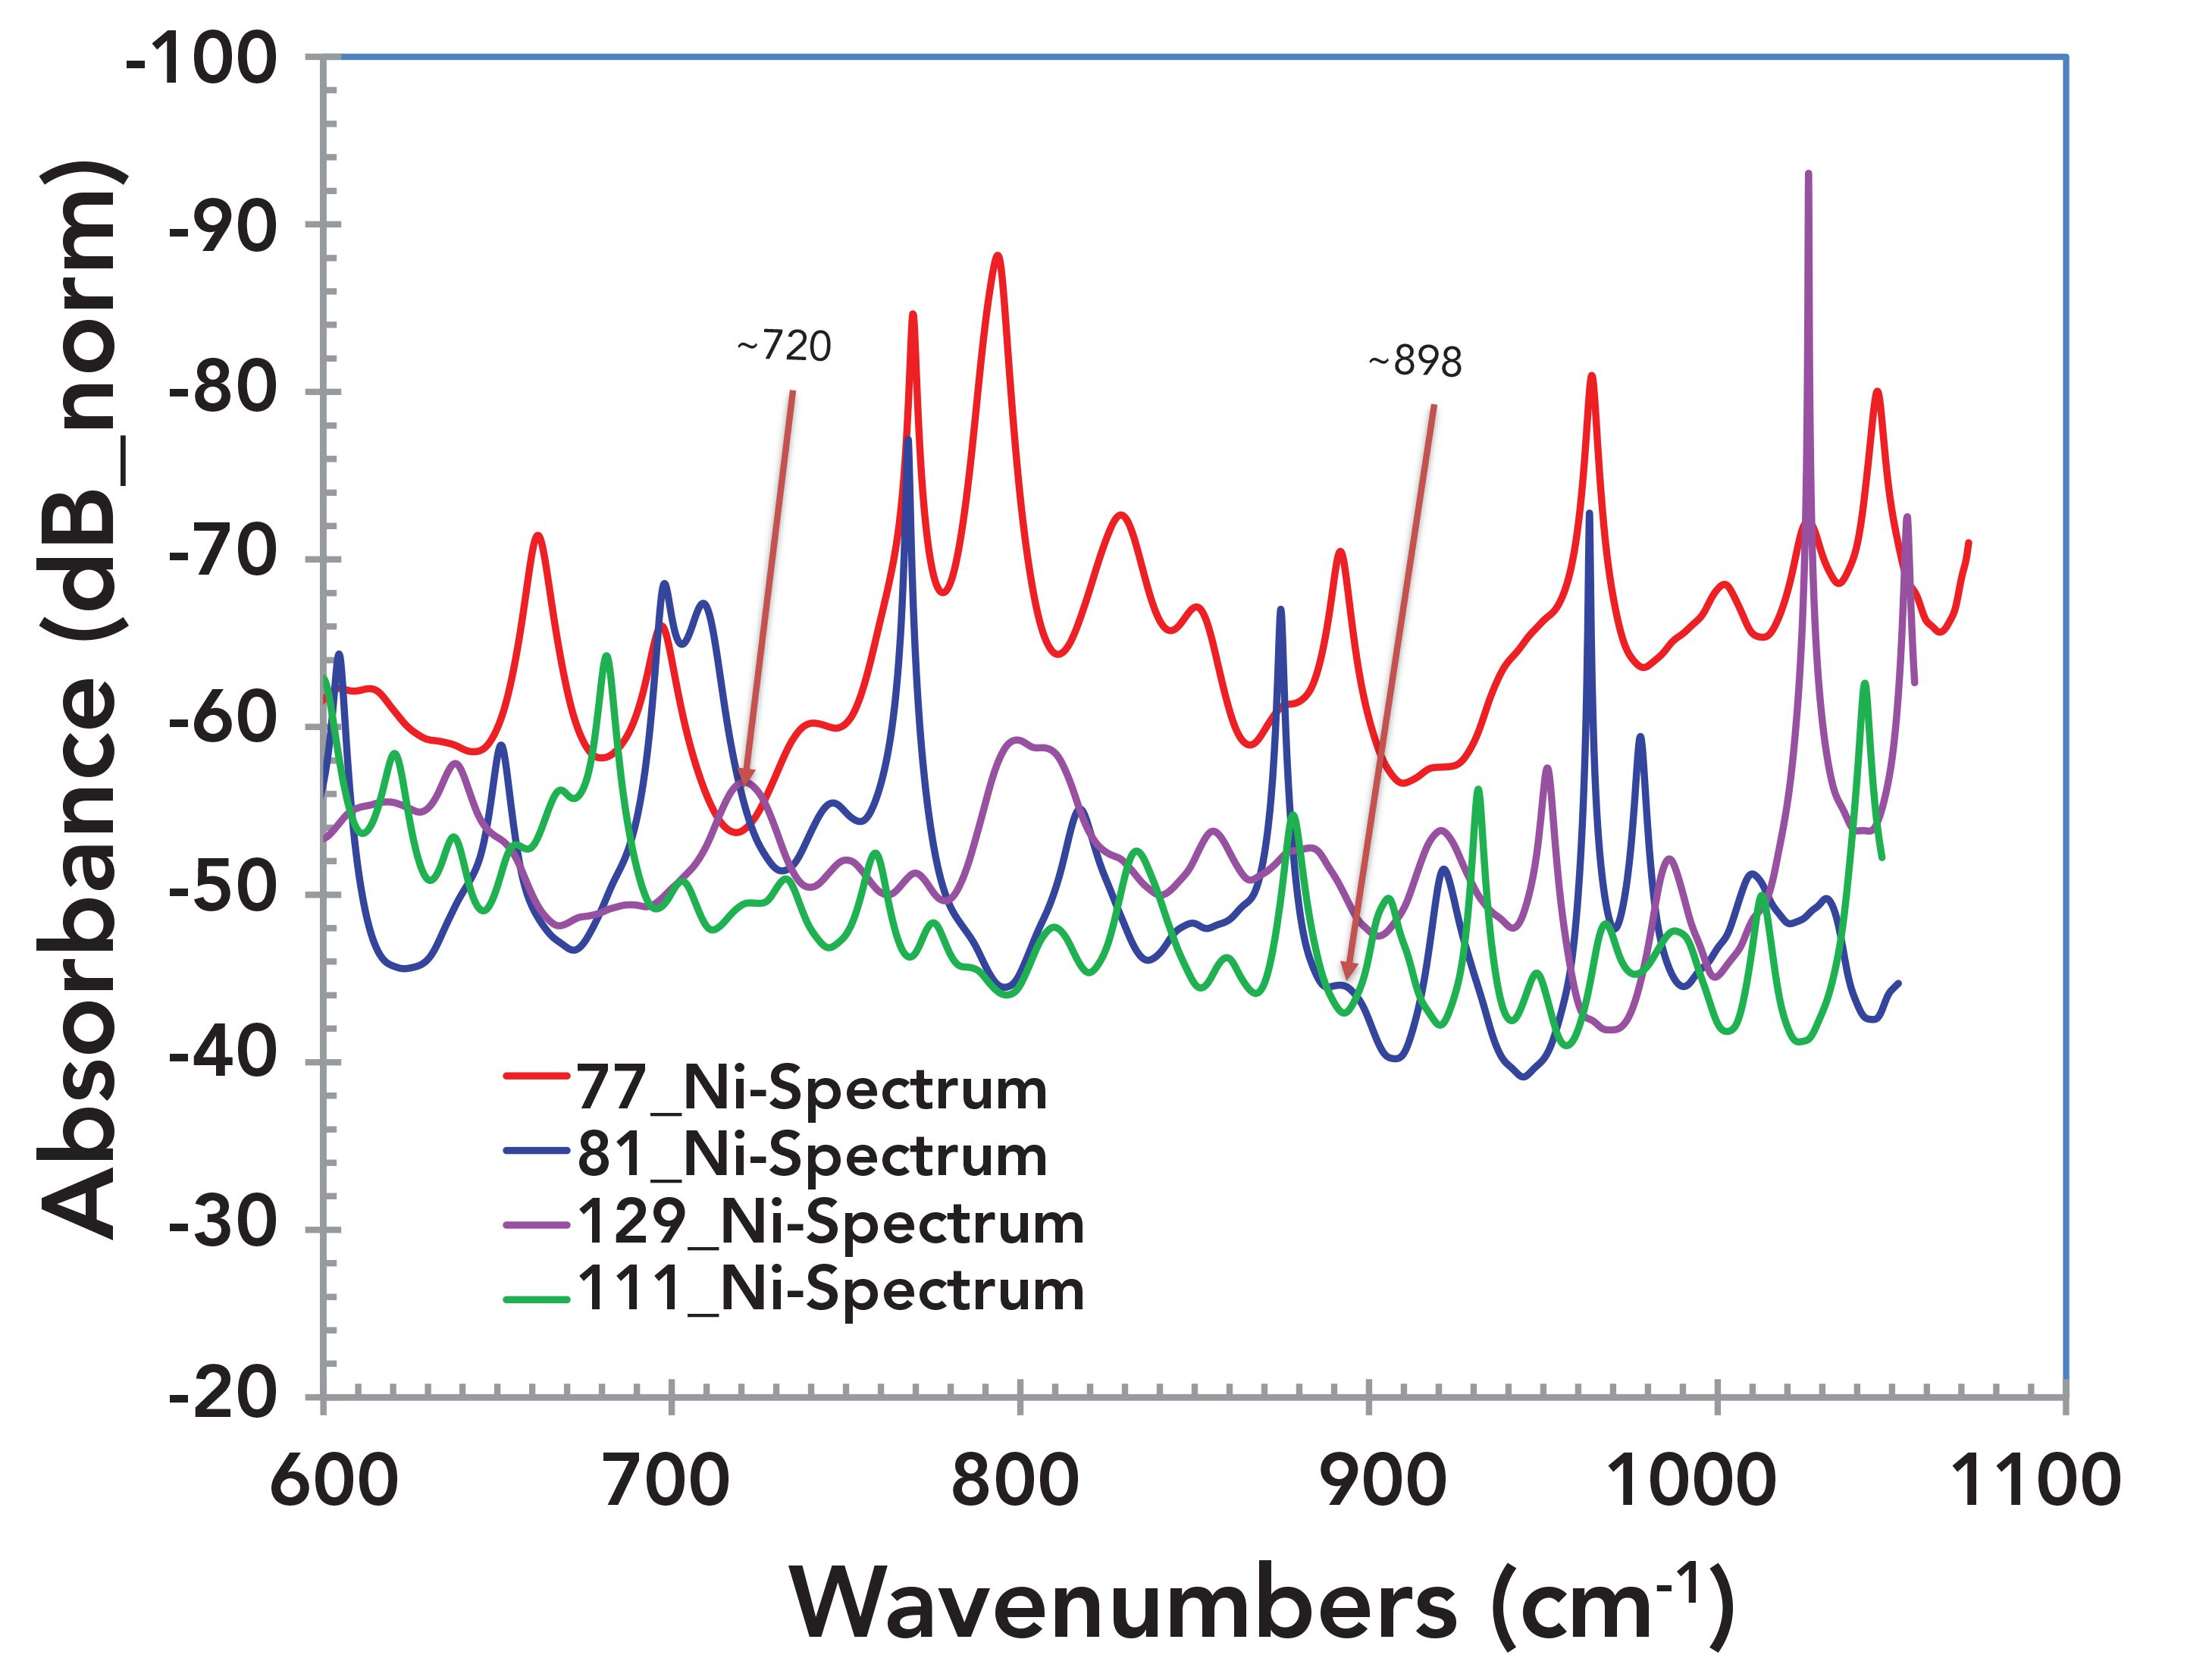
FIGURE 11: Evolution of the Raman spectrum of NiO at different temperatures; (a) heating and (b) cooling. Adapted from (11) for comparison purposes. Reproduced from M. M. Lacerda, et al, Appl. Phys. Lett. 110, 202406 (2017); doi: 10.1063/1.4983810, with the permission of AIP Publishing.
Discussion
Since the Brillouin’s IPB-HHT experiments (1) produces excess energy, a natural question is, where this excess energy is coming from? Previously, it was postulated that the higher energy generation effect observed in the HHT experiments is most likely a “lattice driven phenomenon,” as opposed to a nuclear transmutation of some kind (5). Another hypothesis is that it is the “time- crystal like non-equilibrium” process that is driving the energy balance. Time crystals (aka space-time crystal), a newer concept, are states of matter whose patterns repeat at set intervals of time and space. They are systems in which time symmetry is spontaneously broken (12). A time crystal, thus, is a structure that repeats in time, as well as in space. A time crystal never reaches thermal equilibrium, as it is a type of non-equilibrium matter, a form of matter proposed in 2012 (13). During the Brillouin IPB-HHT experiment, an RF stimulus is applied to the tube. The frequency of the RF field is very low, which is in the realm of driving a lattice vibration (and potentially, a phonon process). At temperatures high enough, the nickel lattice can rearrange morphologically. Hence, an applied field, along with RF heating, can cause the nickel atoms in the lattice to oscillate. As such an oscillating atom can undergo non-radiative transition to produce the quantity of increased heat energy (5) observed in some experiments. The observed lattice dilation was the basis for this hypothesis. In other experiments the increased energy (megajoules/mole) is greater than that available from any morphological change or chemical reaction.
Therefore, the foregoing hypothesis is further supported by the observation of the absorbance peak frequencies where the phonon modes and two-photon excitations have been reported (11). Interestingly, sample HHT-77 did not exhibit any phonon excitation peaks. This is also consistent with the fact that this sample was not subjected to the IPB-HHT experiment. The other three samples of the present investigation exhibit the phonon excitation absorbance peaks, thus, supporting the hypothesis.
Conclusions
Terahertz absorbance spectra of the four HHT samples have been analyzed. It was found that all samples exhibit prominent absorbance peaks over the range of 0.1 THz to ~30 THz. Most prominent absorbance peaks are found at and around ~6 THz and ~8 THz for all four samples. These peaks are consistent with the observation for nickel-based dilute alloys (Ni > 98%); thus, were assigned to nickel. Specific absorbance peaks at 403 cm-1, 720 cm-1, and 898 cm-1, for HHT-111, HHT-129, HHT-81, respectively, are a close match for NiO phonon excitation modes. While the plasma spray deposition was made for solid nickel, it is assumed that some NiO is present on the surface layer, giving rise to these measured peaks that corresponds to those observed for NiO. Thus, the observation of these peaks supports the previous hypothesis of excess energy generation from the nickel layer via nonradiative phonon excitation because of lattice vibration at elevated temperatures under an RF field. The combined effect of space-dependent oscillation because of lattice dilation and time-dependent oscillation because of an applied RF field stipulates the time-crystal hypothesis. The technique may be expanded to characterize simultaneous space-time oscillation in other systems, such as pharmaceuticals.
Acknowledgment
The authors wishes to thank Francis Tanzella for many useful discussions. Thanks to Robert Godes for providing the samples used in this study and related discussions. Anis Rahman wishes to thank Carl Page for providing a partial grant.
References
(1) F. Tanzella, “Isoperibolic Hydrogen Hot Tube Reactor Studies,” Final Progress Report, July 2018. Link: https://brillouinenergy.com/newwebsite/wp-content/ uploads/2019/04/Brillouin-SRI-Technical-Progress-Report-Final-Public-2018.pdf
(2) A. Rahman, J. Mol. Struct. 1006, 59–65 (2011). DOI: 10.1016/j.molstruc.2011.07.004
(3) A. Rahman, Spectroscopy 28(2), 44–53 (2013).
(4) A. Rahman and A.K. Rahman, IEEE Trans. Semicond. Manuf. 32(1), 7–13 (2019). DOI: 10.110 9/TSM.2018.2865167
(5) A. Rahman, F. Tanzella, A.K. Rahman, C. Page, and R. Godes, Novel Research in Sciences 2(4), (2019). DOI: 10.31031/NRS.2019.2.000545
(6) A. Rahman, A.K. Rahman, and D.A. Tomalia, Nanoscale Horiz. 2, 127–134 (2017). DOI: 10.1039/c7nh00010c.
(7) K.M.A. Rahman, C.J. Durning, and N.J. Turro, “Molecular Dynamics of PAMAM Dendrimers,” (1999), unpublished. Link: http://old.arphotonics.net/PAMAM%20 Dynamics%20report1up.pdf
(8) A. Rahman, Laser Focus World 56(4), 23–28 (2020).
(9) J.T. VanderPlas, Astrophys. J. 236(16), 28 (2018). DOI: 10.3847/1538-4365/aab766
(10) AutoSignal, a signal analysis package. Link: https://systatsoftware.com/prod- ucts/autosignal/
(11) P.D. Semalty, K. Dev, and P.N. Ram, Pramana – J. Phys. Vol. 66(6), 1077–1092 (2006).
(12) M.M. Lacerda, F. Kargar, E. Aytan, R. Samnakay, B. Debnath, J.X. Li, A. Khitun, R.K. Lake, J. Shi, and A.A. Balandin, Appl. Phys. Lett. 110, 202406 (2017). DOI: 10.1063/1.4983810.
(13) F. Wilczek, Phys. Rev. Lett. 19, 109 (2012). DOI:10.1103/PhysRevLett.109.160401.
Anis Rahman is with the Applied Research & Photonics, Inc., in Harrisburg, Pennsylvania., and with the Harrisburg University of Science and Technology in Harrisburg, Pennsylvania. Donald A. Tomalia is with NanoSynthons, LLC, in Mt. Pleasant, Michigan. Direct correspondence to: a.rahman@arphotonics.net.
AI-Powered SERS Spectroscopy Breakthrough Boosts Safety of Medicinal Food Products
April 16th 2025A new deep learning-enhanced spectroscopic platform—SERSome—developed by researchers in China and Finland, identifies medicinal and edible homologs (MEHs) with 98% accuracy. This innovation could revolutionize safety and quality control in the growing MEH market.
New Raman Spectroscopy Method Enhances Real-Time Monitoring Across Fermentation Processes
April 15th 2025Researchers at Delft University of Technology have developed a novel method using single compound spectra to enhance the transferability and accuracy of Raman spectroscopy models for real-time fermentation monitoring.
Karl Norris: A Pioneer in Optical Measurements and Near-Infrared Spectroscopy, Part I
April 15th 2025In this "Icons of Spectroscopy" column, executive editor Jerome Workman Jr. details how Karl H. Norris has impacted the analysis of food, agricultural products, and pharmaceuticals over six decades. His pioneering work in optical analysis methods including his development and refinement of near-infrared (NIR) spectroscopy has transformed analysis technology. This Part I article of a two-part series introduces Norris’ contributions to NIR.