Use of Raman Spectroscopy to Qualify Carbon Materials
In the last 30 to 40 years, various new types of carbon materials have been engineered for multiple industrial uses. It is now well-known that the Raman spectrum is sensitive to the structure, even though the spectrum is rather uncomplicated. Because Raman spectroscopy now has a reputation for providing good information, potential users of Raman equipment can request information on the quality of their sample. However, they are often not able to define clearly what they mean by “quality.” If they are growing diamond films, they may or may not want interstitial sp2 carbon to glue polycrystalline diamond together. If they are growing hard diamond-like carbon (DLC) films, they may want to correlate the spectral characteristics with physical characteristics of the film. In this column, I explain how the Raman characteristics can aid in characterization of carbon materials.
There are essentially two ways that elemental carbon bonds to itself—sp2 and sp3 bonds. In diamonds, all bonds are sp3. The atoms crystallize in a tetrahedral lattice, and the zone center phonon falls at 1332 cm-1. In perfect graphite, all the carbons are arranged in infinitely extended aromatic planes that stack in the A-B-A-B arrangement. The zone center phonon falls near 1580 cm-1, and has been called the G band. However, graphite rarely appears without a second band in the mid-1300 cm-1 region. In 1970, Koenig reported that he could correlate the relative intensity of this band to the crystallite size of the graphite sample being measured, as determined by X-ray diffraction (XRD) (1); the intensity of this band that came to be known as the D (“disorder”) band was related inversely to long range order. It was believed that the D band simply represented the disorder in graphite. However, in 1978, Vidano and Fischbach and, in 1990, Wang, Alsmeyer, and McCreery found that its frequency depended on the laser excitation wavelength. By exciting graphite with varying laser wavelengths they observed that the D band occurred near 1390 cm-1 when excited in the UV, and 1270 when excited in the NIR (2,3). They also documented the presence of a band in the mid-2700 cm-1 region that fell close to precisely twice the frequency of the D band. In the discussion by Wang and associates, they surmised that the dependence of the D band frequency on the excitation wavelength followed from each wavelength exciting different subpopulations of the materials. However, in 2004, Reich and Thomsen produced a theory based on double resonance that explained the “excitation-energy dependence (of the D band), the overtone spectrum, and the difference between Stokes and anti-Stokes scattering” (4). Although the theory is an elegant solid-state physics exposition of the energy band structure and its effects creating double resonance Raman conditions, it is probable that many readers of this article would not be in a position to become competent in this area. The point is to be cognizant of the best understanding of the origins of the Raman spectra of carbon-based materials so that the spectra can be used to derive empirically physical and chemical information on manufactured materials.
Before the double resonant theory was developed, the D nomenclature was further used to denote “diamond-like,” which was probably a misnomer. The term came from the development of hard carbon films for the computer hard disc industry where the conclusion was that the hardness of the films was related to the D or “diamond-like” band, whose frequency was not far from that of diamond. In fact, the spectra of these films were fit to D and G bands and the characteristics of the fits (peak positions, peak widths, peak amplitudes, % Gaussian in the fitting function, and integrated intensity in the fits) were used to correlate to the physical characteristics of the films. Because of the wavelength dependence of the D band intensity, for empirical correlations to be effective, measurements must be made in a consistent manner—same excitation wavelength, same spectral dispersion, and so forth. Irmer and Dorner-Reisel explained the spectral behavior related to the size of graphitic nanoclusters, hydrogenation, and hydrogen-free tetrahedral amorphous carbon (ta-C) with sp3-bonded content, and how these properties are correlated with hardness and wear properties (5).
In this column, I show examples of measurements of all these materials, so that someone interested in using the spectra for empirical correlations has a roadmap of where to start.
Diamond
The phonon in diamond appears at 1332 cm-1, as seen in Figure 1. A clean diamond has a flat baseline, with some evidence for the second order band near 2600 cm-1. Figure 1 shows the Raman spectrum with a picture of the small chip from which the spectrum was acquired. Figure 1 also shows the spectrum plotted in wavelength units, rather than Raman units, and shows the photoluminescence (PL) that sometimes appears in diamond because of impurities. These PL spectral features have been used to characterize diamond, both natural and man-made (made under pressure or by chemical vapor deposition [CVD]) (6).
FIGURE 1: (a) Photoluminescence and (b) Raman spectra of a small diamond chip (insert image).
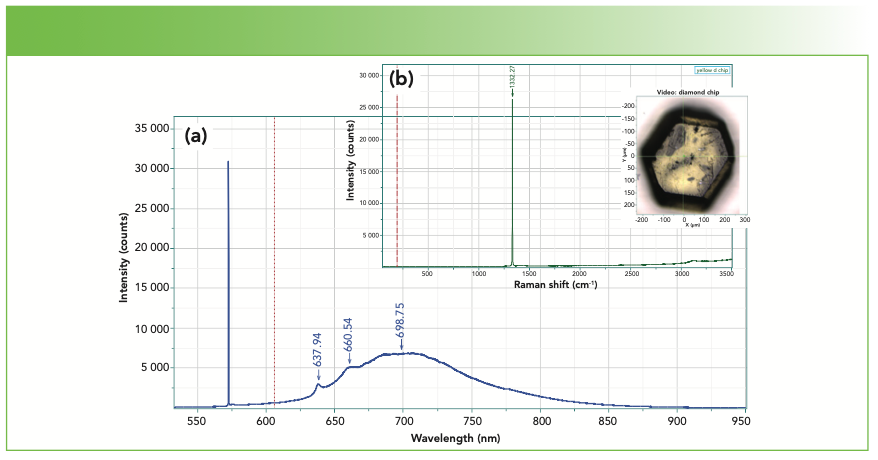
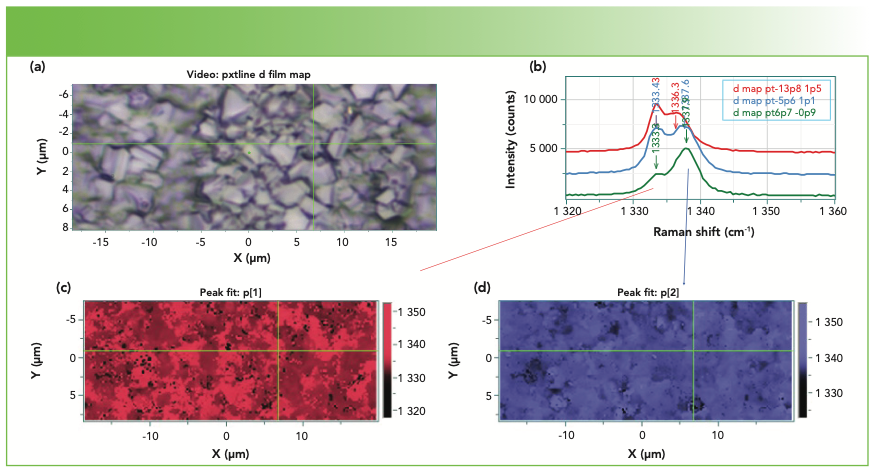
Figure 2 shows the results of a mapping measurement of a polycrystalline diamond film. The two colored maps were made using the Raman frequency of the two peaks fitted by the software. This material is clearly not high quality, single crystal diamond, but if the small crystals are grown to be used for polishing, the material would work well. If, however, one wanted a diamond window, this sample would clearly not be useful. In addition, it is useful to point out that the peak shifts in this data set are understood to be because of stress.
FIGURE 2: (a) Photomicrograph of a polycrystalline diamond film. (b) Representative Raman spectra illustrating the multiplicity of bands all over this film. (c, d) The mapping renditions are color-coded for the peak frequency for the two bands, (c) the lower band, and (d) the higher band.
Graphite and Other sp2 Carbons
Figure 3 shows the spectrum of crystalline graphite measured with a 600 and 1800 g/mm grating on the same instrument. Note that the relative intensities do not exactly overlay because of differences in line widths relative to the instrument’s dispersion with the two gratings. Because of this phenomenon, one must make measurements under consistent conditions if meaningful correlations from the spectra want to be derived. Note that the D band appears in this spectrum because truly single crystal natural graphite is rare.
FIGURE 3: Raman spectrum of graphite recorded with (a) the 1800 vs. (b) the 600 groove per mm gratings.
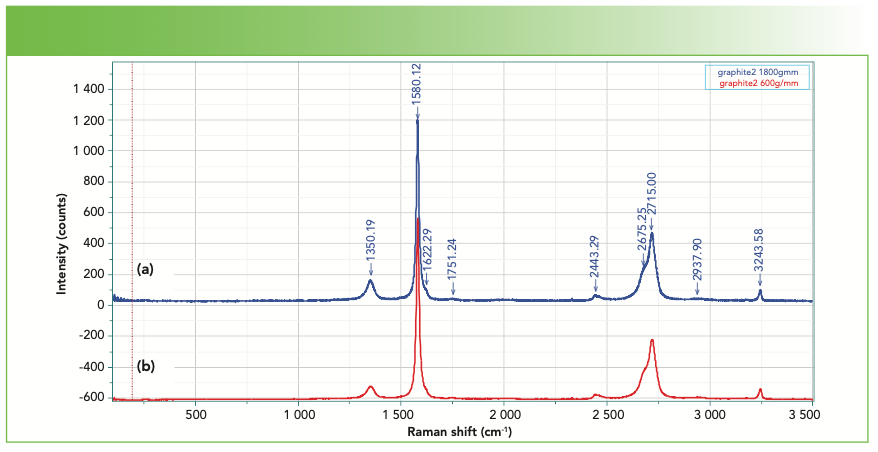
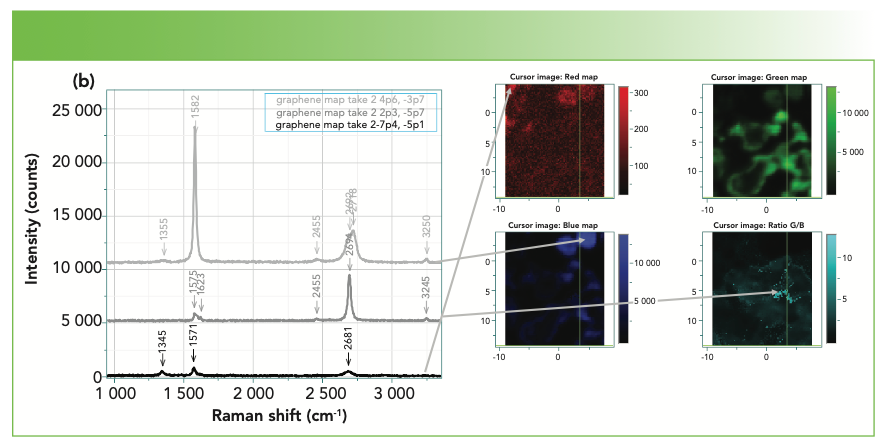
Figure 4a shows a Raman map of graphene. Graphene is technically a single layer of graphite, but the spectra of several-layer graphene have been used to determine the number of layers. In the figure, the sets of red, green, and blue cursors were used to calculate the integrated intensities of the D, 2D, and G bands. Clearly, the D band is quite low in intensity in this sample, which is expected for a near perfect lattice. A mark of true single layer graphene is a high I(2D)/I(G) ratio, which can be seen in the light teal map on the lower right. However, the intensity maps do not show the entire picture. Figure 4b shows a few spectra extracted from the map, indicating how the spectra change in this data set from point to point. A good reference for the Raman spectra of graphene is an article in Physics Reports (7) which discusses many interesting phenomena that can be monitored with Raman spectra.
FIGURE 4a: Map of graphene on silicon. Upper right is micrograph, with box showing area of map. Upper left shows all the spectra in the mapped area, overlaid. Lower right shows the mapped rendition of the three graphene bands; the colors in the map correspond to the colors of the cursors in the upper left part of the figure. The teal colored map represents the ratio of the 2D to G bands. The higher the ratio, the fewer the layers of graphene.
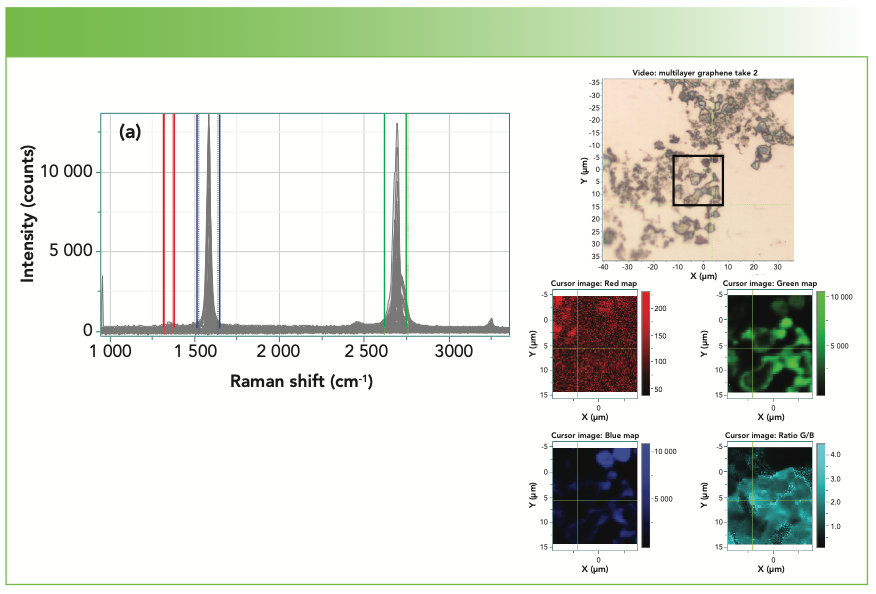
FIGURE 4b: Left: three spectra extracted from the map in Figure 4a. Note the differences in the 2D to G intensities, as well as the line shapes. The arrows indicate where on the map each spectra was generated.
There is also the possibility of monitoring single-walled and multi-walled carbon nanotubes (SWCNTs and MWCNTs). In addition to the D and G bands (and their derivatives discussed above), the SWCNTs have bands in the low frequency region(<300 cm-1), which are diagnostic of the chirality and size of the tube. However, the intensity of the spectra are extremely dependent on the type of tube, which changes the resonance conditions. That means, if you are looking for a particular type of tube, you may or may not see it with the laser wavelength that you are using. There are many good references on the solid states physics of these materials, but in another Physics Reports article, there is a figure that clearly shows the relationship between the excitation wavelength and the type of tube measured (Figure 12 in reference [8]).
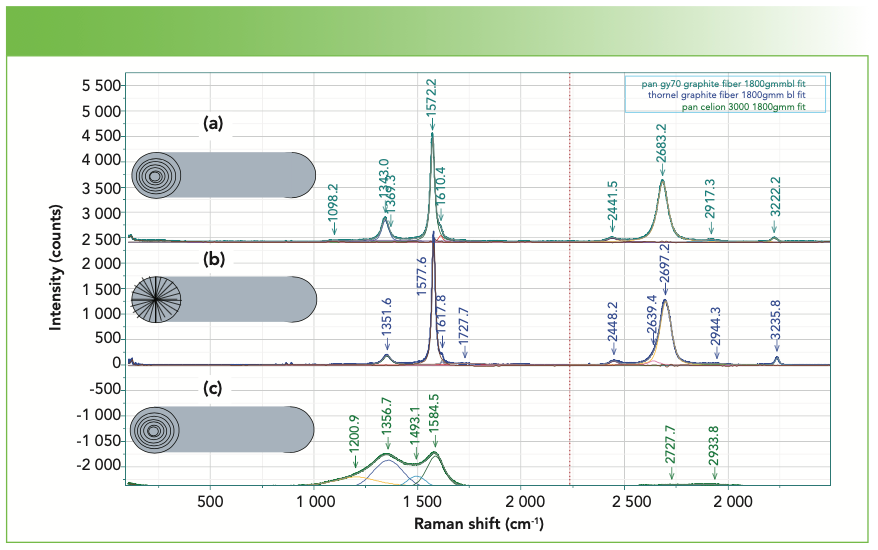
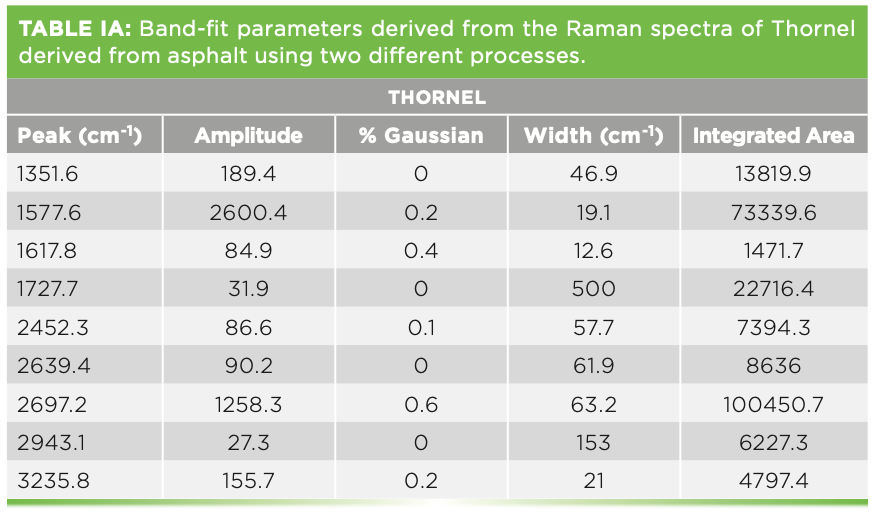
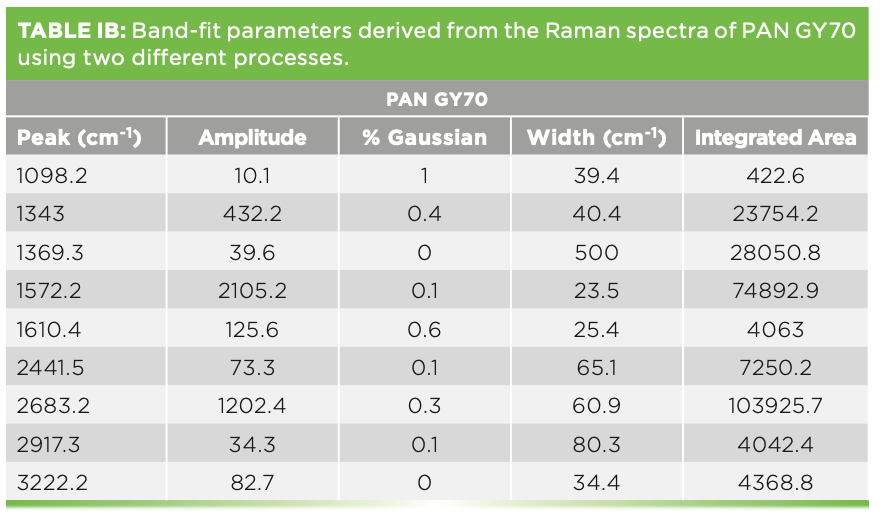
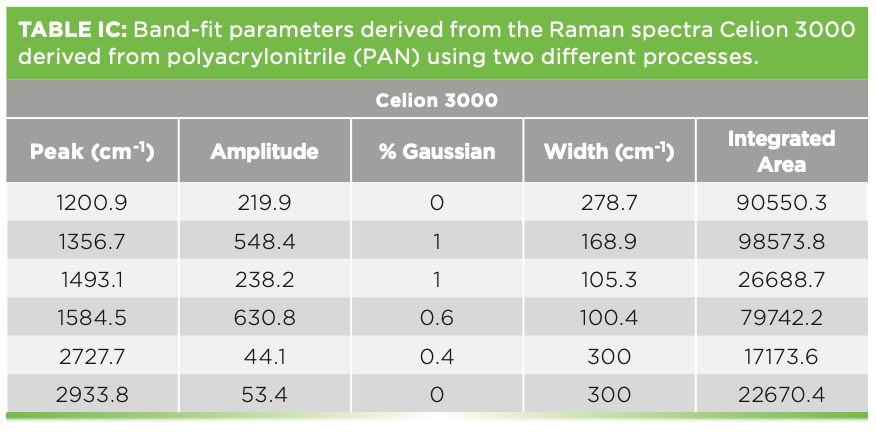
We have also measured the spectra of various carbon fibers that were shared with us by Herman Noether, retired from Hoechst Celanese. Thornel was manufactured from pitch, and its structure was known to exhibit radial graphite planes. Other fibers manufactured from polyacrylonitrile (PAN) exhibit turbostratic graphite planes that wrap around the fiber axis. Figure 5 shows the spectra of these three samples. Both Thornel and PAN GY70 were fairly crystalline as determined by their Raman spectra, both of which have sharp G and D bands. The PAN fiber called Celion 3000 exhibits very broad D and G bands and very weak features in the 2D region. I have band-fit all three spectra. Thornel and GY70 both exhibit a weak but sharp band between 1610 and
1620 cm-1, and this band has been seen in intercalation studies. To fit the Celion spectrum, two extra bands are required to flatten the residual. If you will be using these spectra to characterize or compare samples, again the samples have to be oriented in the same way, and all instrumental conditions have to be the same (laser wavelength, spectral dispersion, and polarization). Then, you can export the fitted parameters to an Excel file to determine quantitatively how the samples compare. In fact, you can correlate physical chemical properties with these parameters, even if you do not understand what they mean at the nanoscopic level. Tables Ia–Ic show the fitted parameters from these spectra.
FIGURE 5: Raman spectra of carbon fibers of 3 different structures, (a) heat treated PAN (polyacrylonitrile) gy70 graphite fiber, (b) Thornel graphite fiber pulled from pitch, and (c) PAN Celion 3000 fiber. The cartoon figures on the left represent the structure of these fibers.
An example of how these spectra can be useful is something I came across on the internet while assembling this article. An article that goes back to 1979 discusses the uptake of certain metal chlorides that are used to treat carbon fibers to raise their electrical resistance. This study was sponsored by NASA because of there being several industrial accidents that were a consequence of electrical sparking in manufacturing facilities (9). What was found was that the chemical uptake was much higher in the pitch fibers than in the PAN fibers. Looking at the cartoon figures that I made for Figure 5, it is easy to understand why there is more penetration in the pitch fibers than in the PAN fibers. Polarized Raman spectra would enable differentiating PAN from pitch fibers because of the orientation of the graphite planes in the fiber.
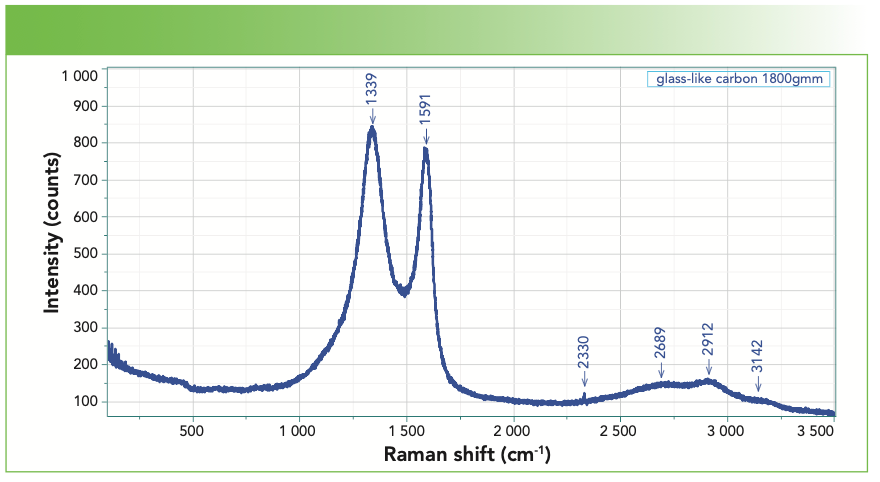
There is also a material called glassy carbon, a spectrum of which I show in Figure 6. Note that it also has D and G bands, wide enough to overlap a bit, but sharper than the bands of DLC, which you will see in a moment. In addition, the D band is more intense than the G band which is rather unusual. According to Professor William White at Penn State, the adjective “glassy” for this material is actually a misnomer. It is highly crystalline, but the crystals are quite small. Professor White told me this more than 30 years ago (10), and the current theories of the structures of sp2 carbons might affect this description, but if you do a Google search on the Raman spectrum of glassy carbon, most spectra are similar to the one in Figure 6.
FIGURE 6: Raman spectrum of glass-like carbon exhibiting medium sharp bands, with the D band more intense than the G band.
DLC Films
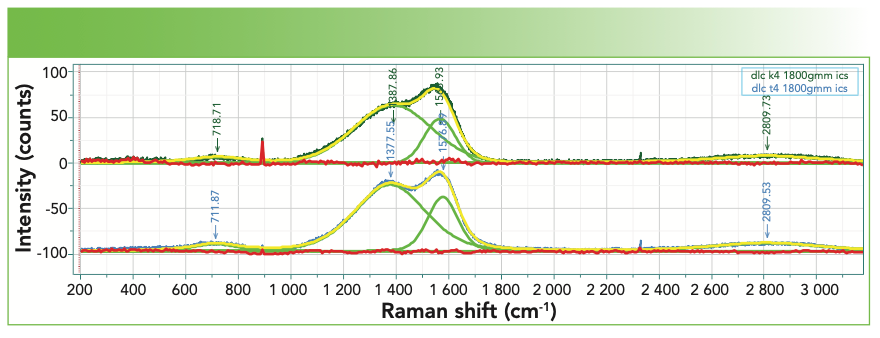
The Raman spectra of these films have been used extensively for physical characterization. Figure 7 shows the spectra of two such films, with the band-fitting, and Table II shows the band-fit parameters extracted and imported into Excel for further manipulation that will enable correlation with physical properties. There is an excellent review by Whitley that describes how thistechnology is used in the computer disk industry (11). The figure shows two spectra, both of which were successfully fit to a D and G band. I say “successfully fit” because the residual shows only noise, but no indication of the necessity for another band. Comparison of the D bands in the two spectra indicate significant differences in band width. More interesting, however, is the I(D)/I(G) ratio when using the highest count rate in the region of the two bands vs. the amplitude (height) of the fitted peaks vs. the integrated intensities of the fitted peaks. Table III shows the results of these simple calculations for the two samples. Reading across the table from left to right for each sample, it is clear that the calculated ratios are quite different. People tell me that they want to know the D/G ratio as a quality index. But which ratio do they really want? The problem is that the non-spectroscopist is not aware of this complexity. It appears that calculating the D/G ratio should be a simple calculation, but, clearly, the answer is different depending on how the calculation is done. Which one will produce the best correlation with the desired properties? Even if you do not understand what is the origin of these spectral characteristics, you can see that what you choose to calculate will determine what number you will get. Maybe the thing to do is to correlate separately all of these ratios to the physical characteristics of the sample to see which one actually predicts the data the best.
FIGURE 7: Raman spectra of two DLC films that exhibit clear spectral differences that are further clarified in the band-fitting.


Summary
We showed representative spectra of many classes of carbon allotropes, with an indication of the origins of the spectra. We tried to indicate what about the spectra can be important for some obvious applications, providing literature references in order for the reader to start planning their work.
Good luck!
References
(1) F. Tuinstra and J.L. Koenig, J. Chem. Phys. 53(3), 1126–1130 (1970).
(2) R Vidano and D B. Fischbach, J. Amer. Ceram. Soc. 61, 13–17 (1978).
(3) Y. Wang, D.C. Alsmeyer, and R.L. McCreery, Chem. Mater. 2, 557–563 (1990).
(4) S. Reich and C. Thomsen, Phil. Trans. R. Soc. London A 362, 2271–2288 (2004).
(5) G. Irmer and A. Dorner-Reisel, Adv. Eng. Mater. 7(8), 694–705 (2005).
(6) www.gia.edu/gems-gemology/spring-2016-photoluminescence-spectroscopy-diamond-applications-gemology
(7) L.M. Malard, M.A. Pimenta, G. Dresselhaus, and M.S. Dresselhaus, Phys. Rep. 473, 51–87 (2009).
(8) M.S. Dresselhaus, G. Dresselhaus, R. Saito, and A. Jorio, Phys. Rep. 409, 47–99 (2005).
(9) T.E. Thompson, NASA-CR-166201 Carbon Fiber Modification NASA Contract NAS 2-10091 Nov 1979 SRI Project 7976
(10) Private Communication, Professor William White, Penn State University.
(11) A. Whitley, “The Use of Raman Spectroscopy to Monitor the Quality of Carbon Overcoats in the Disk Drive Industry,“ in Handbook of Raman Spectroscopy from the Research Laboratory to the Process Line, I.R. Lewis and H.G.M. Edwards, Eds. (Marcel Dekker, Inc. New York, NY, 2001), pp. 975–998.
Fran Adar is the Principal Raman Applications Scientist for Horiba Scientific in Edison, New Jersey.


AI-Powered SERS Spectroscopy Breakthrough Boosts Safety of Medicinal Food Products
April 16th 2025A new deep learning-enhanced spectroscopic platform—SERSome—developed by researchers in China and Finland, identifies medicinal and edible homologs (MEHs) with 98% accuracy. This innovation could revolutionize safety and quality control in the growing MEH market.
New Raman Spectroscopy Method Enhances Real-Time Monitoring Across Fermentation Processes
April 15th 2025Researchers at Delft University of Technology have developed a novel method using single compound spectra to enhance the transferability and accuracy of Raman spectroscopy models for real-time fermentation monitoring.
Nanometer-Scale Studies Using Tip Enhanced Raman Spectroscopy
February 8th 2013Volker Deckert, the winner of the 2013 Charles Mann Award, is advancing the use of tip enhanced Raman spectroscopy (TERS) to push the lateral resolution of vibrational spectroscopy well below the Abbe limit, to achieve single-molecule sensitivity. Because the tip can be moved with sub-nanometer precision, structural information with unmatched spatial resolution can be achieved without the need of specific labels.