Identification of Five Similar Cinnamomum Wood Species Using Portable Near-Infrared Spectroscopy
The feasibility of using a portable near-infrared (NIR) spectrometer combined with partial least squares for discrimination analysis (PLS-DA) to identify five similar Cinnamomum wood species was investigated. To improve model reliability and identification accuracy, the effects of three main spectra preprocessing methods and their combinations were examined. Then, the model performance created by spectra collected before and after specimen surface sanding were compared. In the PLS-DA model based on spectra preprocessed by standard normal variate (SNV) and first derivative combined, the identification accuracy of the five species was above 95%, and the compared results demonstrated the surface natural change influences the NIR model performance. It was shown that a portable NIR device combined with PLS-DA can be used to rapidly and accurately identify five similar Cinnamomum wood species.
Cinnamomum is a genus belonging to the Lauraceae family that is composed of approximately 250 known species mainly distributed in warm temperature and tropical regions (1,2). There are about 46 species in China, and they are mainly distributed south of the Qinling mountains, especially in the southwestern, central, and southern China provinces. The genus, Cinnamomum, is one of the most popular and important species because its byproducts are used in food flavoring, cosmetics, and medicines (3). The major aromatic product, camphor, is obtained from Cinnamomum camphora, and the timber of this species is considered a good material for high-value furniture, carvings, and structural uses (4).
Some anatomy research involving Cinnamomum (Lauraceae) has been conducted (4,5,6). The results have shown that the wood structure was homogeneous among genera (4,7). As a result, it is difficult to determine wood species immediately on-site even for a skilled inspector. Although some advancement has occurred in wood species identification auxiliary technology, a device that could identify wood species rapidly and on-site at the species level has long been desired. Near-infrared (NIR) spectroscopy has been investigated as a reliable technique for identifying some wood species, but it has not been tested for the Cinnamomum species. NIR spectroscopy is a nondestructive, fast, and cost-effective analytical technology (8), and an NIR instrument combined with multivariate analysis is a useful tool not only for the quantification but also for the qualification of wood species (9).
Wood species identification by NIR spectroscopy has been investigated extensively. Adedipe and others correctly classified the red and white oak species by using NIR spectroscopy and soft independent modeling of class analogies (SIMCA) (10). NIR spectroscopy, with aid of partial least squares for discrimination analysis (PLS-DA), identified mahogany (Swietenia macrophylla King) from three similar-looking woods, crabwood (Carapa guianensis Aubl.), cedar (Cedrela odorata L.), and curupixá (Micropholis melinoniana Pierre) at two conditions of laboratory-processed powder (11) and solid wood block (12). Based on NIR spectroscopy, eight rosewoods were clearly classified into eight categories by principal component analysis (PCA) (13). Horikawa and others demonstrated that two anatomically similar wood species, Piuns densiflora and Pinus thunbergii, could be identified by employing NIR spectra collected from heartwood samples (14). These studies demonstrated that NIR spectroscopy is an effective technique for wood species identification in laboratory conditions, but further studies are needed.
The development of hardware and high-performance accessories has promoted the advance of miniature NIR spectrometers (15). Some investigations involving wood species identification and provenance detection by portable NIR devices has been conducted. The origin of true mahogany wood from five countries was detected by portable NIR spectroscopy devices and multivariate data analysis (16). The potential of portable NIR (spectral range: 1595–2396 nm) technology combined with SIMCA and PLS-DA to identify seven high-value Dalbergia wood species was investigated (17). The results showed that visually confusable species of Dalbergia can be identified at species level using portable NIR technology. Therefore, it is promising to identify wood species accurately and rapidly on-site by using a miniature NIR spectrometer.
The main advantages of portable NIR devices include nondestructive and on-site detection; however, the disadvantages include the spot size, limited wavelength range, and limited resolution (18). Because of these drawbacks, it makes it difficult to develop an all-purpose NIR spectra database. The samples from previous research studies are mainly from sawmills, lumber boards, and so on. Wood herbarium, with abundant varieties of wood specimens, is an invaluable resource for establishing a teaching model database. If the NIR spectroscopy model database established using wood specimens from the wood herbarium can be used to identify external wood species, it would promote the development of wood species filed and identified by portable NIR spectroscopy technology dramatically.
NIR investigations involving large-scale wood specimens from wood herbariums are few in number. For this study, specimens were stored in the wood herbarium under natural conditions for many years; as a result, the smell and surface color of the woods has changed. The NIR spectra mainly contain information pertaining to the overtones and combinations of fundamental vibrational transitions, including those of the C-H, O-H, and N-H functional groups (19). The study of Horikawa and others showed that when the aging wood samples were used, the NIR model was ineffective in identifying two similar wood species, Pinus densiflora and Pinus thunbergii, when sampling from traditional architecture (14). As a result, researching the feasibility of building an NIR model by wood specimens from wood herbarium is desirable.
To verify if the removal of oxidized film on the surface of the wood specimen interfered in the discrimination analysis of wood species, 29 samples of mahogany were cut from the end of boards that were stored to be exported from the market in the research of Braga and others (12). The spectra were obtained before and after sanding the sample surface. The result showed no significant difference in the performance of two spectra type models, but the influence of the natural change of wood specimens stored in wood herbarium to the portable NIR model was indeterminate.
Five Cinnamomum species (Cinnamomum porrectum [Roxb.] Kosterm., Cinnamomum tenuipilum Kosterm., Cinnamomum camphora [L.] Presl., Cinnamomum glanduliferum [Wall.] Nees, and Cinnamomum longipetiolatum H. W. Li) from herbarium wood were selected to test the effectiveness of the portable NIR model. There are two principal aims in this research: one was to demonstrate the possibility of the identification of five Cinnamomum species by a portable NIR spectrometer, and the other one was to verify the influence of the natural surface change of the wood specimens to the species identification using portable NIR technology.
Materials and Methods
Sample Preparation and NIR Spectra Measurement
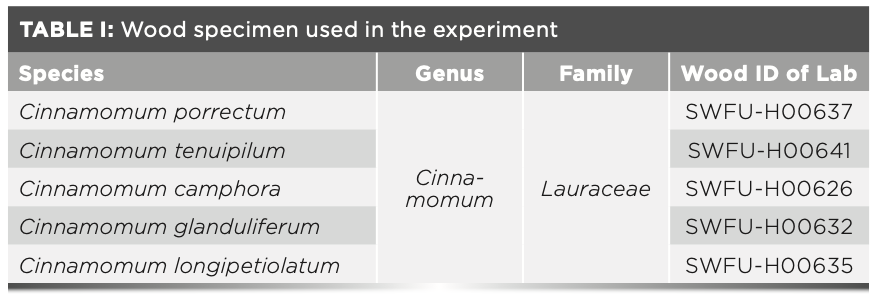
In this work, five Cinnamomum species (Cinnamomum porrectum, Cinnamomum tenuipilum, Cinnamomum camphora, Cinnamomum glanduliferum, and Cinnamomum longipetiolatum) were harvested from the wood herbarium of the Southwest Forestry University (Table I). For this study, 30 specimens with no defect were selected for each species. The specimens used were cut from different parts of the tree. The average size of the specimen is around 75 mm × 10 mm × 45 mm, and the total number of the specimens was 150. Prior to spectral measurement, two cross-sections were sanded with grit for each specimen. In addition, three species (Cinnamomum glanduliferum, Cinnamomum camphora, and Cinnamomum porrectum) were selected, and the spectra were obtained before and after sanding the sample surface.
The NIR spectra were collected with the MicroNIR on-site spectrometer (Viavi Solutions, Inc.) over a range of 908–1650 nm. For each of the 150 specimens, five spectra in different points on the cross-section were obtained, totaling 1500 raw spectra. In the present work, the average process was carried out for five raw spectra from the same cross-section. Therefore, there are 60 spectra for each species, and the training set included 40 spectra, with the test set composed of 20 spectra for each species.
Spectra Processing and Data Analysis
Spectra preprocessing is often indispensable in multivariate analysis, and it is a very important step in NIR quantitative and qualitative analysis. The appropriate NIR spectral preprocessing method can effectively improve the applicability of the model. The noise information in the NIR spectra can be filtered, and the effective information can be retained by a reasonable preprocessing method, thereby reducing the complexity of the NIR model and improving the robustness of the model. The commonly used NIR spectral pretreatment methods mainly include smoothing, derivatives, standard normal variate (SNV), and so on. To create high dependability for the discriminate model, the three different pretreatment methods (smoothing, first derivative, and SNV) and combinations of these three methods were carried out in this work.
Smoothing
Smoothing reduces the noise in the data without reducing the number of variables. In smoothing, X values are averaged over one segment symmetrically surrounding one data point. The raw value on this point is replaced by the average over the segment, thus creating a smoothing effect. The Savitzky-Golay smoothing was selected and accomplished using the Unscrambler X 10.4 software (CAMO) for this experiment.
The Savitzky-Golay algorithm fits a polynomial function to each curve segment, thus replacing the original values with more regular variations. The length of the segment (right and left of each data point), and the order of the polynomial can be selected. The polynomial order was three, the number of right and left side point was 10, and the number of smoothing points was 21 in this study.
Derivatives
Derivatives are applied to correct for baseline effects in spectra to remove non-chemical effects and create robust calibration models. Derivatives also resolve overlapped bands to provide a better understanding of the data and emphasize small spectra variations not evident in the raw data. The first derivative preprocess based on Savitzky-Golay derivative was carried out in this work.
The Savitzky-Golay derivative can be used to compute first, second, third, and fourth order derivatives. The Savitzky-Golay algorithm is based on performing a least squares linear regression fit of a polynomial around each point in the spectrum to smooth the data. The derivative is then the derivative of the fitted polynomial at each point. The algorithm includes a smoothing factor that determines how many adjacent data point variables will be used to estimate the polynomial approximation of the curve segment. The first derivative of a spectrum is a measure of the slope of the spectral curve at every point. The slope of the curve is not affected by purely additive baseline offsets in the spectrum, and thus the first derivative is an effective method for removing such offsets.
Standard Normal Variate (SNV)
SNV is a row-oriented transformation which removes scatter effects from spectra by centering and scaling individual spectra. Each value xk in row of data x is transformed according to equation 1:

Where xk is the raw values of data x, Mean(x) is mean values of data x, SDev(x) is the standard deviation of data x.
Partial Least Squares (PLS) for Discrimination Analysis (PLS-DA)
To better obtain the information of NIR spectra, PLS-DA was performed using the Unscrambler X 10.4 software (CAMO). PLS-DA involves developing a conventional partial least squares regression model, in which the Y vector is composed of a binary variable (0 and 1). The data matrix X is formed by the NIR spectra of the sample. If the variable takes the value of 1, the samples belong to that group and if a variable takes the value of 0, the sample is not a member of that group (17). The square of the correlation coefficient for calibration (validation) (R2), standard error of calibration (SEC), standard error of cross validation (SECV), the number of correct classifications, and the accuracy of classification models were used to evaluate the models.
Results
The NIR Spectra
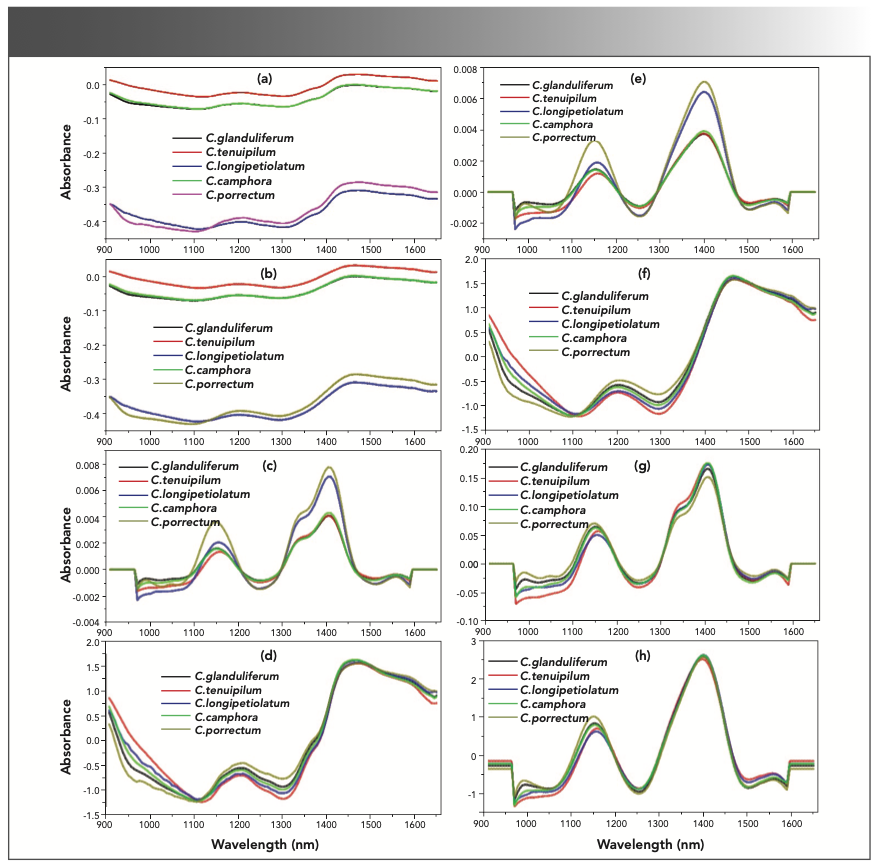
The characteristics of raw spectra and after they are preprocessed by different methods is shown in Figure 1. Compared with raw spectra, the spectra barely changed after the smoothing processing (1b), and it shows that there is a serious baseline drift. Other preprocessed methods allowed more specific identification of small and latent absorption peaks, which displayed the specificity of absorption peaks for certain bonding groups. Most of the different absorption of bands are a result of the differences in the chemical composition between the species, but it is clear that overlap between the bands in the same figure is significant. A visual inspection of the NIR spectra is not helpful for wood species identification, and it is very difficult to infer the chemical compounds responsible for the difference bands (peaks) and attribute these band variations to specific species. Therefore, it is necessary to use multivariate analysis for spectral analysis.
FIGURE 1: Mean spectra of same sample of five species preprocessed by different methods. (a) raw spectra, (b) processed by smoothing, (c) processed by first derivative, (d) processed by SNV, (e) processed by smoothing and first derivative combined, (f) processed by smoothing and SNV combined, (g) processed by SNV and first derivative combined; and (h) processed by smoothing, SNV, and first derivative combined.
PLS-DA Models
Table II shows the optimal number of factors for each model suggested by the software Unscrambler v10.4. (Note the c and p superscripts denote calibration and prediction, respectively.) The results of calibration and prediction models for discriminating five species based on raw spectra were quite poor: the R2c value was only 0.634 for Cinnamomum glanduliferum and 0.683 for Cinnamomum camphora. This result demonstrated the performance of the model based on raw spectra may not be enough for five species identification.

The results of calibration and prediction models for discriminating five species under three independent preprocess methods are shown in Table III. First, in contrast to the model created by raw spectra the R2c value of five species were decreased in the model created by the smooth preprocessed spectra.
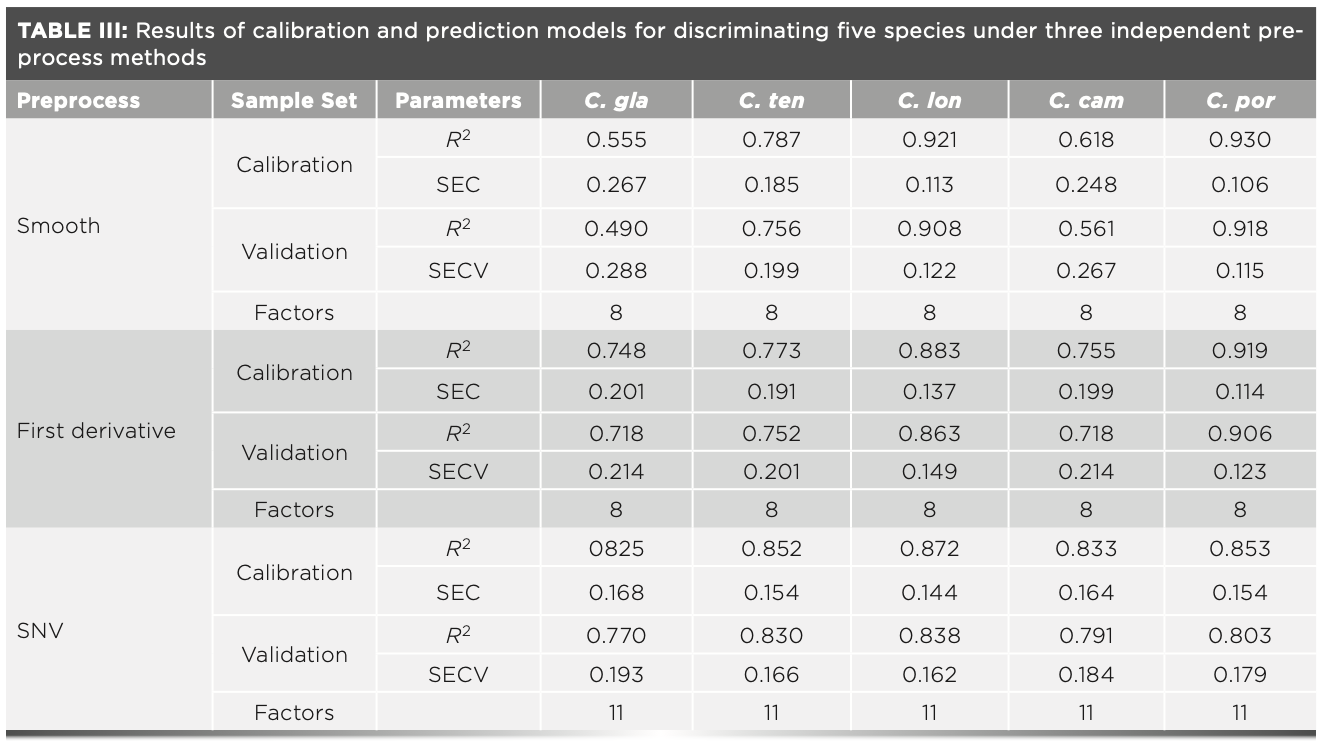
Second, the R2c value of Cinnamomum glanduliferum and Cinnamomum camphora were increased in the model created by the first derivative preprocessed spectra compared to the mode created by raw spectra, but the R2c value of another three species decreased. Third, the R2c value of Cinnamomum glanduliferum, Cinnamomum tenuipilum, and Cinnamomum camphora increased in the model created by the SNV preprocessed spectra, compared to the model created by raw spectra, but the R2c value of another two species decreased. After a single method was processed among five species, the R2 value of two or three species increased, whereas the R2 value of residual species decreased compare to the results of raw spectra. The holistic parameter value may be increased if the different preprocessing methods combined are used to treat spectra. As a result, the three preprocessing methods (smooth, first derivative, and SNV) combined to treat spectra were carried out to obtain a high performance PLS-DA model.
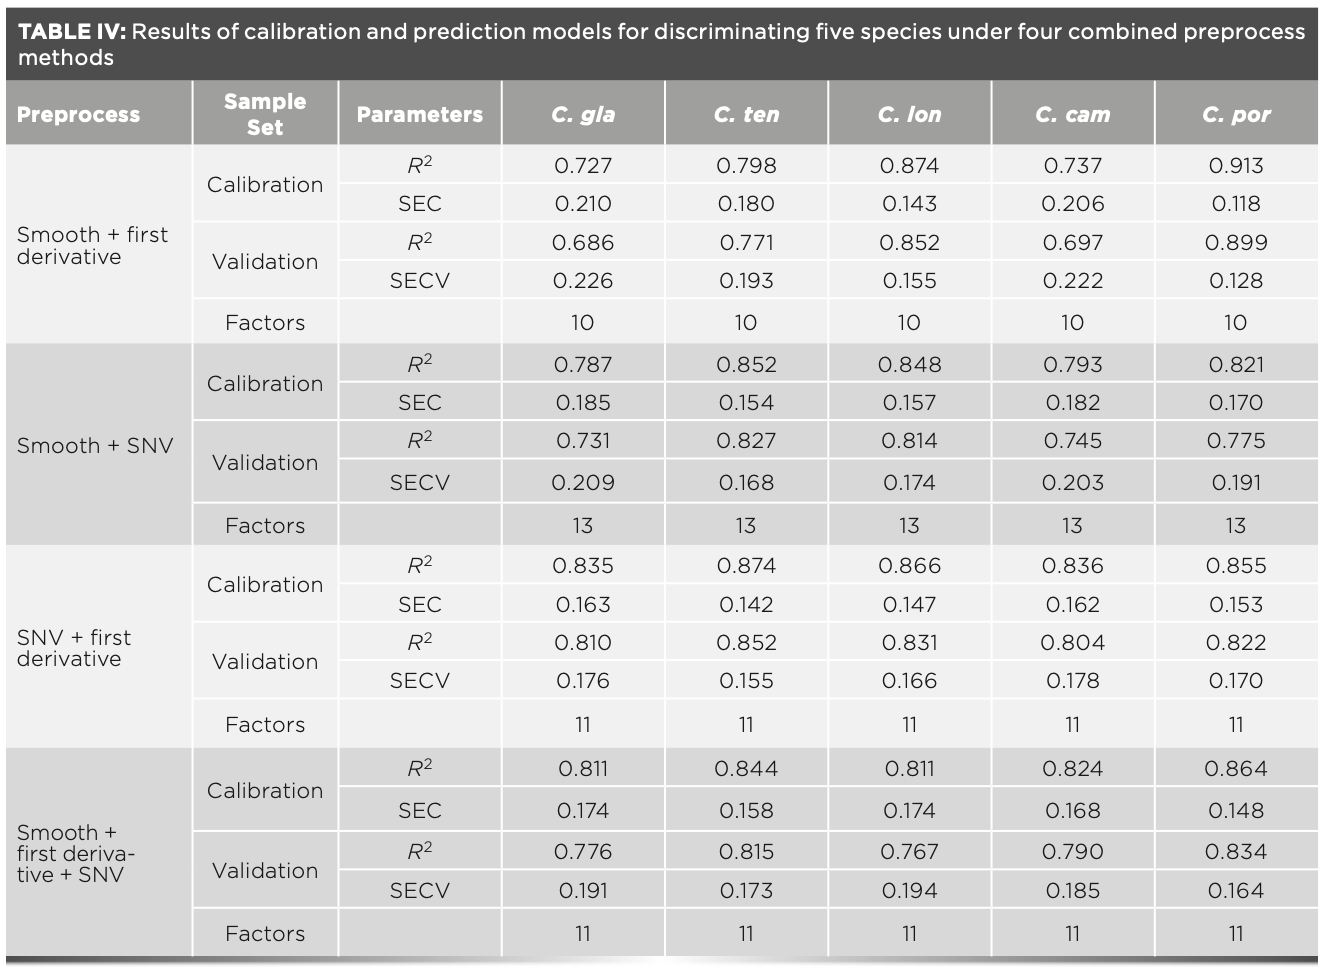
And the results of calibration and prediction models for discriminating five species under four combine preprocessing methods are presented in Table IV. Considering the parameter value of each species, and compared to Tables II and III, it is clear that the result of the model created by SNV and first derivative combined preprocessing were best, exhibiting a relative high R2c value (0.835 to 0.874) and R2p value (0.804 to 0.852), along with a relatively low standard error of calibration (SEC) value (ranged between 0.142 and 0.163) and standard error of validation (SECV) value (ranged between 0.155 and 0.178).
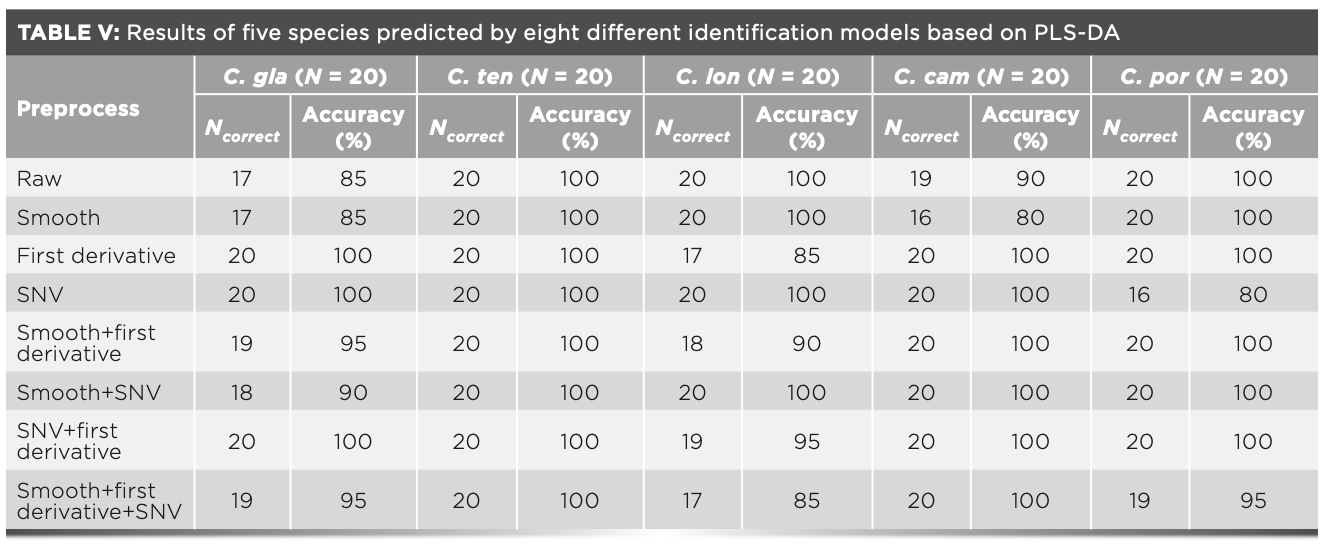
Then, the PLS-DA identification models based on raw spectra and spectra preprocessed using seven different methods were established, aiming to test the ability and accuracy of the models. Based on PLS-DA, the results of the unknown samples of five species predicted by identification models are presented in Table V. It is obvious that in the model created by the spectra preprocessed by SNV and first derivative combined, only one sample of Cinnamomum longipetiolatum was misclassificated into another species. The accuracy of the model was above 95%, the highest accuracy was obtained among eight PLS-DA models. This result indicated that the PLS-DA models had the ability to quickly predict and classify five similar Cinnamomum species.
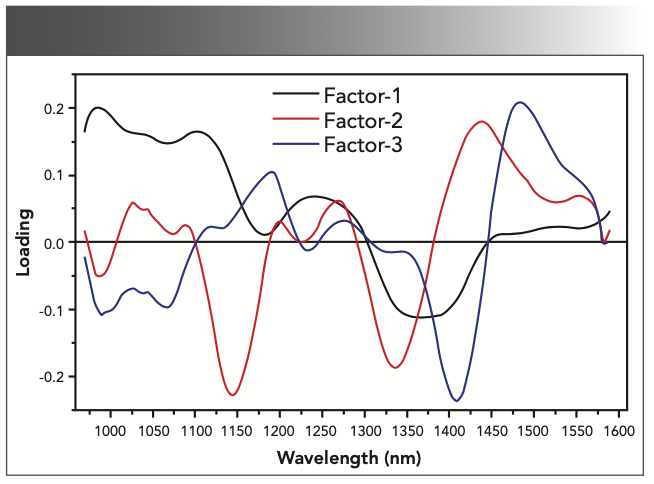
Scaled loading plots of first three factors of the spectra preprocessed by SNV and first derivative combine (factor 1 has a proportion of variance 83%; factor 2 has a proportion of variance 9%; and factor 3 has a proportion of variance 5%) are shown in Figure 2, which is a plot of X-loading weights for all the components compared to the variable number. If a variable has a large positive or negative loading weight, this means that the variable is important for the component concerned. If a variable has the same sign for all the important components, it is most likely to be an important variable. The highest accuracy was obtained in the model created by spectra preprocessed using SNV and first derivative (Table V). As a result, the loading plots of the first three factors (had a greater contribution to model) of the spectra preprocessed by SNV and first derivative combined was analyzed (Figure 2). From the point of view of factor 1, there existed significant peaks at approximately 982–1106 nm. For factor 2, the main absorptions were at 1025, 1267, and 1434 nm, and the important peaks were approximately 1186 and 1484 nm for factor 3.
FIGURE 2: Scaled loading plots of first three factors of the spectra preprocessed by SNV and first derivative combined. (Factor 1 has a proportion of variance of 83%; Factor 2 has a proportion of variance of 9%; and Factor 3 has a proportion of variance of 5%).
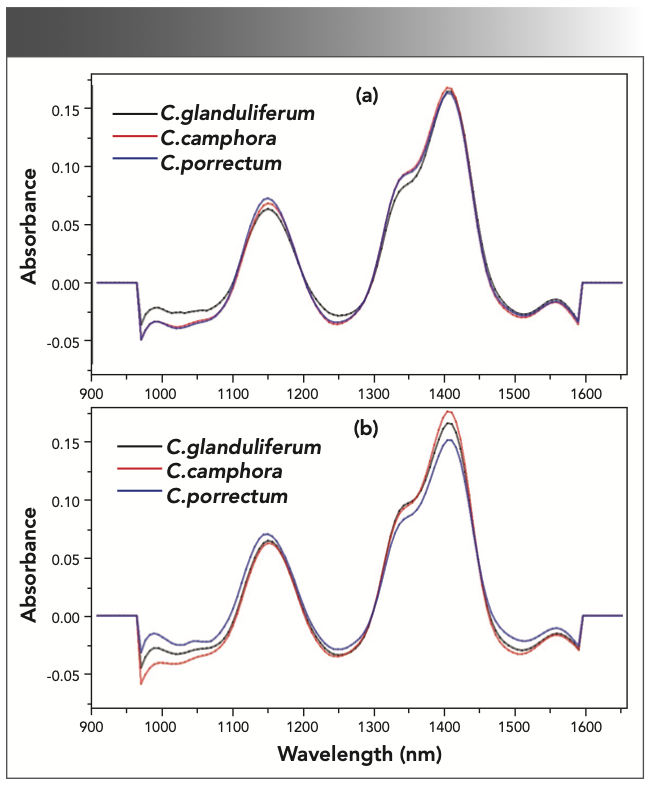
Three wood species (Cinnamomum glanduliferum, Cinnamomum camphora, and Cinnamomum porrectum) and their NIR mean spectra obtained before and after sanding based on SNV and first derivative combined preprocess were shown in Figure 3. The differences between the same specimen absorbance before and after sanding are displayed in Figure 3. For example, the change in absorbance of the Cinnamomum camphora bands located at 950–1000 nm, 1350 nm, and 1410 nm.
FIGURE 3: Three wood species showing NIR mean spectra obtained before and after sanding based on SNV and first derivative combined preprocessing. (a) spectra collected from no-sand specimens surface, and (b) spectra collected from sanded specimens surface.
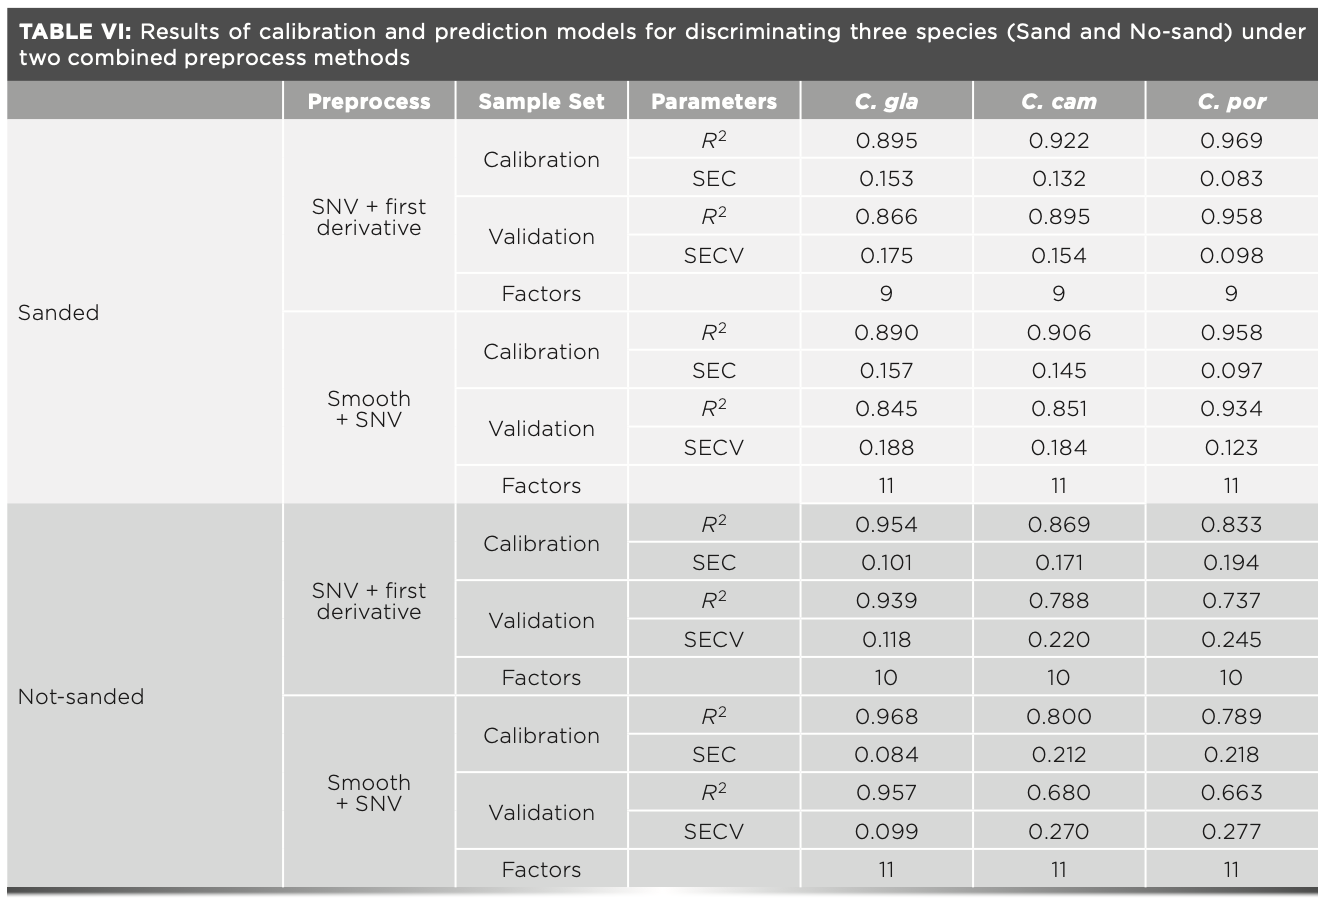
The results of calibration and prediction models for discriminating three species, sanded and not-sanded samples, under two combined preprocess methods (SNV and first derivative, smoothing and SNV) are shown in Table VI. It can be seen that the ing and SNV) are shown in Table VI. It can be seen that the R2c value of sanded samples were above 0.895, and the R2c value of not-sanded samples were above 0.833 for the model based on spectra preprocessed by SNV and first derivative combined. The R2c value of the sanded samples were above 0.890, and the R2c value of not-sanded samples were above 0.789 for the model based on spectra preprocessed by smoothing and SNV combined; the sanded sample provided better results than the unsanded (raw) sample. The identification results of unknown samples from three different species, sanded samples, and not-sanded samples using two types PLS-DA models were presented in Table VII. For the sanded samples, all samples were identified correctly for the two models. 100% accuracy was attached for all sanded samples. For the not-sanded samples, one sample of Cinnamomum camphora was misclassified into other species for the model created by the spectra preprocessed by SNV and first derivative combined, and one sample of Cinnamomum glanduliferum and one sample of Cinnamomum camphora were misclassified into other species for the model created by the spectra preprocessed after smoothing and SNV combined. The accuracy was 95% for not-sanded samples. Although two types of models are created from the spectra obtained from sanded and not-sanded specimens; samples that were sanded produced higher accuracy models in wood species identification using portable NIR technology.

The NIR spectra were collected from the cross-sections of wood specimens in this research. The cross-sections of hardwoods consisted of vessels cells, which have a longitudinal axis that is parallel to the direction of the NIR incident radiation. Therefore, the NIR radiation can travel further into the wood (20). Meanwhile, the sanding process reduces the roughness of cross-sections and exposes more vessels, so more information of the chemistry and structure of wood species can be obtained from the spectra of sanded wood samples. The model created by the spectra from the sanded samples was better than the model created by the spectra from the not-sanded ones.
This result was not consistent with the result Braga and others reported (12). Comparing the samples of their experiment, it can be seen that the main differences are the sample origin and storage conditions. The samples were cut from the ends of boards that were stored and then exported in the research of Braga and others.
The samples of this work are from the wood herbarium and stored here for many years under natural conditions, so natural surface changes can be seen in the sample surfaces. It is demonstrated that natural changes of a sample surface influence the performance of the NIR model for wood species identification using portable NIR technology.
Conclusion
Five similar Cinnamomum species from wood herbarium were correctly identified at species-level based on the portable NIR spectra preprocessed by SNV and first derivative combined. Evaluation of the models created by raw spectra and the spectra processed by a single method demonstrated the different preprocessing methods combined are useful for creating a portable NIR wood species identification model, and portable NIR spectroscopy combined with PLS-DA model can be used to rapidly and accurately identify five similar Cinnamomum species. From the practical point of view, further advancement of the method would examine the feasibility of identifying external wood samples based on models created by wood specimens from the wood herbarium. However, this study was limited in the number of wood specimens and the external origin of wood samples. The performance comparison of the three species sanded spectral model and the not- sanded spectral model demonstrated that creating a discriminant model using wood specimens from the wood herbarium was feasible. And the study suggests that specimen surface natural changes influence the NIR model performance. The natural change surface of specimens should be removed (samples sanded) to create NIR models with improved identification accuracy.
Acknowledgments
The study was supported by China National Natural Science Fund (Grant Numbers 31770766 and Grant Numbers 31370711). The authors thank the wood herbarium of Southwest Forestry University for the wood specimens supported.
References
(1) G.K. Jayaprakasha, L. Jagan Mohan Rao, and K.K. Sakariah, J. Agric. Food Chem. 51(15), 4344–4348 (2003).
(2) S.S. Cheng, C.Y. Lin, C.K. Yang, et al, J. Wood Chem. Technol. 35(3), 207–219 (2015).
(3) E.J. Doh, J.H. Kim, S. eun Oh, et al, J. Genet. Genomics 39(1), 101–109 (2017).
(4) M.K. Singh, M. Sharma, and C.L. Sharma, J. Indian Acad. Wood Sci. 12(2), 137–144 (2015).
(5) J. Sun, X.J. Wang, F. Wang, et al, J. South China Agric. Univ. 35(5), 102–107 (2014).
(6) I.W. Andianto, T.K. Waluyo, R. Dungani, et al, Asian J. Plant Sci. 14, 11–19 (2015).
(7) C.C. Wu, F.H. Chu, C.K. Ho, et al, Holzforschung 71(3), 189–197 (2017).
(8) S. Tsuchikawa and H. Kobori, J. Wood Sci. 61(3), 213–220 (2015).
(9) S. Tsuchikawa, Appl. Spectrosc. Rev. 42(1), 43–71 (2007).
(10) O.E. Adedipe, B. Dawson-Andoh, J. Slahor, et al, J. Near Infrared Spectrosc. 16(1), 49–57 (2008).
(11) T.C.M. Pastore, J.W.B. Braga, V.T.R. Coradin, et al, Holzforschung 65(1), 73–80 (2011).
(12) J.W.B. Braga, T.C.M. Pastore, V.T.R. Coradin, et al, Iawa J. 32(2), 285–296 (2011).
(13) Z. Yang, Z.H. Jiang, and B. Lü, Spectrosc. Spect. Anal. 32(9), 2405–2408 (2012).
(14) Y. Horikawa, S. Mizuno-Tazuru, and J. Sugiyama, J. Wood Sci. 61(3), 251–261 (2015).
(15) C.A. Teixeira dos Santos, R.N. Páscoa, M. Lopo, et al, Encyclopedia of Analytical Chemistry: Applications, Theory, and Instrumentation (John Wiley & Sons, Hoboken, NJ, 2006), pp. 1–27.
(16) D.C. Silva, T.C.M. Pastore, L.F. Soares, et al, Holzforschung 72(7), 521–530 (2018).
(17) F.A. Snel, J.W.B. Braga, D. da Silva, et al, Wood Sci. Technol. 52(5), 1411–1427 (2018).
(18) F.E. Barton, NIR News 27(1), 41–44 (2016).
(19) Z. Yang, Y.N. Liu, X.Y. Pang, et al, BioResources 10(4), 8505–8517 (2015).
(20) B. Leblon, O. Adedipe, G. Hans, et al, For. Chron. 89(5), 595–606 (2013).
Xi Pan and Zhong Yang are with the Research Institute of Wood Industry at the Chinese Academy of Forestry, in Beijing, China. Jian Qiu is with the College of Materials Science and Engineering at Southwest Forestry University, in Yunnan, China. Direct correspondence to Zhong Yang at zyang@caf.ac.cn. ●

Real-Time Battery Health Tracking Using Fiber-Optic Sensors
April 9th 2025A new study by researchers from Palo Alto Research Center (PARC, a Xerox Company) and LG Chem Power presents a novel method for real-time battery monitoring using embedded fiber-optic sensors. This approach enhances state-of-charge (SOC) and state-of-health (SOH) estimations, potentially improving the efficiency and lifespan of lithium-ion batteries in electric vehicles (xEVs).