The Use of Portable and Handheld Raman Spectroscopy for Forensic Investigations
Special Issues
The Raman technique is gaining widespread acceptance as an investigative tool for forensic applications.
The Raman technique is gaining widespread acceptance as an investigative tool for forensic applications. This article focuses on the use of portable and handheld Raman spectroscopy in the field of forensic science and illustrates it with real-world examples.
The benefits of Raman spectroscopy are well recognized for the molecular identification of unknown molecular compounds and as a result the technique is being used routinely in applications areas such as pharmaceutical manufacturing (1), raw material verification (2), detection of counterfeit drugs (3), medical diagnostics (4), characterization of polymers (5), and the quality control of food products (6). However, more recently the technique is gaining widespread acceptance as an investigative tool in the areas of forensic science and homeland security (7,8). On-board spectral libraries and intelligent decision-making software make Raman spectroscopy ideally suited to help law enforcement agencies better understand the source and nature of illicit materials. Today's Raman instrumentation is faster, more rugged, and less expensive, and the advances in component miniaturization have led to the design of portable devices with extremely high performance that can be taken out and used for field-based investigations. Therefore, this study focuses on the use of handheld Raman spectroscopy for the characterization and identification of samples encountered in various application areas related to forensic science.
The Role of Law Enforcement
Law enforcement agencies responsible for reducing the level of serious crime are being faced with more challenges than ever before. For example, new designer drugs are appearing on street corners around the world almost every day. Additionally, terrorism attacks using various explosive devices are being reported by the media around the globe on a regular basis. Also, a topic of international importance is the increase in production of counterfeit cancer, malaria, prescription, and over-the-counter (OTC) drugs, particularly in parts of the world that do not have the skill and expertise to detect them (9). As a result, there is clearly a need to investigate these events in a speedy and timely manner.
This fact is supported by investigations into the illegal use of both social and performance-enhancing drugs, where an identification needs to be made on the type and source of the material used as quickly as possible. Traditionally, test kits are used to obtain a positive indication of a particular drug for presumptive evidence purposes. Unfortunately, for some of the newer, more exotic, and designer drugs of abuse, specific test kits may not be available. Since limited testing can be carried out in the field, seized samples are subsequently sent to a state or federal laboratory for confirmatory analysis. Overburdened laboratories may require weeks or even months before test results reach the prosecutor's hands and, as a result, the pressure placed on analytical chemists to process samples as quickly as possible can be quite significant.
Forensic laboratories that provide evidence for the positive identification of these kinds of samples frequently use gas chromatography–mass spectrometry (GC–MS), which is considered the gold standard for the analysis of volatile organic compounds. However, even though GC–MS provides definitive results, it is a costly, destructive, laboratory-based technique that is extremely time-consuming and contributes to the backlog of samples, subsequently delaying the reporting of results back to law enforcement agencies waiting to prosecute cases.
For that reason, state-of-the-art analytical techniques being used for rapid screening and confirmatory identification are now being miniaturized and making their way into field instrumentation. The transition from laboratory-based to field-based analyzers allows law enforcement agencies to conduct reliable measurements at the point of use, lessening the burden on crime laboratories, reducing their sample backlog, and accelerating the prosecution process. One of the most exciting analytical techniques that is moving analysis away from the laboratory and into the field is portable Raman spectroscopy. Before we take a look at how this new technique is revolutionizing the forensic analysis landscape, let's take a brief look at its fundamental principles of operation.
Principles of Raman Spectroscopy
Similar to infrared (IR) absorption techniques, Raman spectroscopy measures vibrational, rotational, and other low-frequency modes of a molecule. Whereas IR spectroscopy is based on focusing a broad range of IR wavelengths of light on to the sample and measuring which ones are absorbed, a Raman spectrum is obtained by directing a single wavelength of light and collecting the resulting scattered light. The frequencies of the scattered light depend on the bond strength of the molecules, the mass of the bound atoms, and other factors such as intermolecular interactions. The pattern of vibrational and rotational frequencies from a molecule is highly characteristic of a given molecular species or the structural arrangement of those molecules and, as a result, can be used for the positive identification of that species or compound (10). Because of variations in Raman band intensities and overlapping bands, robust library searching algorithms are needed for reliable identification of samples. Unfortunately, with many sample types, baseline changes caused by fluorescence, scattering effects, and changes in the signal intensity with different power settings can interfere with the Raman measurements. For this reason it is very important that any portable or handheld Raman spectrometer is designed with an understanding that these kinds of potential interferences need to be addressed to handle real-world applications.
Instrumentation
This study examines the use of a handheld Raman spectrometer (TacticID, B&W Tek) to carry out the real-world testing of a group of forensic and homeland security–related samples. The fundamental principles of the device have been described in the open literature, but it is basically a field-ready, spectral analysis instrument specifically designed to enable the forensic analysis of unknown chemicals and narcotics. It is a compact spectrometer and integrated computing system weighing approximately 2 lb, and it allows for the confirmation of a sample in less than 30 s.
The system includes a 785-nm, 300-mW laser excitation source with a crossed Czerny-Turner spectrograph and a charge-coupled device (CCD) array detector. The system provides a stable signal with low background noise, which is very important when testing materials of a similar molecular structure such as narcotics, pharmaceuticals, or hazardous and explosive mixtures because of the potential for other components in the sample to increase the background noise and elevate the baseline through fluorescence or other photon scattering effects.
Figure 1: Raman spectra for two nitroamine high explosives (HMX and RDX) in red and green, respectively and 2,4,6-trinitrophenylmethylnitroamine (tetryl) in blue.
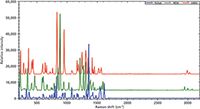
The system can be customized for specific forensic applications, but the standard configuration contains a library of spectral information generated from more than 4500 chemicals, toxic or hazardous materials, explosives, precursors, narcotics, pharmaceutical drugs, and cutting agents. For example, the hazardous or explosive materials in the spectral library include polynitro aromatics such as trinitrotoluene (TNT) and trinitrobenzene (TNB); nitrate esters or nitroamines such as RDX, Semtex, and nitroglycerin; and a number of different inorganic nitrates and chlorates. Examples of Raman spectra of three explosives in the database are displayed in Figure 1, which shows two nitroamines (HMX and RDX) in red and green, respectively, and 2,4,6-trinitrophenylmethylnitroamine (tetryl) in blue. The spectra have been offset for clarity purposes.
Figure 2: Raman spectra of three narcotics: a barbiturate (butabarbital) in red, a psychedelic drug (3-C bromo-dragonfly) in blue, and cocaine in green.
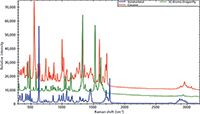
A system specifically designed for pharmaceutical and narcotics identification is available (TacticID-N, B&W Tek) that contains nearly 1000 spectra, including Class A drugs such as ecstasy, cocaine, methadone, and phencyclidine (PCP); Class B drugs like amphetamines and methylphenidate (Ritalin); and Class C drugs such as tranquilizers together with many OTC and prescription painkillers. Examples of Raman spectra of three narcotics are demonstrated in Figure 2, which shows a barbiturate (butabarbital) in red, a psychedelic drug (3-C bromo-dragonfly) in blue, and cocaine in green. Once again, all spectra are offset for clarity purposes.
Real-World Testing Procedures
Figure 3: Raman spectra of pure acetaminophen in red (reference) and Tylenol, an OTC pain medication containing acetaminophen, as the active ingredient in blue (sample), indicating a positive match.
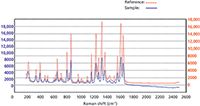
The testing procedure for real-world samples involves either using the supplied spectral libraries for reference and identification purposes or calibrating the device using pure forms of each of the chemical or drug compounds to develop user-defined libraries to test all the unknown materials under investigation. A proprietary software algorithm is included in the handheld unit in which the Raman spectrum is compared and matched with that in the library to generate a numerical hit quality index (HQI) value from which the result is determined. Analyzing samples in this way with spectral libraries ensures the identification of samples based on the Raman signature that can be related to the unique characteristics of the chemical materials, and provides a reliable testing procedure for unskilled operators required for the unambiguous identification of unknown materials. In routine use, the total scan time and decision making process takes approximately 30 s to make an assessment of a material and whether a match has been found. This is exemplified in Figure 3, which shows a Raman spectrum of pure acetaminophen in red (reference) and Tylenol (McNeil-PPC, Inc.), an OTC pain medication containing acetaminophen, as the active ingredient in blue (sample). The spectra have been offset slightly for clarity purposes, but it can be clearly seen that both spectra are almost identical, indicating a positive match.
Figure 4: Raman spectra of cocaine showing a positive match for a street sample (blue) compared to a reference spectra (red).
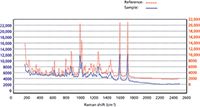
Figure 4 shows a positive match for a sample of cocaine (blue) compared to a reference standard (red). This spectrum was actually supplied by a major metropolitan law enforcement agency in the United States, whose police officers were using it for the identification of street drugs.
Figure 5: Raman spectrum of pure TNT in red (reference) and an explosive containing TNT in blue (sample), indicating a positive match and identification.
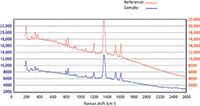
Figure 5 shows the identification of the explosive TNT. The Raman spectrum of reference TNT standard is shown in red, and the unknown sample is shown in blue. Once again it can be seen that both spectra are almost identical, indicating a positive match.
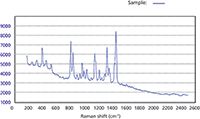
If a positive identification cannot be found because of a weak Raman signal or high fluorescence, or there is just no match in the spectral library, "no match" will be displayed on the screen. Figure 6 shows a Raman spectrum for which no reference match was found in the library. When this happens, the user can submit the spectrum for further analysis and after positive identification is made, the library can be updated.
Figure 6: Raman spectrum of an unknown sample where no reference match was found in the library.
Final Thoughts
There will always be a need for law-enforcement and homeland security agencies to characterize and identify narcotics and chemicals that have been used for illegal purposes. Whether they are drugs of abuse, performance-enhancing drugs, counterfeit prescriptions, OTC medications, or hazardous and explosive materials used in acts of terrorism, the source, nature, and classification of these materials is critical to unravel the crimes committed behind their use. Handheld Raman spectroscopy is proving that it is ideally suited for this task.
Katherine Bakeev, PhD, is the director of analytical services and support at B&W Tek in Newark, Delaware. Robert Thomas is the principal consultant at Scientific Solutions Inc., in Gaithersburg, Maryland. Direct correspondence to: katherineb@bwtek.com
References
(1) E. Lozano Diz, Pharmaceutical Manufacturing, January 2013. Available at: http://www.pharmamanufacturing.com/articles/2013/006/?page=full.
(2) D. Yang and R. Thomas, Am. Pharm. Rev. (2012). Available at: http://www.americanpharmaceuticalreview.com/Featured-Articles/126738-The-Benefits-of-a-High-Performance-Handheld-Raman-Spectrometer-for-the-Rapid-Identification-of-Pharmaceutical-Raw-Materials/.
(3) R. Kalyanaraman, M. Ribick, and G. Dobler, Eur. Pharm. Rev., "Non-destructive Materials Identification Supplement," 17(5), 11–15 (2012).
(4) R. Thomas, K. Bakeev, M. Claybourn, and R. Chimenti, Spectroscopy 28(9), 36–43 (2013).
(5) Vibrational Spectroscopy of Polymers: Principles and Practice, N.J. Everall, J. Chalmers, and P.R. Griffiths, Eds. (John Wiley and Sons, Chichester, UK, 2007).
(6) B. Diehl, C.S. Chen, B. Grout, J. Hernandez, S. O'Neill, C. McSweeney, J.M. Alvarado, and M. Smith, Eur. Pharm. Rev., "Non-destructive Materials Identification Supplement," 17(5), 3–8 (2012).
(7) E.L. Izaki, Forensic Sci. Int. 202, 1–8 (2010).
(8) J.F. Kelly, T.A. Blake, B.E. Bernacki, and T.J. Johnson, Int. J. Spectrosc. 2012, Article ID 938407 (2012).
(9) "Arrest in Cancer Drug Sales in Turkey," Wall Street Journal, February 14, 2014. Available at: http://online.wsj.com/news/articles/SB1000142405270230470380457938 3271726960510.
(10) Handbook of Raman Spectroscopy, I.R. Lewis and H.G.M. Edwards, Eds. (Practical Spectroscopy Series 28, Marcel Dekker, New York, 2001).
AI-Powered SERS Spectroscopy Breakthrough Boosts Safety of Medicinal Food Products
April 16th 2025A new deep learning-enhanced spectroscopic platform—SERSome—developed by researchers in China and Finland, identifies medicinal and edible homologs (MEHs) with 98% accuracy. This innovation could revolutionize safety and quality control in the growing MEH market.
New Raman Spectroscopy Method Enhances Real-Time Monitoring Across Fermentation Processes
April 15th 2025Researchers at Delft University of Technology have developed a novel method using single compound spectra to enhance the transferability and accuracy of Raman spectroscopy models for real-time fermentation monitoring.
Nanometer-Scale Studies Using Tip Enhanced Raman Spectroscopy
February 8th 2013Volker Deckert, the winner of the 2013 Charles Mann Award, is advancing the use of tip enhanced Raman spectroscopy (TERS) to push the lateral resolution of vibrational spectroscopy well below the Abbe limit, to achieve single-molecule sensitivity. Because the tip can be moved with sub-nanometer precision, structural information with unmatched spatial resolution can be achieved without the need of specific labels.