Use of Raman Microscopy to Characterize Extractables and Leachables
Spectroscopy
Raman microscopy, combined with X-ray fluorescence, can provide detailed information about extractables and leachables from medically implantable devices.
Any product used for medical purposes has to follow the adage “do no harm.” In the current work, we assess if and how Raman microscopy, in combination with X-ray fluorescence (XRF), can aid in the characterization of material leached from several implantable devices. The results show both the presence of metal oxides and organic compounds. In one case, two crystalline forms of an identical oxide existed simultaneously, and we suggest that such information may be useful in characterizing the oxidation of the metal. One of the samples was tinged pink, and its spectrum was consistent with a resonance Raman (RR) spectrum of a pigment. Because information on the source of these samples was not known, it is not possible to perform a complete characterization, but we can suggest ways that these results can be used in the future when a more complete study can be done.
Any product that comes in contact with the human body or with a product that is subsequently ingested, injected, or inserted into a human body has the potential to carry harmful products. If a polymer is part of an implant, it can release low molecular weight oligomers or additives that are present to engineer the polymer’s properties. If a drug product is contained in a polymer bag or vessel, especially if the drug is liquid, similar problems are possible. An implant is often composed of metallic parts that have the potential to oxidize, even if chipping is not likely. Metallic oxidation products from an implant can either chip away or be dissolved in fluids and carried from the site of the implant, or material from a metallic container can be ingested, injected, or inserted into a human body.
Pharmaceutical companies are constantly testing their products for extractables and leachables, both before FDA release and during the life of the product. Leachables are products that can be released by a product under normal ambient conditions. Extractables are products that are released under conditions designed to indicate worse case scenarios. For example, an implant can be immersed in a solution meant to mimic biological fluids, and then subjected to elevated temperatures to determine what can be forced out of that part; this would be called a leachable. Exposure to non-physiological solvents would produce extractables.
We will show here the results of a study of material leached from two implants, and indicate how this information can be of use to the biomedical community.
Description of the Samples
Two saline solutions of material leached from two different implants were examined. To aid in the interpretation of the Raman spectroscopy results, X-ray fluorescence (XRF) was also measured. Figure 1a shows the vials of solutions as received. Figure 1b shows some of these materials deposited on a stainless steel microscope slide.
Figure 1: (a) Vials with material extracted from two implants, and (b) deposit on a stainless steel slide.

Elemental analysis performed on an XG7200 (Horiba Scientific) showed that the elements in the green deposit were dominated by titanium, with some silicon, calcium, nickel, and sodium. The pink sample contains a lot of iron, aluminum, and sulfur, with some copper, chromium, manganese, and silicon, and small amounts of zinc and nickel.
Raman Analysis
As readers of this column are aware, Raman spectroscopy provides information on both organic and inorganic materials. In fact, the original concept of the Raman microscope (1) was to provide molecular identification of organic molecules, especially manufacturing contaminants that could not be analyzed by the standard microprobes in use at the time. Today, there are extensive Raman spectral libraries that can assist in the identification of unknowns, and even if a library does not provide a match, there are tools to aid in the assignment of functional groups (2).
The Raman spectrum of organic materials is separated into several characteristic regions. The region below 1500 cm-1 is called the fingerprint region, because the motions of all the atoms are coupled together, so it is not possible to assign a particular band in the spectrum to the motion of one or a few atoms. Between 1500 and 1800 cm-1, there are bands that can be assigned to the >C=C< and >C=O stretches (~1650 and ~1730 cm-1, respectively). Between 2000 and 2400 cm-1 are triple bonds, and close to 2500 cm-1 is the –SH stretch. Then there are CH stretches (2700–3100 cm-1), the NH stretch (~3350 cm-1), and the OH stretches (anywhere between 3100 and 3600 cm-1, depending on H-bonding).
Most of the bands of the Raman spectrum of inorganic materials fall below 1400 cm-1 but if there are hydroxyl groups, they will appear above 3000 cm-1, and the position and width of the bands will also depend on H-bonding.
In both cases, there are shifts and splittings of bands in the crystal phases, and it is important to point out that there is a significant number of inorganic materials in which there are not identifiable vibrating functional groups, so when these materials crystallize in different forms, the spectra are totally different. Examples are TiO2, ZrO2, and carbon (diamond vs. graphite). One of the examples that is shown below in one of the deposits illustrates this in the spectra of two phases of Al(OH)3.
Raman Analysis
Because the sample deposits did not have any good morphology on which to focus, I recorded maps in order to acquire a good sampling of representative spectra. Spectra were isolated from the maps using either classical least squares (CLS) or multiple curve resolution (MCR).
Pink Sample
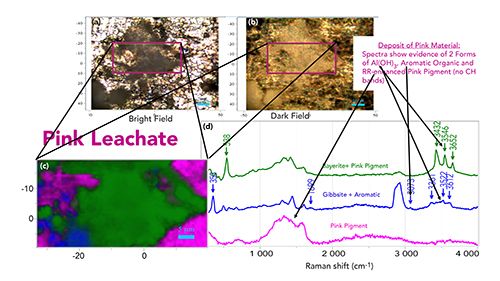
The top of Figure 2 shows both bright field and dark field micrographs of the region that was studied by Raman microscopy. While the sample in the vial had a weak pinkish color, that color is not seen in the micrographs. In bright field, one is essentially seeing the reflectivity of the sample, so it is not unusual so see bright areas where the sample is reflective and areas of different tones of gray from less reflective material; sometimes one can see color here if it is intense. In dark field, we are seeing light scattered from the periphery through the sample, and then up the bright field objective. The pink box in the micrograph is the region from which we collected spectra.
Figure 2: Analysis of pink leachate. (a) Bright field, and (b) dark field micrographs of an area of the pink leachate deposit. (d) Raman spectra derived from the mapped file showing the presence of two forms of Al(OH)3 (green and blue), organic material with both saturated and unsaturated functionality (blue) and a resonance Raman (RR) enhanced organic (pink). (c) The Raman map is color-coded to be consistent with the spectral display colors.

Figure 2 also shows the extracted spectra on the right and the rendered map on the left, using the spectral colors on the right; the spectra and map are color-coded, so that it is clear which spectrum corresponds to which region on the map. The OH bands in the green and blue spectra are good matches to the spectra of bayerite (blue) and gibbsite (green), two crystallographic forms of Al(OH)3.(3), and the fingerprint bands between 300 and 600 cm-1 are good matches as well. In the blue spectrum, there is a strong CH band below 3000 cm-1 indicating saturated organic material, and a small band at 3073 cm-1 indicating the presence of an aromatic. There are (unlabeled) bands in the blue spectrum near 1450 and 1600 cm-1, also consistent with these assignments of saturated organic and aromatic species. The spectrum in pink at the bottom of the figure is consistent with an aromatic, but because the CH region is weak and the strongest bands are between 1000 and 1700 cm-1, it is believed that this represents the resonance-enhanced spectrum of the pink pigment. Examination of the green spectrum indicates the presence of similar bands.
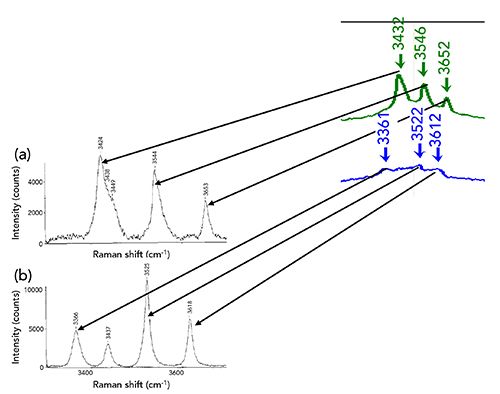
Figure 3 shows the Al(OH)3 bands from Figure 2 compared to the spectra in the cited publication, illustrating a remarkable match in spectral features.
Figure 3: The spectra of Al(OH)3 extracted from our map, and the spectra of the identified phases of Al(OH)3 reproduced from reference (3); (a) is bayerite, and (b) is gibbsite.

Figure 3 shows our spectra that we assign to the two phases of Al(OH)3, bayerite in green, and gibbsite in blue.
Green Sample
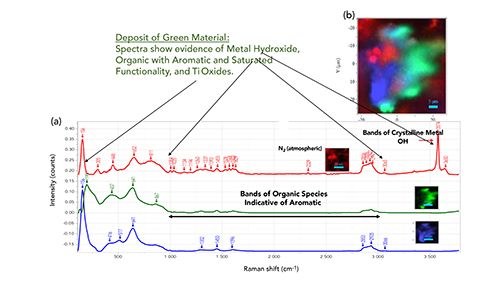
The map of this sample was treated in a manner similar to that of the pink sample. Three spectra were isolated and used to produce the Raman rendition shown in the upper right side of the figure. In this sample, there is also evidence for organic material with aromatic functional groups. (The band close to 2330 cm-1 is atmospheric nitrogen which is often seen in our spectra.). This sample also shows surprising behavior in the hydroxide region; there is a sharp band at 3574 cm-1, with a much weaker but fairly sharp band at slightly higher frequency. This sample was known to have a high content of titanium, and the low frequency region is consistent with an oxide of this metal, although not an exact match to any of the common phases. I made a considerable effort to assign the OH band, but was unsuccessful. However, in searching, I did find a very old article on the OH band in a series of metal hydroxides that occur in this region of the spectrum (± 50 cm-1) (4).
Figure 4: Analysis of green leachate. (a) shows the three spectra isolated from the map file; (b) shows the Raman rendition with colors matched to the colors of the spectra.

Discussion
There are several issues about this report that may be unsettling to analysts who need detailed answers to solve problems. At this point, I am unable to make firm assignments to neither the organic species nor the inorganic species. But because I really have no information on the implants from which these samples came, it seems gratifying that I can make any assignments at all. If I knew the composition of the implants (that is, the type of organic or polymeric material present), I would be in a better situation to identify these materials. What, for me, is surprising is that I am seeing hydroxides of the metals. The real question for the analyst is whether the identity of the hydroxides in these extracted samples is meaningful, or is just an artifact of the preparation of the slurries that we deposited on a slide. The use of a saline solution is, for sure, meant to mimic physiological conditions. The question is whether these species are coming off the implants in the states that we are observing, or are they flaking off in a different form and then changing in solution or during precipitation. Again, we need more information on the original implants, and then need to consult with a physical chemist who would understand the possible chemical and phase changes that are possible under what conditions.
Conclusion and Summary
I chose to do this pilot study on extractables and leachables because I am getting multiple meeting announcements per month on this topic, and the topic just spoke to me about the potential of Raman
microscopy to be helpful. What is surprising is that vibrational spectroscopy doesn’t seem to be exploited in this field for its potential. Maybe some of my readers can tell me I am wrong, or tell me why it is not being used.
References
- M. Delhaye and P. Dhamelincourt, J Raman Spectrosc. 3, 33–43 (1975).
- Bio-Rad KnowItAll Software. https://www.bio-rad.com/en-us/product/knowitall-software-analytical-edition?ID=N19OQWKSY
- H.D. Ruan, R.L. Frost, and J.T. Kloprogge, J. Raman Spectrosc. 32, 745–750 (2001).
- D. Krishnamurti, The Raman and Infrared Spectra of Some Solid Hydroxides Part II. Correlation with Crystal Structure, Memoir No. 119 from the Raman Research Institute, Bangalore, India.

Fran Adar is the Principal Raman Applications Scientist for Horiba Scientific in Edison, New Jersey. Direct correspondence to: SpectroscopyEdit@mmhgroup.com.

A Proposal for the Origin of the Near-Ubiquitous Fluorescence in Raman Spectra
February 14th 2025In this column, I describe what I believe may be the origin of this fluorescence emission and support my conjecture with some measurements of polycyclic aromatic hydrocarbons (PAHs). Understanding the origin of these interfering backgrounds may enable you to design experiments with less interference, avoid the laser illuminations that make things worse, or both.
Raman Microscopy for Characterizing Defects in SiC
January 2nd 2025Because there is a different Raman signature for each of the polymorphs as well as the contaminants, Raman microscopy is an ideal tool for analyzing the structure of these materials as well as identifying possible contaminants that would also interfere with performance.