A Label- and Enzyme-Free Fluorescent Method for the Rapid and Simple Detection of Hg2+ in Cigarettes Using G-Triplexes as the Signal Reporter
Spectroscopy
A novel method was developed for detecting Hg2+ in tobacco, with potential application to mercury detection in environmental water samples.
Knowledge about the quantity of Hg2+ in tobacco is important for the health of smokers. Thus, a novel G-triplex-based label- and enzyme-free fluorescent method was developed for detecting Hg2+ in tobacco. In this system, the target Hg2+ ions associate with the DNA complex that serves as a probe through formation of specific thymine-Hg2+-thymine (T-Hg2+-T) base pairing, which results in the release of the P2- containing G-triplexes. Subsequently, fluorescence enhancement is achieved by producing G-triplexes, which bind with thioflavine T (ThT). A detection limit of 0.2 nM was achieved within 40 min. The method has been successfully applied to the detection of mercury in tobacco. At this time, the application for detecting Hg2+ in tap and river water samples also indicates that further applications are anticipated.
In recent years, the development of non-ferrous metal minerals, coal-fired flue gas, and solid waste incineration have increased the production of heavy metals and toxic substances in the environment, resulting in increased risk of excessive levels of mercury in tobacco (1–4). This can impart a sizable health risk to smokers when too much mercury, present as Hg2+, is deposited in tobacco (5–7). Therefore, it is important to be able to provide rapid and simple detection of the quantities of Hg2+ in tobacco.
Conventional trace Hg2+ detection methodologies include the use of atomic fluorescence spectrometry (AFS), atomic absorption spectroscopy (AAS), and inductively coupled plasma–atomic emission spectrometry (ICP-AES), but the instrumentation required for such approaches is expensive, and the process is complicated, which limits the application into a broader range of areas. At the same time, colorimetric sensor technology (8–10), electrochemical sensors (11–14), and fluorescence sensors (15–18) have also been developed for the detection of mercury ions. For example, Zhu and associates developed a strategy to detect Hg2+ using a highly sensitive colorimetric sensor based on the aggregation of gold nanoparticles driven by cationic polymers (9). The method has the advantages of high efficiency and speed, but requires additional capital investment and more time. Bao and colleagues developed an electrochemical aptamer sensor for Hg2+ detection, which makes use of an exonuclease to achieve cycling and amplification, but the enzyme was found to be difficult to store and was easily inactivated (13). To solve the above problems, a fluorescence method (19–25), which has advantages such as stability, simplicity, and rapid detection, has been successfully used for profiling low levels of Hg2+. For example, Wang and colleagues developed a DNA-fueled molecular machine for fluorescent detection of Hg2+ (19), Chen and associates reported a gold nanorods-based FRET assay for ultrasensitive detection of Hg2+ (24). However, the cumbersome fluorophore labeling contributes to making the experimental process more complicated. Therefore, it was imperative to develop an enzyme-free and label-free fluorescence method for the detection Hg2+.
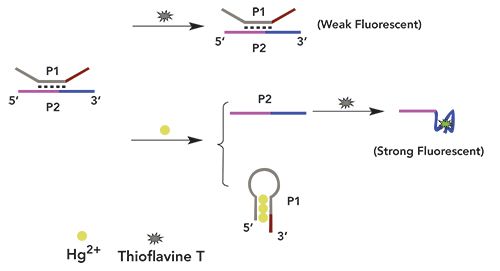
In the present study, a simplified approach that makes use of a fluorescence probe based on the G-triplex structure to detect Hg2+ with high sensitivity is reported. The P1 chain is composed of a large number of T bases, which are bound by Hg2+ to form a stable hairpin structure, ThT. The terminal end of the P2 strand was packed with abundant G sequences, which combine to produce enhanced fluorescence in the presence of ThT. Thus, a label- and enzyme-free strategy was implemented for simple and rapid detection of Hg2+, avoiding a cumbersome labeling process and avoiding the use of G-triplex enzymes. Moreover, the method has been successfully applied to the detection of mercury in both tobacco and water samples, which indicates that broader applications of this method are anticipated.
Materials and Methods
Materials
The polyacrylamide gel electrophoresis (PAGE)-purified P1, d(CATTCAATACTTTGGGTACTTCATCATCACTTCCCATTGTATTGAATTAGATCTTCGTA), and the polyacrylamide gel electrophoresis (PAGE)-purified P2, d(CCACATACATCATATTCTCTCATTCAATACAATGGGTAGGGCGGG), were obtained from Sangon Biotechnology Co., Ltd., the P1 and P2 were designed according to previous literature (19). The documentation pertaining to the indicated amino acid sequences is available on the supplier website. The salts used to prepare the ionic solutions, including KCl and Hg (NO3)2, and trishydroxymethylaminomethane hydrochloride (Tris-HCl) were purchased from Comio Chemical Reagent Co., Ltd. ThT was supplied by J&K Scientific Co., Ltd.
Instrumentation
DNA fluorescence intensity was measured at the excitation band of 420 nm using a spectrofluorophotometer (RF-5301pc, Shimadzu), in which the slits were set to 5.0 and 5.0 nm for excitation and emission, respectively. The method was evaluated at the fluorescence intensity of 490 nm, which has been demonstrated to be the maximum emission intensity. Absorbance spectral measurements were obtained on a UV-2450 spectrophotometer (Shimadzu Co.).
Fluorescence Measurements
P1 and P2 were diluted in Tris-HCl buffer, heated to 95 °C for 5 min. and then cooled slowly to room temperature for 1 h. Then 250 µL reaction samples containing P1 and P2 with different concentrations of Hg2+ were prepared in Tris-HCl buffer followed by incubation at 35 °C for 40 min. The fluorescence intensity of ThT was measured in the spectral region 460–580 nm, where the maximum emission was at 490 nm.
Real Sample Analysis
Initially, 0.2000 g of dried tobacco samples and 5.0 mL of concentrated nitric acid and 1.5 mL of hydrogen peroxide were combined in polytetrafluoroethylene (PTFE) high-pressure digestion tanks, and were digested in a microwave digestion apparatus. A graphite furnace electrothermal acid meter was used to catch acid at 120 °C. After 30 min, the sample was centrifuged (10000 r/min) and filtered through a 0.22 μm microporous membrane to eliminate possible interference factors, and the volume was adjusted to 100 mL with an appropriate amount of distilled water. A volume of 100 μL of the above-mentioned shredded tobacco digestion solution was taken, and mixed with 100 μL of probe solution, 200 μL of Tris-HCl buffer solution (pH 7.0), and to that added an appropriate volume of distilled water to a final volume of 1 mL. After being allowed to stand for 10 min, the sample was transferred to a quartz cuvette and the absorbance spectrum measured.
Under optimal conditions, it was necessary to filter the river samples to avoid insoluble impurities. In the recovery tests, aliquots of tap and river water samples together with the fluorescent probe with different concentrations (10, 20, 30 nM) of Hg2+ were added to the probe solutions and incubated for 40 min. All other reaction conditions were the same as in the above procedures.
Results and Discussion
Fluorescence Detection of Hg2+ Design Mechanisms
Scheme 1 illustrates the operating principle of the proposed method for rapid label- and enzyme-free Hg2+ detection. The P1 chain is composed of a large number of T bases, which are bound by Hg2+ to form a stable hairpin structure ThT. The terminal end of the P2 strand was packed with abundant G sequences, which combine to enhance the fluorescence intensity in the presence of ThT. Thus, when there was no target, a weak fluorescence intensity was be observed. However, when the target was added, the fluorescence intensity was enhanced significantly.
Scheme 1: Diagram of the probe-based G-triplet for detecting Hg2+
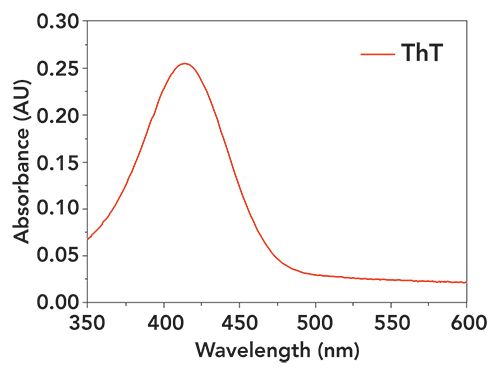
To demonstrate the method, Hg2+ was detected by assessing the changes in fluorescence intensity before and after adding Hg2+. As shown in Figure 1, when there was no target, a weak fluorescence intensity was observed. When the target was added, the fluorescence intensity was enhanced significantly. At the same time, to further verify feasibility of the experiment, the absorption spectrum of ThT, in which the maximum absorption peak was 420 nm, was verified as shown in Figure 2.
Figure 1: Fluorescence intensity of samples under different conditions. From bottom to top: (a) P1 + P2 (red), and (b) P1+P2+Target (black). The concentrations of P1 and P2 were both 100 nM. All the above solutions were incubated in Tris-HCl buffer at 35 °C for 40 min followed by fluorescence measurement.
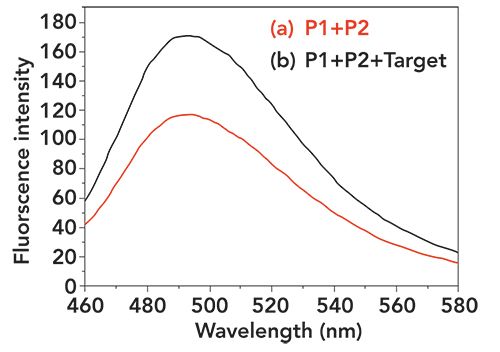
Figure 2: UV-vis absorbance spectrum of ThT. The molar concentration of ThT is 5 μM, which is obtained by ultrapure water dilution.
Optimization of the Experimental Conditions
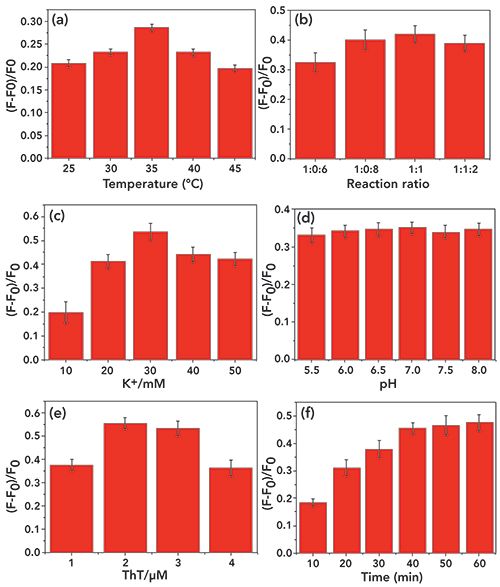
For measurement of the enhanced fluorescence intensity, the reaction temperature was found to be a key factor affecting the fluorescence intensity. As shown in Figure 3a, the fluorescence intensity is strongest at 35 °C. Thus, 35 °C should be used as the optimum reaction temperature for subsequent experiments. At the same time, as seen in Figure 3b, an optimal reaction ratio between P1 and P2 can be considered to be 1:1. In addition, we also tested the effect of K+ concentration and pH and ThT concentration on fluorescence intensity. As shown in Figures 3c, 3d, and 3e, the fluorescence intensity reached a maximum at a K+ concentration of 30 mM, and an optimum at pH = 7, and 2 µM can be considered as the optimum concentration of ThT. At the same time, the reaction (incubation) time was also optimized and extended from 10 min to 60 min, as shown in Figure 3f, where the fluorescence intensity gradually increased up to 40 min. The fluorescence intensity plateaued after 40 min and thus was selected as the optimum time for incubation.
Figure 3: Optimization of the experimental conditions: (a) the hybridization temperature, (b) the reaction ratio, (c) the concentrations of K+, (d) pH, (e) the concentrations of ThT, and (f) the reaction time. The error bar represents the standard deviation of three measurements. All the above solutions were incubated in Tris-HCl buffer followed by fluorescence measurement.
Assay Performance of the System
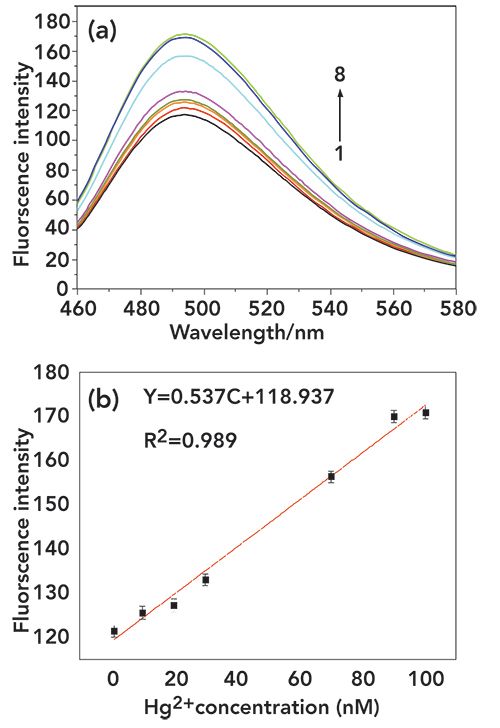
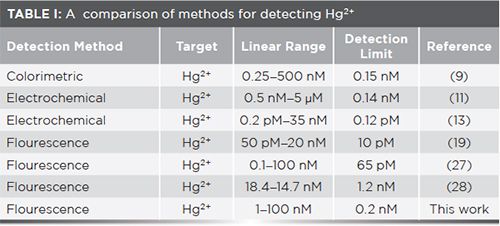
To understand the sensitivity of this strategy, the change in fluorescence intensity of Hg2+ at 420 nm was used to quantitatively detect the Hg2+ concentration. From Figure 4, the fluorescence intensity is enhanced with addition of increasing Hg2+ concentration. When the Hg2+ concentration was increased incrementally from 1 nM to 100 nM, the intensity increased linearly, with a linear regression equation of Y = 0.573C + 118.937 (R2 = 0.989), where Y and C represent fluorescence intensity and Hg2+ concentration, respectively. The detection limit for Hg2+ was calculated to be 0.2 nM (3 δ/k) and the results of from methods previously reported for Hg2+ detection were compared, as listed in Table I.
FIgure 4: (a): The fluorescence intensity variation for the assay of Hg2+ at different concentrations (0 nM, 1 nM, 10 nM, 20 nM, 30 nM, 70 nM, 90 nM, and 100 nM from 1 to 8). (b): The resulting calibration curve for fluorescence intensity. The error bar represents the standard deviation of three measurements. The concentrations of P1, P2 were both 100 nm. All of the above solutions were incubated in Tris-HCl buffer at 35 °C for 40 min followed by fluorescence measurement.
Selectivity of Hg2+ Detection
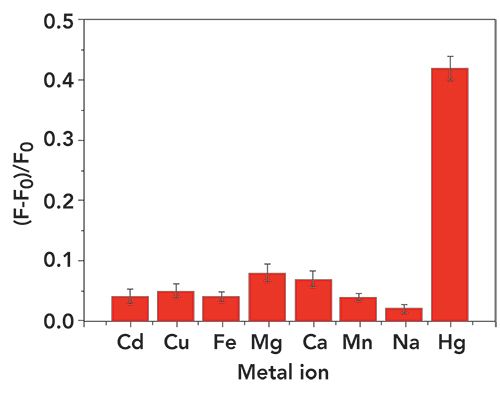
Selective detection represents a critical performance characteristic to verify this strategy. To selectively distinguish between Hg2+ and other interfering metal ions (Cd2+, Cu2+, Fe2+, Mg2+, Ca2+, Mn2+, Na+), we conducted a series of control experiments and the results are summarized in Figure 5. These represent a good illustration of the selectivity for Hg2+ and further demonstrates the feasibility of the present strategy.
Figure 5: Selectivity of the assay for Hg2+. The concentrations of Hg2+ sequence and other interfering metal ions are both 100 nM. The error bar represents the standard deviation of three measurements. The concentrations of P1 and P2 were both 100 nM. All the above solutions were incubated in Tris-HCl buffer at 35 °C for 40 min followed by fluorescence measurement.
Analysis of Real World Samples
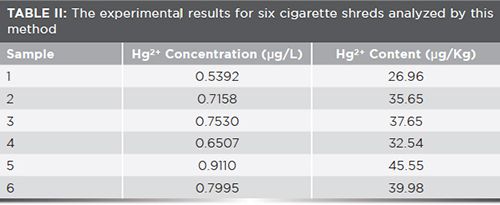
To examine the feasibility of the developed fluorescence probe, we analyzed real samples. Six cigarette shreds on the market were measured by this method. As summarized in Table II, the average content of Hg was found to be 36.41 µg/kg in the tested tobacco, which indicates considerable exposure to the smoker if smoking cigarettes for a long time.
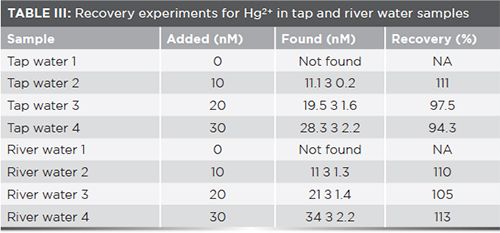
In addition, two real samples of tap and river water were also analyzed to assess the feasibility of the strategy. Various concentrations of Hg2+ (10, 20, and 30 nM) were added to tap and river water, and the results are shown in Table III. Appreciable recovery was detected, indicating that the method based on G-triplex can be successfully applied to real samples.
Conclusion
A G-triplex-based fluorescence strategy for the detection of Hg2+ is reported, that avoids cumbersome labeling procedures and unstable enzymes. At the same time, the probe also demonstrates good sensitivity and selectivity for the detection of Hg2+. The limit of detection was found to be 0.2 nM with a wide linear range from 1 nM to 100 nM (R2 = 0.989). We believe that this strategy provides support for ion detection based on G-triplex probes.
Acknowledgment
This work was supported by the Basic Research Foundation of Yunnan Province (Nos. 2016CP021, 2017FD236), the Project Foundation of Yunnan Key Laboratory of Tobacco Chemistry (KCFZ-2017-1096) and the Basic Research Foundation of China Tobacco Yunnan Industrial Co., Ltd. (No. 2019XY01, 2018JC04).
References
- S. Haque, M. Zeyaullah, G. Nabi, P.S. Srivastava, and A. Ali, J. Microbiol. Biotech.20, 917–924 (2010).
- E.M. Suszcynsky and J.R. Shann, Environ. Toxicol. Chem. 14, 61–67 (1995).
- J.Z. Wang, S. Y. Ren, G.F. Zhu, L. Xi, Y.G. Han, Y. Luo, and L.F. Du, J. Mol. Struct.1052, 85–92 (2013).
- J.-j. Deng, Y. Zhang, J.-w. Hu, Y. Yi, X.-k. Su, X.-f. Huang, and F.-x. Qin, Hubei Agr. Sci. 48, 1171–1175 (2009).
- Y. Xu, X. Niu, H. Zhang, L. Xu, S. Zhao, H. Chen, and X. Chen, J. Agr. Food Chem. 63, 1747–1755 (2015).
- X. Hu, W. Wang, and Y. Huang, Talanta 154, 409–415 (2016).
- Y. Liu, O. Q, H. Li, M. Chen. Z. Zhang, and Q. Chen, J. Agr. Food Chem.66, 6188–6195 (2018).
- W. Feng, X. Xue, and X. Liu, J. Am. Chem Soc.130, 3244–3245 (2008).
- Y. Zhu, Y. Cai, Y. Zhu, L. Zheng, J. Ding, Y. Quan, L. Wang, and B. Qi, Biosens. Bioelectron.69, 174–178 (2015).
- W. Ren, Y. Zhang, W. T. Huang, N. B. Li, and H. Q. Luo, Biosens. Bioelectron.68, 266–271 (2015).
- Y. Lv, L. Yang, X. Mao, M. Lu, J. Zhao, and Y. Yin, Biosens. Bioelectron.85, 664–668 (2016).
- F. Tan, L. Cong, N. M. Saucedo, J. Gao, X. Li, and A. Mulchandanib, J. Hazard. Mater.320, 226–233 (2016).
- T. Bao, W. Wen, X. Zhang, Q. Xia, and S. Wang, Biosens. Bioelectron.70, 318–323 (2015).
- A. Shirzadmehr, A. Afkhami, and T. Madrakian, J. Mol. Liq.204, 227–235 (2015).
- W. Yun, W. Xiong, H. Wu, M. Fu, Y. Huang, X. Liu, and L. Yang, Sensor. Actuat. B-Chem.249, 493–498 (2017).
- M.D.L. Cruz-Guzman, A. Aguilar-Aguilar, L. Hernandezad-Ame, A. Bañuelos-Frias, F.J. Medellín-Rodríguez, and G. Palestino, Nanoscale Res Lett. 9, 431 (2014).
- H. Dai, Y. Shi, Y. Wang, Y. Sun, J. Hua, P. Ni,and Z. Li, Biosens. Bioelectron.53, 76–81 (2014).
- Q. Fang, Q. Liu, and X. Song, Luminescence 30, 1280–1284 (2016).
- S. Wang, X. Li, J. Xie, B. Jiang, R. Yuan, and Y. Xiang, Sensor. Actuat. B- Chem.295, 730–735 (2018).
- B. Adhikarl and A. Banerjee, Chem. Mater.22, 4364–4371 (2010).
- Y. Cai, L. Yan, G. Liu, H. Yuan, and D. Xiao, Biosens. Bioelectron. 41, 875–879 (2013).
- X. M. Li, R. R. Zhao, Y. L. Wei, D, Yang, Z.J. Zhou, J.F. Zhang, and Y. Zhou, Chinese Chem. Lett. 27, 813–816 (2016).
- G. K. Wang, Q. L. Mi, L. Y. Zhao, J. J. Hu, L. E. Guo, X. J. Zou, B. L. Xiao, and P. Y. Zhou, Chem.–Asian J.9, 744–748 (2014).
- G. Chen, Y. Jin, L. Wang, J. Deng, and C. Zhang, Chem. Comm.47, 12500–12502 (2011).
- P.I. Girginova, A.L. Daniel-da-Silva, C.B. Lopes, P. Figueira, M. Oteroa, V.S. Amaral, E. Pereiraa, and T. Trindadea, J. Colloid Interf. Sci. 345, 234–240 (2010).
- T. Yu, T.T. Zhang, W. Zhao, J.J. Xu, and H.Y. Chen, Talanta165, 570–576 (2017).
- A. Han, X. Liu, G.D. Prestwich, and L. Zang, Sensor. Actuat. B-Chem. 133, 274–277 (2014).
- S. Wang, B. Lin, L. Chen, N. Li, J. Xu, J. Wang, Y. Yang, Y. Qi, Y. She, X. Shen, X. Xiao, Anal. Chem.90, 11764–11769 (2018).
Hui Zhao and Yang Zhao are with the Key Laboratory of Tobacco Chemistry of Yunnan Province, at the Yunnan Academy of Tobacco Science, in Kunming, in the People’s Republic of China. Xiaoxi Si, Juan Li, Yuanxing Duan, Wei Jiang, Chunbo Liu, Junheng You, Zhenjie Li, and Qinpeng Shen are with Tobacco Yunnan Industrial Co., in Kunming, in the People’s Republic of China. Direct correspondence to: ashb345@126.com

New Study Reveals Insights into Phenol’s Behavior in Ice
April 16th 2025A new study published in Spectrochimica Acta Part A by Dominik Heger and colleagues at Masaryk University reveals that phenol's photophysical properties change significantly when frozen, potentially enabling its breakdown by sunlight in icy environments.
Tracking Molecular Transport in Chromatographic Particles with Single-Molecule Fluorescence Imaging
May 18th 2012An interview with Justin Cooper, winner of a 2011 FACSS Innovation Award. Part of a new podcast series presented in collaboration with the Federation of Analytical Chemistry and Spectroscopy Societies (FACSS), in connection with SciX 2012 ? the Great Scientific Exchange, the North American conference (39th Annual) of FACSS.
New Fluorescence Model Enhances Aflatoxin Detection in Vegetable Oils
March 12th 2025A research team from Nanjing University of Finance and Economics has developed a new analytical model using fluorescence spectroscopy and neural networks to improve the detection of aflatoxin B1 (AFB1) in vegetable oils. The model effectively restores AFB1’s intrinsic fluorescence by accounting for absorption and scattering interferences from oil matrices, enhancing the accuracy and efficiency for food safety testing.
Can Fluorescence Spectroscopy Evaluate Soil Dissolved Organic Matter Dynamics?
February 20th 2025A new study published in Chemical Engineering Journal by researchers from Northeast Agricultural University in China reveals that biochar aging, influenced by environmental factors like UV exposure and wet-dry cycles, alters dissolved organic matter composition and affects its effectiveness in remediating cadmium-contaminated soil.
Geographical Traceability of Millet by Mid-Infrared Spectroscopy and Feature Extraction
February 13th 2025The study developed an effective mid-infrared spectroscopic identification model, combining principal component analysis (PCA) and support vector machine (SVM), to accurately determine the geographical origin of five types of millet with a recognition accuracy of up to 99.2% for the training set and 98.3% for the prediction set.