Using Information-Based Classifications to Distinguish Characteristics of Raw Agricultural Materials by Near-Infrared Spectroscopy
Near-infrared (NIR) spectroscopy is a promising technique for identifying raw agricultural materials. However, it is rarely used because of its poor discriminant rate. In this study, we took tobacco leaves from five origins as experimental materials. An origin discriminant model by the discriminant partial least squares (DPLS) was established, and the correct discriminant rate of internal cross validation was 76.54%. Origins were divided into three groups. The discriminant model of the three groups was improved, and the correct discriminant rate of internal cross validation was 98.77% along with a 100% external validation rate. We analyzed the characteristics of the three groups’ average spectra under normal variable pretreatment and found they have different absorption characteristics in different regions, and that the classification is information-based. The results show that using information-based classifications can establish a better model, and that main chemical components and NIR spectra can determine whether the classification is information-based, and whether projection based on principal component and Fisher criterion (PPF), can be more effective.
Near-infrared (NIR) light is an electromagnetic wave with a wavelength in the range of 780 to 2526 nm (1). The NIR spectrum absorbs the doubled and combined frequency of hydrogen-containing group vibrations and contains information on the composition of most organic compounds (1). NIR analytical technology is a fast and nondestructive technology for material analysis, and it can conduct two types of analysis: quantitative and qualitative (2). Using NIR qualitative discrimination, the source, type, storage time, grade, and identity of a sample can be determined. The use of NIR spectroscopy to qualitatively discriminate samples has been extensively studied; such studies have considered the varieties of strawberries (3), the origins of jujube (4), the origins of fritillaria (5), the classification of bamboo (6), and explored many other areas (7–11). In addition to NIR analysis technology, methods commonly used to distinguish the characteristics of agricultural products include electronic nose technology (12) and mineral element fingerprint analysis (13), among others.
Qualitative discrimination of agricultural raw materials not only help identify the authenticity, quality, and grade of the agricultural raw materials, but they also facilitate the classification and grading of the market as well as the breeding of varieties, among other processes. Qualitative discrimination of agricultural raw materials is also conducive to stable large-scale industrial production in terms of acquisition and processing. However, in actual production, not many types of at- tributes can be identified (generally only those that differ greatly); the recognition accuracy is not high (for some attribute types, the recognition accuracy is usually less than 90%) (14–17). Although using NIR technology has achieved the aforementioned goals, there are few examples of practical applications.
In this study, we took tobacco leaves from the Sichuan province of China as experimental materials and used discriminant partial least squares (DPLS) to establish a qualitative discriminant model first. However, the correct discriminant rate was poor. We speculated that the classification of origins by administrative divisions is insufficient, or that the classification does not have an information basis. Therefore, we analyzed the similarities between the five origins based on the main chemical components and NIR spectra. Doing this analysis helped establish the discriminant model of the three origin groups. The results showed that using information-based classifications can lead to a better model. This study also analyzed different absorption characteristics in different NIR wavenumber ranges and determined whether the classification is information-based by similarity analysis.
Materials and Methods
Instrument
A multipurpose analyzer (MPA)-type Fourier transform NIR spectrometer (Bruker, Germany) was used. The working parameters were as follows: spectrum acquisition range, 12000–4000 cm-1; spectral resolution , 8 cm-1; and number of scans averaged, 64.
Samples and Data
The quality characteristics and main chemical components differ greatly among the upper, middle, and lower parts of the same tobacco plant. To eliminate the influence of part differences on the determination of tobacco origins, the middle part of samples collected from different origins in 2014 to 2016 in Sichuan province, China, were selected. Information about the total experimental samples is provided in Table I. Tobacco routine chemical composition data, including the total sugars, reducing sugars, total nitrogen, nicotine, potassium, and chlorine, were obtained by the Sichuan Provincial Tobacco Quality Supervision and Test Station.

Experimental Method
Discriminant Partial Least Squares (DPLS)
DPLS originated from partial least squares (PLS) analysis, which is a bilinear model based on an X matrix (explanatory variable) and a Y matrix (response variable) (18). This algorithm maximizes the covariance with the Y matrix by modifying the X matrix (19).
Although PLS is regarded as a calibration method, it is also used for solving discrimination problems (20). Different from PLS analysis, Y is a class variable in DPLS. A binary system was used to determine the class to which a sample belongs and a standard is set, where “1” denotes belonging to this class and “0” denotes not belonging to this class (21). When there are three classes or five classes, class variable Y is as shown in Table II. However, the predicted value is often close to 0 or 1 rather than exactly 0 or 1 (22). In general, it can be set to a threshold to discriminate between classes by comparing the relationship between the predicted values and the threshold value (23).

In this study, we use the Caunirs software (China Agricultural University) to establish the origin discriminant models. The correct discriminant rate (CDR) is discriminating one class to within the same class, and the incorrect discriminant rate (IDR) discriminates a class to other classes. The CDR and IDR are defined as follows:

Projection Based on Principal Component and Fisher Criterion (PPF)
The PPF is a projection method that combines principal component analysis with Fisher criterion (24,25). Spectral matrix X has been reduced to x by a dimension reduction technique called principal component analysis. Then, x is projected though Fisher criterion. It searches for the projection directions on which the data points of different classes are separated as far as possible, while the data points of the same class are kept close to each other (19).
The PPF method maximizes the between-class distance and minimizes the within-class distance. Not only can the PPF method discriminate between classes, but it can also reflect the similarity between classes (26). The projection of PPF is a circle. In the PPF two-dimensional (2D) projection, the center of each circle represents the projection mean within-class, the within-class projection values reflect the degree of dispersion within the class, and the overlap of the circles reflects the similarity between the classes (19). The distance between the projection graphs can be visually evaluated to ascertain the degree of similarity among the origins; the diameter of the circle can evaluate consistency within an origin (19). This study mainly considers the interclass distances between different origins. In this study, we use the Caunirs software (China Agricultural University) to establish a projection analysis model.
Cluster Analysis and Spectral Preprocessing
Based on the averages of the main chemical components from each origin, SPSS 19.0 software (IBM) was used to perform system cluster analysis. Cluster analysis technology can directly compare the properties of various entities and classify data with similar properties into one class (27). The spectrum is subjected to Savitzky–Golay smoothing preprocessing, first-derivative preprocessing, or standard normal variable (SNV) preprocessing (28). When establishing the DPLS qualitative discriminant models, we used the Savitzky–Golay smoothing preprocessing and first-derivative preprocessing to decrease spectral random deviation, systematic deviation and so on.
When analyzing the absorbance differences in the average spectra among different regions, we used SNV preprocessing to decrease spectral random deviation. SNV pretreatment does not change the original shape of spectrum, and it is convenient for observation of spectral features.
Results
Result of the NIR Qualitative Model for Five Origins
DPLS was used, and the spectral data from 8000 cm−1 to 4000 cm−1 were selected because of the higher absorbance in this range using the first-derivative and Savitzky–Golay smoothing with 15 points to reduce the spectrum noise (2). Then, based on internal cross-validation (26), the first six principal components were chosen. Table III shows the results of the model.
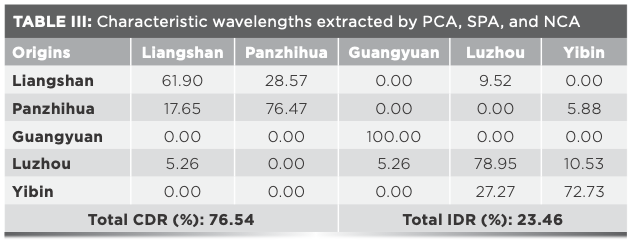
Table III shows that the total recognition accuracy of the tobacco origins discriminant model is only 76.54%, which does not meet the requirements for practical application. The correct discriminant rates in Panzhihua, Liangshan, Yibin, and Luzhou are low because there are many incorrectly classified samples between Panzhihua and Liangshan as well as between Yibin and Luzhou.
Regarding the reason behind the poor correct discriminant rate, we speculated that the classification of origins by administrative divisions is insufficient or unreasonable or the classification does not have an information basis. Therefore, we studied the similarities between the five origins to obtain a more reasonable or information-based classification based on their main chemical components and spectra to established a better discriminant model.
Similarity Analysis Between Five Origins Based on the Main Chemical Components
The average values of the main chemical components (total sugars, total nitrogen and nicotine) for the five origins were calculated, as shown in Table IV. Using systematic clustering, the contents of total sugars, total nitrogen, and nicotine from the five origins were analyzed. The cluster tree is shown in Figure 1.

FIGURE 1: Illustration of cluster analysis tree.
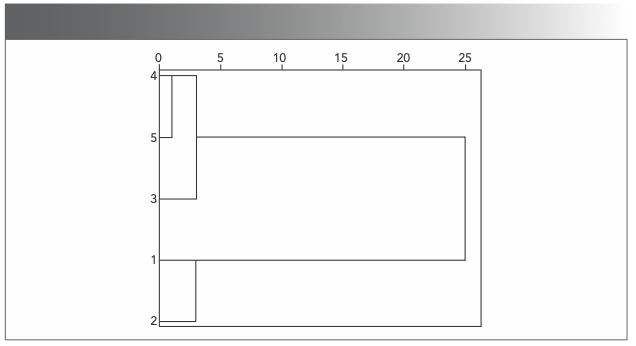
Table IV shows the following results: Liangshan and Panzhihua tobacco samples have more total sugars, less total nitrogen, and less nicotine. Guangyuan tobacco samples have medium total sugars, more total nitrogen, and more nicotine. Luzhou and Yibin tobacco samples have less total sugars, more total nitrogen and more nicotine. As shown in Figure 1, according to the cluster analysis of the main chemical components, Liangshan and Panzhihua can be in one class, Yibin and Luzhou can be in one class, and Guangyuan can be in a separate class.
Similarity Analysis Between the Five Origins Based on the NIR Spectra
Liangshan, Panzhihua, Guangyuan, Luzhou, and Yibin were labeled with the symbols LSh, PZH, GY, LZ, and YB, respectively. PPF was used, and as in DPLS, the spectral data from 8000 cm−1 to 4000 cm−1 were selected using first-derivative and Savitzky–Golay smoothing with 15 points. Then, based on the contribution of variance, the first five principal components were chosen. The projection map by PPF is shown in Figure 2.
FIGURE 2: Principal component and Fisher criterion (PPF) projection with 5 principal components.
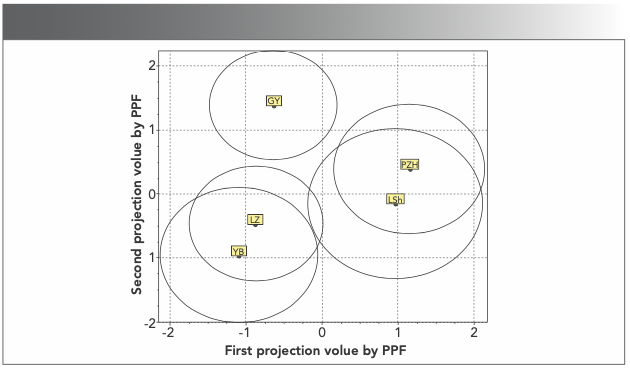
As shown in Figure 2, the overlap between Liangshan and Panzhihua as well as between Yibin and Luzhou is nearly over half, and the similarity is high. If Liangshan and Panzhihua, Yibin and Luzhou, and Guangyuan can be put into three classifications, the distances between them are all relatively long and the similarity is low.
Result of the NIR Qualitative Model for Three Origin Groups
The results of the similarity analysis between the five origins based on the main chemical components or NIR spectra both show that the similarity between Liangshan and Panzhihua is high, and that the similarity between Luzhou and Yibin is also high. Based on the similarity analysis results, Liangshan and Panzhihua, Luzhou and Yibin, and Guangyuan can be classified as three origin groups, respectively, namely, PL, YL, and GY.
We established a discriminant model for the three origin groups using the same modeling method DPLS and pre-processing method as in the five-origin model. Based on internal cross-validation, the first seven principal components were chosen. Table V shows the qualitative discrimination results of internal cross-validation, and Table VI shows the external validation.


Table V and Table VI shows that, compared with the five origin discriminant model, the discriminant model of internal cross-validation shows a highly correct discriminant rate that increased from 76.54–98.77%, and the correct discriminant rate of external validation reaches 100%.
By comparing the results of the model for five origin groups and the model for three origin groups classified by the similarity of the main chemical components and spectral characteristics, it can be observed that using the information-based classification in distinguishing the origins of tobacco by NIR can establish a better and more reasonable qualitative discriminant model. This conclusion may be extended to other agricultural raw materials.
Discussion
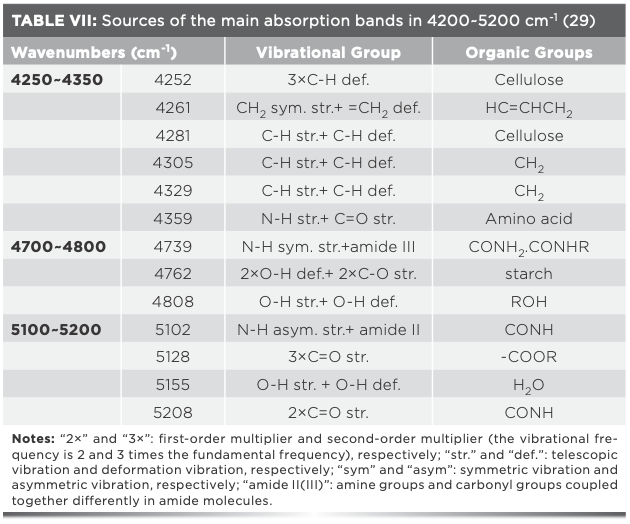
As shown in Figure 3, Figure 4, Table VII, and Table VIII, there are significant differences in the average spectra among Liangshan and Panzhihua, Luzhou and Yibin, and Guangyuan. In 4250–4350 cm-1, the spectra mainly contain the absorption of C-H groups typically on cellulose, and the PL has a lower absorbance, while the YL and GY have higher absorbance. In 4700–4800 cm-1, the spectra mainly contain the absorption of O-H groups typically on starch and other carbohydrates, and the PL has higher absorbance, while the YL and GY have lower absorbance.
FIGURE 3: SNV-preprocessed NIR spectra.
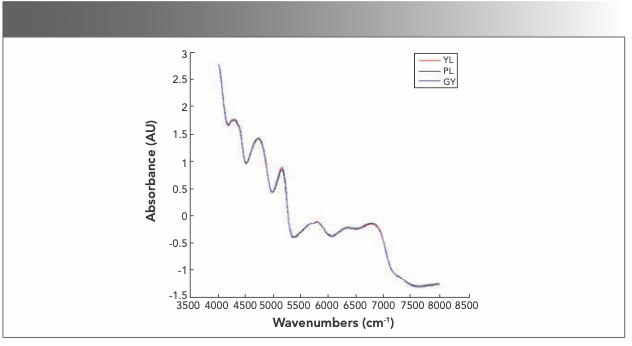
FIGURE 4: Display of segmented spectra.
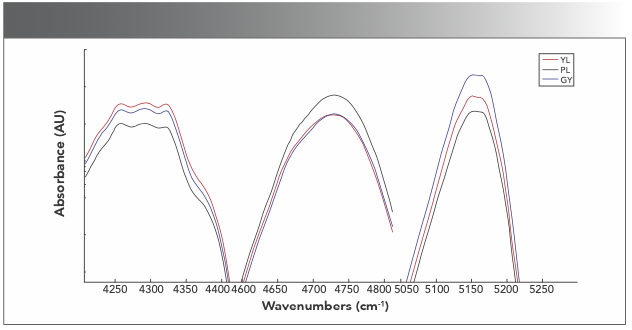

In 5100–5200 cm-1, the spectra mainly contain the absorption of N-H groups typically on protein. The PL has a lower absorbance, the YL has a middle absorbance, and the GY has a higher absorbance.
Based on the information regarding the composition of organic groups and related substances absorbed by NIR light in different frequency ranges and the absorption characteristics of different origin groups of tobacco in different bands, it can be inferred that the PL tobacco samples may have less cellulose, more starch and other carbohydrates, and less protein; the YL tobacco samples may have more cellulose, less starch and other carbohydrates, and a middle amount of protein; and the GY tobacco samples may have less cellulose, less starch and other carbohydrates, and more protein.
The chemical composition characteristics of different origin groups are obtained by spectrum absorption characteristic analysis, and they are consistent with the characteristics of routine chemical composition analysis obtained by chemical measurement, such as carbohydrates. Average spectral information further verifies that the division into three origin groups is an information-based classification; it can also be used for determining whether the classification has an information basis. However, methods such as similarity analysis may be more effective because of the serious overlap of NIR spectra. At the same time, we can also use NIR spectroscopy to obtain content information of the major chemical groups in agricultural raw materials.
Conclusions
This study established a qualitative model for five origin groups, and the correct discriminant rate was poor. Based on the similarity of the main chemical components and near-infrared spectra of the different origin groups, a discriminant model for three origin groups was established, and the correct discriminant rates of internal cross-validation and external validation are both greatly improved.
The analysis of absorption characteristics in the spectra showed that they can be used for determining whether the classification has an information basis by analyzing the preprocessing average spectra. At the same time, we can also use near-infrared spectroscopy to obtain content information of the major chemical groups in agricultural raw materials.
Using the information-based classification can lead to a better model, and the classification algorithm is not most important. The chemical composition or spectral characteristics can be used to determine whether the classification has an information basis. Compared to chemical composition analysis, using NIR spectroscopy is more convenient, and spectrum similarity analysis methods, such as PPF, can be more effective because of the serious overlap of near-infrared spectra. The proposed method has possible applications for other agricultural products.
Conflicts of Interest
There are no conflicts to declare.
Acknowledgment
This research is supported by the China National Key Research and Development Program Subtopic (Project No.: 2016YFD0700304) and the Major Science and Technology Project in Sichuan Province, China (Project No.: SCYC201810).
References
(1) Y.L. Yan, Basic and Application of Near Infrared Spectroscopy (China Light Industry Press, Beijing, China, 2005), pp. 8–39.
(2) Y.L. Yan, B. Chen, and D.Z. Zhu, Principle, Technology and Application of Near Infrared Spectroscopy (China Light Industry Press, Beijing, China, 2013), pp. 120–144.
(3) X.Y. Niu, L.M. Shao, Z.L. Zhao, X.Y. Zhang, Spectrosc. Spect. Anal. 8, 2095–2099 (2012).
(4) W.J. Wang, X.G. He, X.T. Yang, S.L. Wang, J.Y. Wang, Food Sci. Technol. 40(6), 344–347 (2015).
(5) Y. Meng, S.S. Wang, R. Cai, B.H. Jiang, and W.J. Zhao, J. Anal. Methods Chem. 1, 752162–82015 (2015).
(6) Z. Yang, K. Li, M.M. Zhang, D.L. Xin, and J.H. Zhang, Biotechnol. Biofuels. 9(35), 35–52 (2016).
(7) H. Li, F.R. van de Voort, A.A. Ismail, J. Sedman, R. Cox, C. Simard, and H. Buijs, J. Am. Oil Chem. Soc. 1(77), 29–36 (2000).
(8) J.W. Zhao, Q.S. Chen, H.D. Zhang, and M.H. Liu, Spectrosc. Spect. Anal. 9(26), 1601–1604 (2006).
(9) C.Y. Wang, B.R. Xiang, and W. Zhang, J. Chemometr. 23, 463–470 (2009).
(10) S.M. Tan, R.M. Luo, Y.P. Zhou, H. Xu, D.D. Song, T. Ze, T.M. Yang, and Y. Nie, J. Chemometr. 26, 34–39 (2012).
(11) D.M. Musingarabwi, H.H. Nieuwoudt, P.R. Young, E. Bickong, A. Hans, and M.A. Vivier, Food Chem. 190, 253–262 (2016).
(12) B. Shi, L. Zhao, R.C. Zhi, X.J. Xi, D.Z. Zhu, Trans. Chin. Soc. Agric. Eng. 27(A2), 302–306 (2011).
(13) Z.Q. Jiang, Farm Products Processing 5, 70–71 (2018).
(14) X.L. Li, Y.M. Tang, Y. He, and X.F. Ying, Spectrosc. Spect. Anal. 3(28), 578–581 (2008).
(15) F. Cao, D. Wu, Y. He, and Y.D. Bao, Acta. Optica. Sinica. 2(29), 537–540 (2009).
(16) H.R. Wang, X.L. Chen, W.J. Li, and J.L. Lai, Spectrosc. Spect. Anal. 30, 3213 (2010).
(17) D. Eisenstecken, A. Panarese, P. Robatscher, C.W. Huck, A. Zanella, and M. Oberhuber, Molecules 20(8), 13603 (2015).
(18) M. Barker and W. Rayens, J. Chemometrics 17, 166 (2003).
(19) L.L. Luan , Y.H.Wang , X.Y. Li, W.Y. Hu, K. Li, J.H. Li, K. Yang, R.X. Shu, L.L. Zhao, and C.L. Lao, J. Near Infrared Spectrosc. 24, 363–372 (2016).
(20) H. Martens and T. Naes, Multivariate Calibration (Wiley, New York, New York, 1989).
(21) H. Qin, H.R. Wang, W.J. Li, and X.X. Jin, Spectrosc. Spect. Anal. 7(31), 1777–1781 (2011).
(22) S.W. Lindstrom, P. Geladi, O. Jonsson, and F. Pettersson, J. Near Infrared Spectrosc. 19, 233 (2011).
(23) M.R. Almeida, D.N. Correa, W.F.C. Rocha, F.G.O. Scaf, and R.J. Poppi, Microchem. J. 109, 170–177 (2013).
(24) I.T. Jolliffe, Principal Component Analysis, 2nd Ed., Springer Series in Statistics (Springer, New York, New York, 2002).
(25) O.D. Richard and E.H. Peter, Pattern Classification and Scene Analysis (John Wiley, New York, New York, 1973).
(26) L. Zhang, X.H. Tang, X. Ma, Y.Y. Qian, L.P. Wang, Y.D. Wen, Y. Wang, H.H. Zhang, L.L. Zhao, and J.H. Li, Spectrosc. Spect. Anal. 3(32), 664–668 (2012).
(27) M. Feng, Mathematics in Practice and Theory 36(10), 46–53 (2006).
(28) Y. Bai, Application of Modern Near-Infrared Spectroscopy Analysis Technology in Drug and Food Quality Evaluation System (Higher Education Press, Beijing, China, 2009), pp. 74–79.
(29) Y.L. Yan, L.L. Zhao, D.H. Han, and S.M. Yang, Basics and Applications of Near Infrared Spectroscopy (China Light Industry Press, Beijing, China, 2005).
Yilin Liu, Han Liu, and Junhui Li are with the College of Information and Electrical Engineering at China Agricultural University in Beijing, China. Gang Hu is with the Sichuan Tobacco Company of CNTC in Chengdu, China. Yifen Yang is with the Customs Technology Center of Chengdu in Chengdu, China. Yu Guan is with the Panzhihua Tobacco Company of CNTC in Panzhihua, China. Direct correspondence to Junhui Li at caunir@cau.edu.cn

NIR Spectroscopy Explored as Sustainable Approach to Detecting Bovine Mastitis
April 23rd 2025A new study published in Applied Food Research demonstrates that near-infrared spectroscopy (NIRS) can effectively detect subclinical bovine mastitis in milk, offering a fast, non-invasive method to guide targeted antibiotic treatment and support sustainable dairy practices.
New AI Strategy for Mycotoxin Detection in Cereal Grains
April 21st 2025Researchers from Jiangsu University and Zhejiang University of Water Resources and Electric Power have developed a transfer learning approach that significantly enhances the accuracy and adaptability of NIR spectroscopy models for detecting mycotoxins in cereals.
Karl Norris: A Pioneer in Optical Measurements and Near-Infrared Spectroscopy, Part II
April 21st 2025In this two-part "Icons of Spectroscopy" column, executive editor Jerome Workman Jr. details how Karl H. Norris has impacted the analysis of food, agricultural products, and pharmaceuticals over six decades. His pioneering work in optical analysis methods including his development and refinement of near-infrared spectroscopy, has transformed analysis technology. In this Part II article of a two-part series, we summarize Norris’ foundational publications in NIR, his patents, achievements, and legacy.