Using Near-Infrared Spectroscopy to Monitor the Curing Reaction of Silicone Adhesives
Special Issues
In recent years there has been increased use of silicones in medicine, especially for medicinal implants. Quality control of intracorporeal-used silicones is an important task for ensuring patients’ health, but it is also a challenging one. The traditional mechanical methods used for the quality control of these silicone products, like rheometric measurements, tend to waste a lot of raw material. In this study, near-infrared spectroscopy (NIRS) has been used to replace the traditional method (rheometric measurements of control samples) using rheometry only as reference method to generate different calibration models. The applicability of NIRS as non-invasive analysis method is proven and the developed calibration models for curing processes of a silicone-adhesive at different temperatures are shown.
In recent years there has been increased use of silicones in medicine, especially for medicinal implants. Quality control of intracorporeal-used silicones is an important task for ensuring patients’ health, but it is also a challenging one. The traditional mechanical methods used for the quality control of these silicone products, like rheometric measurements, tend to waste a lot of raw material. In this study, near-infrared (NIR) spectroscopy was used to replace the traditional method (rheometric measurements of control samples) using rheometry only as a reference method to generate different calibration models. The applicability of NIR as a noninvasive analysis method is proven and the developed calibration models for curing processes of a silicone-adhesive at different temperatures are shown.
Quality determination of silicones used for medical purposes is a very important issue today to ensure patients’ health because their application in medical devices has strongly increased over the last years due to their biodurability and biocompatibility (1). The determined limit values for chemical and physical properties possessed by medical silicones or biomaterials in general are very strict (2). Silicone is one of the most often used biomaterials in devices such as catheters, skin repair templates, heart-lung machines, and cochlear replacements (3). In 1987, Williams defined a biomaterial as a nonviable material used in a medical device intended to interact with biological systems (4). The curing conditions for using silicones in medical devices are an important point. On one hand the used silicone parts have to be completely cured for in vivo usage, and on the other hand their production conditions have to be economical for the producing company. Each company has developed its own silicone mixtures, which require particular combinations of curing time and temperature that work best for the used silicone type.
Traditionally, the analysis of the curing state of the silicone for quality control is made using rheometric methods (5). A control sample of each silicone batch is taken and cured under certain time and temperature conditions in the rheometer. During the oscillation of the upper disk of a parallel disk rheometer the shear storage modulus (G′) and the shear loss modulus (G′′) are recorded (6–8). If the value of the shear storage modulus reaches a plateau the silicone sample is considered to be completely cured and applicable as biomaterial for medicinal devices. These curing conditions are applied to the whole batch of used silicone assuming that no differences exist in the silicone quality that have to be considered. In the literature, only rheometric measurements of polymers are documented (9–15). From an economical perspective, it would be a major improvement to be able to use a noninvasive method to analyze more control samples without losing expensive raw material.
For this nonmechanical and noninvasive monitoring of the silicone curing process, near-infrared (NIR) spectroscopy was used because it has already been utilized by default for cure monitoring of polymers (16–19). This article discusses the improvement in quality control of silicone adhesives used as biomaterials by using NIR spectroscopy and shows calibrations generated (using rheometric measurements as reference values) at different temperatures. These calibrations can be used in the future to determine the exact curing state of a silicone-adhesive sample.
Materials and MethodsPreparation of Silicone Samples
The silicone-adhesive samples consisted of two components that have to be mixed to activate the curing (one component with a Pt-catalyst for the activation of the curing) (20,21). The uncured silicones were filled into the 3-mm gap between the two disks of the parallel-disk rheometer and cured at different temperatures (30 °C, 40 °C, 50 °C, and 70 °C).
Near-Infrared Spectroscopy
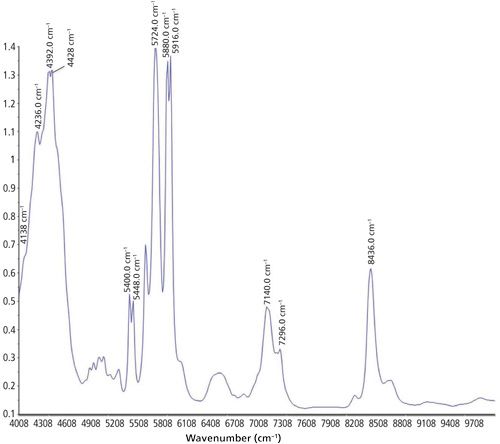
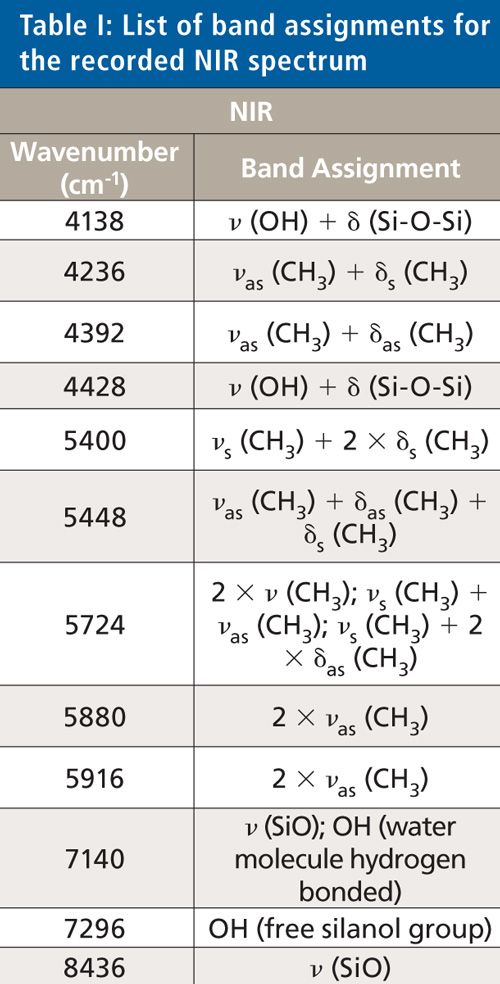
A scanning polarization interferometer Fourier-transform NIR (FT-NIR) spectrometer from Büchi was used to record the NIR spectra. This spectrometer is equipped with a tungsten-halogen lamp and a temperature-controlled lead sulfide detector at 30 °C. The spectral resolution was 12 cm-1, the absolute wavelength accuracy ±2 cm-1, and the relative reproducibility 0.5 cm-1 between 10.000 and 4.000 cm-1. Measurements were performed at room temperature (22.5 °C). For recording the transflection spectra, a silica glass light fiber optic from BES Optics of 2 m length was used. NirCal 4.21 (Büchi) chemometric software was used for recording the spectra. The measurement time for on-line measurements during the curing process of the silicones was set between 24 and 72 h with 20 scans per measurement. A near-infrared optical fiber in transflection mode was used to analyze the silicone-adhesive sample during the whole curing process directly between the two metal disks of the rheometer. The background was recorded with 20 scans using a spectralon reflector. An NIR spectrum was accomplished of each used silicone sample after the curing for identification. The detectable bands were assigned to the appropriate vibration of the molecule. One of these NIR spectra is shown in Figure 1, and the band assignments are listed in Table I.
Attenuated Total Reflection Spectroscopy
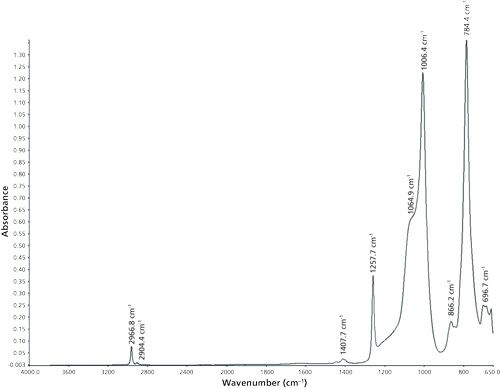
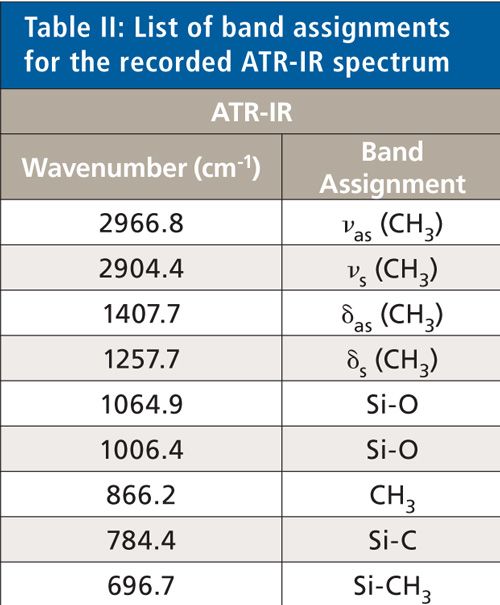
For the detailed identification of the silicone, attenuated total reflection infrared (ATR-IR) spectroscopy was used. The ATR-IR spectra were collected using a Spectrum 100 ATR-IR spectrometer and Spectrum version 6.3.1 software (both from Perkin-Elmer). The wavenumber range was 4000–650 cm-1 and the spectral resolution was 1 cm-1. All spectra were recorded at room temperature (22.5 °C). For each sample and the background measurements, 50 scans were taken. Figure 2 shows an ATR-IR spectrum of the adhesive silicone. The band assignments are listed in Table II.
Rheometric Measurements
For the reference values of the monitoring of the silicone curing an AR 2000ex rheometer from TA Instruments was used. It includes an ultralow inertia drag cup motor and porous carbon air bearings for controlled stress, direct strain, and controlled rate performance. The silicone sample was applied into the 3-mm gap between the two disks of the rheometer. During the silicone curing, the upper disk oscillated and the shear storage modulus (G′) and the shear loss modulus (G′′) were recorded. The shear moduli are defined as follows:


where γ0 defines the strain amplitude, σ0 denotes the stress amplitude, and δ is the phase lag.
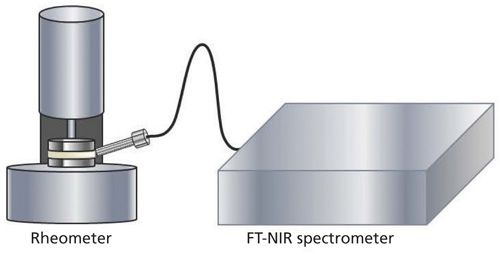
Simultaneously, spectra of the curing silicone adhesive were taken using NIR. The measurement setup is shown in Figure 3. The head of the light fiber probe was directed towards the middle of the 3-mm-thick silicone adhesive sample between the two metal disks and adjusted at a 30° angle.
Multivariate Data Analysis
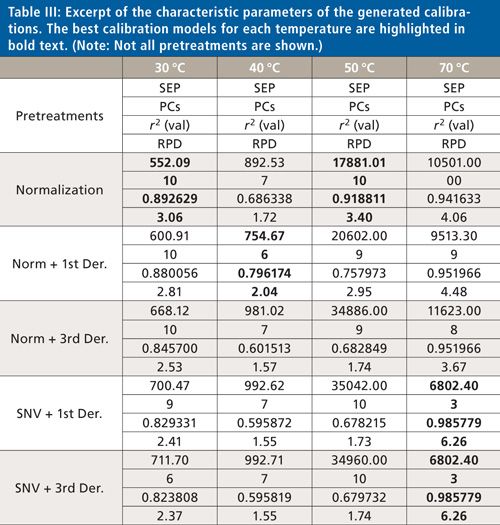
Calculations were performed using Unscrambler 10.2 software (Camo). At first the recorded spectra were log 1/R transformed and baseline corrected. Different types of pretreatments were applied to the spectra, such as normalization; multiplicative scatter correction (MSC); first-, second-, and third-derivative Savitzky-Golay (22); and standard-normal-variate (SNV) (23). Different combinations of polynomial orders and smoothing points were tested for the derivative pretreatments. Additionally, different wavenumber ranges were evaluated. Partial least squares (PLS) regression models were developed and validated by test-set validation (one-third of the spectra in the validation set and two-thirds of the spectra in the calibration set). Table III shows the characteristic parameters of an excerpt of the different calibrations, where the best calibration for each temperature is marked.
The following quality parameters were used for the evaluation of the calibration models. The standard error of prediction (SEP) is defined as the deviation of the differences between reference values and results of vibrational spectroscopy in the validation set.

The robustness of each model is indicated by the used number of principal components.
The ratio of the standard deviation of the sample-values to the SEP is called ratio performance deviation (RPD). RPD values greater than 2.5 are considered acceptable, values greater than 5 are adequate for quality control, and values greater than 10 are excellent (24).
Results
Identification of the Structure of Unknown Silicone Adhesive
The collected NIR and ATR spectra were used for structure identification of the silicone adhesive samples. An exemplary spectrum concerning the NIR region is depicted in Figure 1. For ATR, an example is shown in Figure 2. Table I shows the band assignments for the NIR spectrum, and Table II shows the band assignments for the ATR-IR spectrum. Some of the assigned vibrations are taken from Bokobza (25).
Concerning the structure of the analyzed silicone adhesive, the NIR and ATR-IR measurements identify no double bonds or aromatic groups.
Identification and Assignment of Different Vibration Bands
The following vibrations cause the absorption bands in the NIR region: A combination of Si-OH stretching and OH stretching vibration causes the absorption band at 4138 cm-1. The bands at 4236 cm-1 and 4392 cm-1 have their origin in the combination of the asymmetric stretching vibration of CH3 with the symmetric or asymmetric bending vibration of CH3. The absorption band at 4428 cm-1 occurs because of a combination of OH and Si-O-Si vibrations, as well as the absorption band at 7140 cm-1. The band occurring at 5448 cm-1 is based on the combination of the symmetric stretching vibration and the first overtone of the symmetric bending vibration of CH3. A combination of different vibrations of methyl groups causes the absorption bands at 5448 cm-1 (asymmetric stretching vibration and asymmetric and symmetric bending vibration) and 5724 cm-1 (asymmetric and symmetric stretching vibration and asymmetric bending vibration). Absorption bands at 5880 cm-1 and 5916 cm-1 are based on the first overtone of the asymmetric stretching vibration of the methyl groups. Vibrations of the hydroxyl groups of free silanol groups cause the band at 7296 cm-1. The stretching vibrations of Si-O bonds cause the absorption band at 8436 cm-1.
In the mid-IR region of the ATR measurements, the fundamentals of these vibrations cause the absorption bands. The bands at 2966.8 cm-1 and 2904.4 cm-1 are caused by the asymmetric and symmetric stretching vibration of the methyl groups. Asymmetric and symmetric bending vibrations of the methyl groups are the origin for the absorption bands at 1407.7 cm-1 and 1257.7 cm-1. Vibrations of the Si-O bonds generate the absorption bands at 1064.9 cm-1 and 1006.4 cm-1. The band at 866.2 cm-1 originates from the vibrations of the methyl groups, and the vibrations of the Si-C and Si-CH3 bonds cause the absorption bands at 784.4 cm-1 and 696.7 cm-1.
Monitoring the Curing Reaction of Silicone Adhesives Using NIR
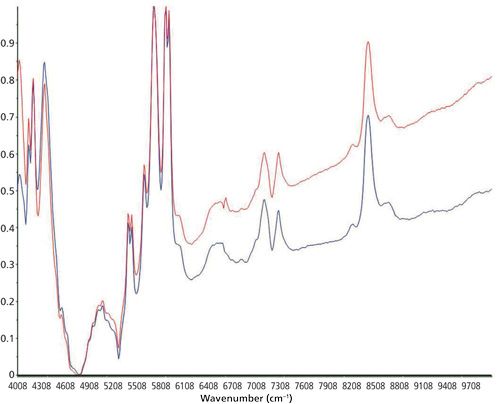
To monitor the curing reaction of the silicone adhesive at different temperatures, the samples were analyzed at 30 °C, 40 °C, 50 °C, and 70 °C. An acceptable calibration model could be generated for each temperature, but for some models the usage of a higher number of principal components was necessary. Only the recorded spectra near the point of curing of the silicone adhesive were used to generate the calibration model at each temperature (30 °C, 40 °C, 50 °C, and 70 °C). Concerning the calibration model at 70 °C, for example, only the spectra after an elapsed time of 98 min of measurement were used for generating the calibration. A comparison of the spectra at the beginning and the end of the curing reaction showed apparent differences in the spectra. The intensity of all absorption bands caused by vibrations of free hydroxyl groups is reduced during the monitoring of the curing reaction. This is because of the cross-linking between the single silicone molecules during the process of curing (Figure 4).
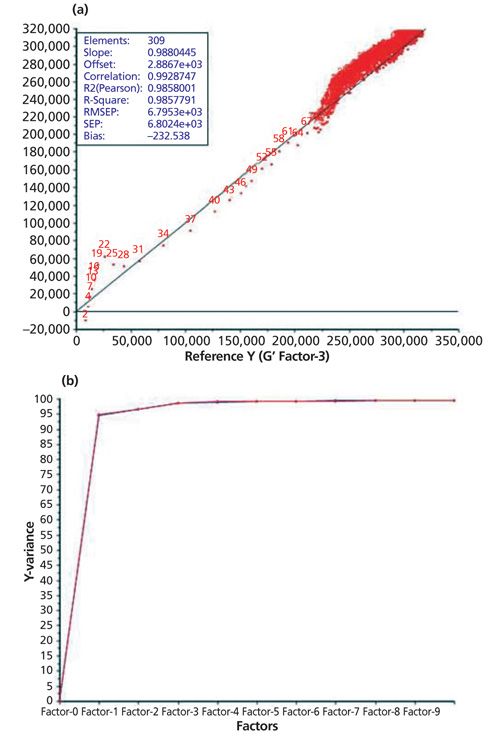
A total of 10 principal components must be used for the monitoring of the curing reaction at 30 °C after the normalization of the recorded data as pretreatment. This calibration model gives an RPD value of 3.06. The same pretreatment leads to the best calibration model at a temperature of 50 °C (RPD value: 3.40). For the generation of a calibration measurement at 40 °C the number of principal components could be reduced to six after normalization and first-derivative Savitzky-Golay (15 smoothing points [SP], second polynomial order), which leads to an RPD value of 2.04. So the RPD values for the generated calibration models at 30 °C and 50 °C are considered to be acceptable. Table III shows that the best calibration model could be generated at a curing temperature of 70 °C. For obtaining the best RPD value, MSC or SNV pretreatment was applied in combination with the third-derivative Savitzky-Golay (15 SPs, fourth polynomial order). These pretreatments give an RPD value of 6.26, which is considered adequate for quality control. Figure 5 shows the generated calibration for the curing reaction at 70 °C (predicted versus reference plot and explained variance plot) using SNV and third-derivative Savitzky-Golay as pretreatment. Figure 6 shows the corresponding curing curve (G′ and G′′) recorded with the rheometer.
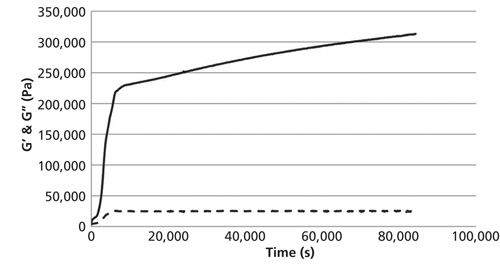
Looking at Table III, it is quite obvious that the generated calibration improves as the temperature increases. This result is obtained because the curing curve measured using the rheometer is always nonlinear. Now, let’s try to describe this nonlinear function by a linear one generated by using PLS regression calibration (Unscrambler X). According to this analysis, the calibration models are not that good, with RPD values ranging from 2.04 to 3.40 although more principal components were used, at lower temperatures. This higher linearity of curing curves at higher temperatures because of the faster curing of the silicone-adhesive sample makes a better description of the curing process possible using PLS regression clustering to generate a calibration. This is why the generated calibrations are much better at higher temperatures and the best calibration model at 70 °C only needs three principal components and has an RPD value of 6.26. In addition to an increase of linearity, the higher temperature shortens the time for complete curing without any difference in the final product after the curing process in a 30–70 °C temperature range.
Conclusion
By using NIR and ATR-IR it is possible to identify the structure of different types of silicones and silicone adhesives without damaging or wasting expensive raw material. These results demonstrate that NIR spectroscopy is an appropriate tool for quality control and identification of medical-grade silicone.
Additionally, it is possible to use NIR spectroscopy to determine the degree of curing for a silicone-adhesive sample. The determination of the curing degree works better with a higher chosen temperature at which the curing reaction is monitored. Using the generated calibration models shown in this article, it is possible to replace the rheometric method used today for determining the degree of curing completely by NIR spectroscopy. Using this analytical method for quality control allows the number of control samples used per batch to be increased without wasting raw material. One single result doesn’t have to be used to test the quality of a whole batch. A calibration model could be generated for every curing temperature.
The use of this noninvasive analytical method makes possible an improved quality control, a more economical work-flow for the producing companies, and therefore cheaper production of medical devices out of medical-grade silicone.
References
(1) A. Colas and J. Curtis, Biomaterials Science: An Introduction to Materials in Medicine (Elsevier Academic Press, 2005).
(2) R. Blocksma and S. Braley, Plast. Reconstr. Surg.35(4), 366 (1965).
(3) Biomaterials Science: An Introduction to Materials in Medicine, B.D. Ratner, A.S. Hoffman, F.J. Schoen, and J.E. Lemons, Eds. (Academic Press, New York, 2004).
(4) D.F. Williams, “Definitions in Biomaterials,” Proceedings of a consensus conference of the European Society for Biomaterials, Chester, England, March, 1986 (Elsevier Science Ltd, 1987).
(5) P.J. Halley and M.E. Mackay, Polym. Eng. Sci.36(5), 593 (1996).
(6) F. Leonardi, C. Derail, and G. Marin, J. Non-Newtonian Fluid Mech.128(1), 50 (2005).
(7) M. Bousmina, Rheol. Acta38(1), 73 (1999).
(8) H.H. Winter and F. Chambon, J. Rheol. 30(2), 367 (1986).
(9) S. Yi and K.S. Chian, “Chemo-thermo-viscoelastic Behavior of Underfill Materials During Curing Process” (IEEE, 2001), p. 254.
(10) E. Van Ruymbeke, C. Bailly, R. Keunings, and D. Vlassopoulos, Macromolecules 39(18), 6248 (2006).
(11) D. Hesekamp, H.C. Broecker, and M.H. Pahl, Chemical Engineering & Technology21(2), 149 (1998).
(12) R.J. Blackwell, O.G. Harlen, and T.C.B. McLeish, Macromolecules34(8), 2579 (2001).
(13) G. Bishko, T. McLeish, O. Harlen, and R. Larson, Phys. Rev. Lett.79(12), 2352 (1997).
(14) S. Srivastava, J.H. Shin, and L.A. Archer, Soft Matter8, 4097–4108 (2012).
(15) J.D. Halverson, G.S. Grest, A.Y. Grosberg, and K. Kremer, Phys. Rev. Lett. 108(3), 38301 (2012).
(16) M. Lualdi, A. Colombo, B. Farina, S. Tomatis, and R. Marchesini, Lasers Surg. Med. 28(3), 237 (2001).
(17) L. Rey, J. Galy, H. Sautereau, G. Lachenal, D. Henry, and J. Vial, Appl. Spectrosc.54(1), 39 (2000).
(18) G. George, P. Cole-Clarke, N. St. John, and G. Friend, J. Appl. Polym. Sci.42(3), 643 (1991).
(19) D.W. Schiering, J. Katon, L. Drazal, and V. Gupta, J. Appl. Polym. Sci. 34(7), 2367 (1987).
(20) O. Schlak, W. Michel, and B. Munchenbach, U.S. patent 4,481,341 Nov. 6, 1984.
(21) A. Bublewitz and J.P. Reber, German patent application WO1997040102 A1 Oct 30, 1997.
(22) A. Savitzky and M.J.E. Golay, Anal. Chem.36(8), 1627 (1964).
(23) R. Barnes, M. Dhanoa, and S.J. Lister, App. Spec.43(5), 772 (1989).
(24) J. Pandord and P. Williams, Journal of the American Oil Chemists’ Society65(10), 1627 (1988).
(25) H.W. Siesler, Y. Ozaki, S. Kawata, and H.M. Heise, Near-Infrared Spectroscopy: Principles, Instruments, Applications (Wiley-Vch, 2008).
N. Pemberger, L.K.H. Bittner, and C.W. Huck are with the Institute of Analytical Chemistry and Radiochemistry, CCB - Centre of Chemistry and Biomedicine at Leopold-Franzens University in Innsbruck, Austria. Direct correspondence to: Christian.W.Huck@uibk.ac.at

Newsletter
Get essential updates on the latest spectroscopy technologies, regulatory standards, and best practices—subscribe today to Spectroscopy.
Integrating Spectroscopy with Machine Learning to Differentiate Seed Varieties
July 15th 2025Researchers at the University of Belgrade have demonstrated that combining Raman and FT-IR spectroscopy with machine learning algorithms offers a highly accurate, non-destructive method for identifying seed varieties in lettuce, paprika, and tomato.