Using Real-Time FT-IR to Characterize UV Curable Optical Adhesives
When combined with the rapid scan speeds of modern instruments, Fourier-transform infrared (FT-IR) spectroscopy provides a powerful real-time method for monitoring chemical changes (for example, the optical adhesive caused by illumination of a UV lamp). This article describes the characterization of several adhesives used in an optical assembly. Several different approaches to measuring the rate of change during the curing experiment are described. As the number of uses for UV curing and photopolymerization increases, real-time FT-IR should play a major role in characterizing these new materials and products.
When combined with the rapid scan speeds of modern instruments, Fourier-transform infrared (FT-IR) spectroscopy provides a powerful real-time method for monitoring chemical changes (for example, the optical adhesive caused by illumination of a UV lamp). This article describes the characterization of several adhesives used in an optical assembly. Several different approaches to measuring the rate of change during the curing experiment are described. As the number of uses for UV curing and photopolymerization increases, real-time FT-IR should play a major role in characterizing these new materials and products.
Real-time Fourier-transform infrared (FT-IR) spectroscopy provides an extremely valuable way to monitor the chemical reactions encountered when developing new UV curable adhesives as well as benchmarking the UV light sources that are designed for the curing process (1). Full IR spectra can be acquired before, during, and after exposure to the light without moving or changing the sample. In cases where an infrared feature corresponds to a chemical bond involved in the photopolymerization process, obtaining multiple spectra each second during the curing process can provide an accurate measure of the kinetics involved in the reaction and the extent of conversion.
A great deal of research has gone into formulating these adhesives in an effort to produce properties optimized for specific applications. A reactive acrylate urethane oligomer is the major component (30–60%) in many commercial adhesives. The combination of this oligomer and reactive acrylate monomers creates a cross-linked polymer matrix after production of free radicals by the UV excitation of the photoinitiator. The UV cure requires the presence of a photoinitiator that converts to a free radical in the presence of UV irradiation and then reacts with the acrylate groups of the reactive monomer or the urethane oligomer. The oligomer is often created by reacting a polyol with an isocyanate to produce an acrylate urethane of a certain molecular weight. The specific acrylate oligomers and reactive monomers present in the formulation can significantly effect the properties of the cured adhesive as well as the reaction time. Other additives, fillers, and pigments can also effect the curing time and amount of conversion for an adhesive.
The combination of a high speed FT-IR spectrometer and advanced multivariate statistical analysis techniques provide a powerful real-time approach for measuring the chemical changes in the optical adhesive caused by the illumination with the UV lamp. In this article, we describe the use of an integrated hardware–software FT-IR system to characterize several adhesives used in our optical assembly area. We describe several different approaches to measuring the rate of change during the curing experiment. We also discuss some of the features of the special real-time FT-IR software that proved valuable in this experiment. This software rapidly acquires infrared spectra and also calculates one or more real time response functions based on the spectral data. The software is designed to work with any time-dependent measurement such as thermogravimetric analysis–infrared spectroscopy (TGA-IR), gas chromatography–infrared spectroscopy (GC–IR), continuous emission monitoring (CEM), and kinetics. The real-time response function or profile can be as simple as a peak height or as complex as calculating several concentrations using a multivariate statistical analysis method such as partial least squares (PLS) or classical least squares (CLS). The profiles are time plots of the "intensity" from each spectrum acquired during the experiment. New profiles can be calculated after the spectra have been acquired based on specific features in the spectra identified from analyzing the data.
Experimental
In this experiment, samples of three adhesives used in an optics shop: Dymax Multi-Cure 6-621 Series acrylated urethane adhesive (Dymax Corporation, USA, Torrington, Connecticut), Loctite 3100 modified acrylate adhesive (Henkel, Düsseldorf, Germany), and Dymax Op 4-20641 urethane acrylate adhesive were thinly applied to IR transparent windows. Spectra were acquired on a Thermo Fisher Scientific Nicolet 8700 FT-IR system with a high-speed MCT detector (Madison, Wisconsin). A Dymax BlueWave 200 light curing spot lamp was positioned with the fiber optic tip about 5 cm from the sample in the FT-IR. Initially, the light source was positioned facing the detector side of the instrument, but the large amount of stray UV light from the UV lamp introduced significant noise into the IR spectrum. After we repositioned the lamp to shine at an angle toward the source side of the instrument, we obtained excellent spectra using acquisition times of less than 0.1 s.
A workflow was created to rapidly collect a series of spectra from each sample as the reaction was initiated and then completed. The software (Omnic Series, Thermo Scientific) was started and after a few seconds the lamp was turned on manually. The software has an external trigger option that can be used to start the measurement at precisely the same time as the lamp; however, several spectra were needed before the cure was initiated to observe any spectral changes without illumination and in one case to acquire the Gram-Schmidt basis vectors with the sample in the beam.
One powerful feature of this software is the ability to calculate a response function called a "Profile" that is based on the spectral features in the data acquired during the experiment. A good general response function is based on the Gram-Schmidt orthoganalization, which calculates a projection of each new interferogram onto the ortho-normal rotation of a set of basis vectors acquired before the analysis began (2). This computation provides a real time response that corresponds to the total spectral difference from the sample at time T0. The Gram-Schmidt algorithm yields a high signal-to-noise-ratio real-time signal without requiring any knowledge of the chemistry or functional groups involved in the reaction. However, the Gram-Schmidt response is always positive because it is the magnitude of the vector projection out of the hyper plane created from the basis vectors and cannot be used to determine the percent conversion. All of the spectra are saved during the reaction and a comparison of the spectral differences between the first and last spectra reveals the spectral features corresponding to specific chemical bonds involved in the reaction. In this application, significant reductions are noted in several spectral features corresponding to the acrylate groups. In many adhesive systems, the main curing reaction involves the loss of the acrylate double bond that corresponds to the peak near 810 cm-1 in the spectrum. The reduction in the intensity of this peak is used to determine the amount of the acrylate that is converted to cross-links in the sample during the curing process. This is calculated as the percent conversion based on the change in area of the peak from the start of the experiment to completion:

where At is the integrated area over baseline at time t and A0 is the area at t = 0.
Results and Discussion
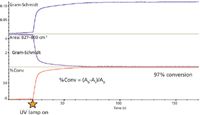
Quantitative analysis software (Thermo Scientific TQ Analyst) was used to create a simple method to calculate the % conversion. The setup screen is shown in Figure 1 with the method selected as the second profile. The area of the 810-cm-1 peak is calculated and the first measurement (A0) is stored to be used in the real-time calculation described above.

Figure 1: Menu used to define the experiment parameters for the UV curing experiment.
In the first study, a real-time profile was also included for the integrated area for the acrylate peak and spectra were acquired for 200 s. All of the spectra are saved during the measurement and new profiles can be created after the spectral acquisition step is completed. In Figure 2, a third profile has been added based on the integrated area of the acrylate peak.

Figure 2: Response profiles from UV cure study of Dymax Op 4-20641 urethane acrylate adhesive.
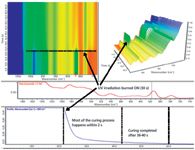
After the spectral data have been acquired, a number of software features are available to help characterize the sample. Figure 3 shows the multiwindow display, including a rotating 3D model that is a valuable tool in analyzing the spectral effects occurring during the measurement.

Figure 3: 3D displays of spectra as a function of time.
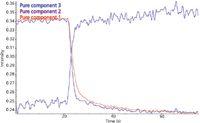
As a final example of using FT-IR to characterize a UV curing experiment, the spectra was exported and multivariate curve resolution performed on the series of spectra acquired during the measurement. Multivariate curve resolution (MCR) is a nonparametric technique that is similar to principal component analysis in determining the causes of variance in the data matrix. A major advantage of MCR is that the computations are constrained so that the resulting spectral representations are positive and correspond to the actual spectra contributing to the changes during the cure. This produces a set of "pure component" spectra that define the variance in the spectra. In a chemical reaction there are two components corresponding to the starting material and the final product, but there may be multiple products that are possible intermediates. Ideally, MCR would produce a pure component spectrum for each species that has a different reaction profile. In Figure 4, series profiles have been created based on the spectral correlation to each of the first three pure component spectra calculated for this data set. The profiles for component 1 and component 2 show the expected decrease in intensity for the reactant and the increase in intensity for the product. The profile for component 3 also decreases, indicating the spectral reduction for this component. However, the rate of loss appears faster for the spectral features corresponding to pure component 3 (blue).

Figure 4: Response profiles based on the pure component spectra from the MCR analysis.
While this small difference may not be significant in this particular experiment, MCR and principal component analysis (PCA) are powerful techniques to identify the chemical species that change during a series of measurements.
Conclusion
In this study, we have demonstrated some of the features of FT-IR systems that have proven valuable in characterizing the chemistry occurring during a UV curing experiment for an optical adhesive. Although this technique has been commonly employed in many photopolymerization applications throughout the years, we have described an integrated system with a number of powerful numerical analysis capabilities that makes these measurements fast and easy. As the number of uses for UV curing and photopolymerization increases, real-time FT-IR should play a major role in helping to characterize these new materials and products.
References
(1) C. Decker and K. Moussa, Makrol. Chem. 189, 2318–2394 (1988).
(2) J.A. de Haseth and T.L. Isenhour, Anal. Chem. 49, 13 (1977).
Steve Lowry and Forrest Weesner are with Thermo Fisher Scientific in Madison, Wisconsin.

AI Shakes Up Spectroscopy as New Tools Reveal the Secret Life of Molecules
April 14th 2025A leading-edge review led by researchers at Oak Ridge National Laboratory and MIT explores how artificial intelligence is revolutionizing the study of molecular vibrations and phonon dynamics. From infrared and Raman spectroscopy to neutron and X-ray scattering, AI is transforming how scientists interpret vibrational spectra and predict material behaviors.
Real-Time Battery Health Tracking Using Fiber-Optic Sensors
April 9th 2025A new study by researchers from Palo Alto Research Center (PARC, a Xerox Company) and LG Chem Power presents a novel method for real-time battery monitoring using embedded fiber-optic sensors. This approach enhances state-of-charge (SOC) and state-of-health (SOH) estimations, potentially improving the efficiency and lifespan of lithium-ion batteries in electric vehicles (xEVs).
New Study Provides Insights into Chiral Smectic Phases
March 31st 2025Researchers from the Institute of Nuclear Physics Polish Academy of Sciences have unveiled new insights into the molecular arrangement of the 7HH6 compound’s smectic phases using X-ray diffraction (XRD) and infrared (IR) spectroscopy.