2012 Salary Survey: A Steady Ride
Our annual survey of salaries, workloads, stress levels, and job satisfaction.
Throughout the last decade, salaries in the spectroscopy field have increased fairly steadily, with a few years of oscillation in either direction (Table I). Despite the small increase in salaries we report this year, as well as increased workloads and stress levels, spectroscopists report being satisfied with their careers. If history is our guide for the future, these trends in spectroscopy are likely to continue.

Table I: Average salaries 2002â2012
Our salary survey had 631 respondents this year, with 568 (90%) completing all of the questions. Here are some overall statistics from the results:
- Area of employment: 62% private industry; 17% academia; 17% government or national laboratory; 4% other areas such as hospitals, nonprofits, research institutes, and self-employed; and fewer than 1% military.
- Employment status: 93% employed full-time; 2% consultant; 2% postdoctoral researcher or graduate student; 2% employed part-time; fewer than 1% contract employee; fewer than 1% temporary employee; and fewer than 1% not currently employed.
- Primary field of analysis: 33% analytical chemistry; 10% instrumentation design or development; 10% environmental; 9% pharmaceuticals; 6% agricultural or food; 5% medical or biological; 5% plastics, polymers, or rubber; 4% organic chemicals; 4% forensics or narcotics; 3% biotechnology; 3% electronics or semiconductors; 3% metallurgy; 2% inorganic chemicals; 2% energy or petroleum; and fewer than 1% ceramics.
- Age range: fewer than 1% were 20–24; 4% were 25–29; 8% were 30–34; 9% were 35–39; 14% were 40–44; 14% were 45–49; 18% were 50–54; 15% were 55–59; 12% were 60–64; and 7% were 65+.
- Gender: 76% male and 24% female.
- Education level: 41% of respondents have a doctoral degree; 24% have a master's degree; 32% have a bachelor's degree; and 3% have an associate degree.
Salaries
The average salary reported in this year's survey is $85,060, which is an increase of about $550 compared to last year's average. Table I lists the average salaries reported for 2001–2012.

Table II: Education levels in 2002 compared to 2012
Even though this year's average salary is not a large increase, it is still a good indication that things are continuing to improve in the spectroscopy industry as a whole. Since 2002, the average salaries of our respondents have increased steadily, and over 10 years, the average salary has increased by $17,160. Our survey also found that 51% of respondents receive supplemental income, such as a commission or bonus. The average supplemental income is $27,842. That is certainly nothing to scoff at.
Let's take a look at how education levels have changed since 2002. Table II is a breakdown by percentage of respondents with varying education levels. The changes are not staggering, but they are indicative of an increase in higher education, which typically signifies a higher salary. The average salary for respondents with doctoral degrees is $109,389. Doctoral respondents had the following years of professional experience: 8% had 41 or more years; 13% 36–40 years; 32% 21–35 years; 12% 16–20 years; 15% 10–15 years; 14% 5–9 years; and 6% fewer than 5 years. The average salary of respondents with a master's degree is $72,798. An estimated 2% of respondents with master's degrees also had 41 or more years of professional experience; 10% had 36–40 years of experience; 42% had 21–35 years of experience; 12% had 16–20 years of experience; 14% had 10–15 years of experience; 10% had 5–9 years of experience; and 10% had fewer than 5 years of experience. The average salary for respondents with a Bachelor's degree is $73,358. Respondents with Bachelor's degree had the following years of professional experience under their belts: 5% had 41 or more years; 5% 36–40 years; 52% 21–35 years; 14% 16–20 years; 9% 10–15 years; 12% 5–9 years; and 3% fewer than 5 years. The average salary for respondents with an associate's degree is $60,417. An estimated 9% of respondents with associate degrees also had 41 or more years of professional experience; 5% had 36–40 years of experience; 52% had 21–35 years of experience; 10% had 16–20 years of experience; 14% had 10–15 years of experience; and 10% had fewer than 5 years of experience (note that none of our respondents reported 5–9 years of experience). See Table III for a look at how these years of experience compare to the overall survey results.
We will take a closer look at other salary breakdowns such as job sector, region, and gender further on, but first let's look at how spectroscopists feel about the current economic climate.

Table III: Respondents’ levels of professional experience; shown are overall results, and results broken down by education level
Job Seeking in Today's Market
New to this year's survey were several questions about the economy and overall job market. First, we asked respondents to evaluate how the job market is now compared to one or two years ago, and select "easier," "about the same," or "more difficult" as answers. According to the results, 55% of respondents think getting a first job is more difficult now, 37% think it is about the same, and 8% think it is easier. When asked about getting a new job as an experienced scientist, 48% think it is about the same, 44% think it is more difficult now, and 8% think it is easier. An estimated 52% of respondents think getting a promotion is more difficult now, 44% think it is about the same, and only 4% think it is easier. At an almost even split among our respondents, 49% think obtaining lasting and meaningful employment is more difficult now, 48% think it is about the same, and 3% think it is easier. Finally, 47% of respondents think it's more difficult now to avoid layoffs, 45% think it is about the same, and 8% think it's easier.
Our second question explored where our survey respondents think the job market stands as a whole. For young scientists, 16% of respondents think the job market is better than a year ago, 40% think it is about the same, and 44% think it is worse now than a year ago. For experienced scientists experiencing a layoff, 9% of respondents think the job market is better than a year ago, 45% think it is about the same, and 46% think it is worse than a year ago. For experienced scientists seeking better opportunities, 10% think the job market is better than a year ago, 47% think it is about the same, and 42% think it is worse.
Salaries and Gender
This year's survey shows, unsurprisingly, that the average salary for men continues to be higher than the average salary for women: The average salary for women is $71,988 and the average salary for men is $88,468. This salary difference, about $16,480, is the largest difference we have reported in recent years. Figure 1 shows the salary gap from 2010 to 2012. Here are some additional statistics based on gender:
- Employment: 92% of men and 97% of women were were employed full-time; 1% of men and no women were contract employees; 2% of men and no women were consultants; 2% of both men and women were postdoctoral researchers or graduate students.
- Professional experience: 6% of men had 41 or more years of work experience and only 3% of women had the same; 10% of men and 7% of women had 36–40 years of experience; 44% of men and 34% of women had 21–35 years of experience; 11% of men and 18% of women had 16–20 years of experience; 12% of men and 16% of women had 10–15 years of experience; 10% of men and 18% of women had 5–9 years of experience; and 6% of men and 5% of women had fewer than 5 years of experience.
- Education: 45% of men and only 28% of women have doctoral degrees; 22% of men and 28% of women have master's degrees; 30% of men and 39% of women have bachelor's degrees; and 3% of men and 5% of women have an associate's degree.
- Job sector: 64% of men and 53% of women work in private industry; 15% of men and 18% of women work in academia; 16% of men and 21% of women work in government or national laboratories; 1% of women work in military and no men work in that sector.
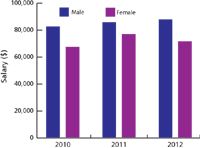
Figure 1: Salary gap between men and women.
These statistics help explain at least some of the disparity between male and female salaries. A higher percentage of the men that participated in this survey had doctoral degrees and more years of work experience, both of which have a big influence on the pay scale. It's also important to note that a higher percentage of men work in private industry, whereas a higher percentage of women work in academia and government or national laboratories.
Industry, Government, or Academia?
Spectroscopists' salaries also can vary depending on which sector of the market they work in: private industry, government or national laboratories, or academia. This year, 62% of respondents work in private industry; 17% in government or national laboratories; 17% in academia; 4% in other areas such as hospitals or nonprofits; and fewer than 1% work in the military.
Private Industry
The average salary for respondents working in the private sector is $88,993, which is about $2300 less than last year's average but still higher than our average in 2010. More than half of respondents in this category reported that they receive supplemental income (68%). The average amount of supplemental income is $27,950. Respondents in this category had the following job titles: 19% were senior scientists, researchers, or research fellows; 18% were chemists or spectroscopists; 16% were laboratory directors or managers; 9% were staff scientists, researchers, or research fellows; 7% were analysts; 5% were technical directors; 4% were laboratory technicians or technologists; 2% were CEOs or presidents; 2% were research assistants or associates; 2% were process chemists; 1% were process engineers; fewer than 1% were assistant professors; fewer than 1% were full professors; and 14% listed "other" as their job title. Their primary field of analysis was as follows: 34% analytical chemistry; 13% pharmaceuticals; 12% instrumentation design and development; 7% plastics, polymers, and rubbers; 6% agricultural or food; 6% environmental; 4% metallurgy; 3% biotechnology; 3% electronics or semiconductors; 3% inorganic compounds; 3% organic chemicals; 3% medical or biological; 2% energy or petroleum; 1% forensics or narcotics; and fewer than 1% ceramics.
Government Laboratories
Respondents working in national or government laboratories reported an average salary of $83,059, which is an increase of about $7500 compared to last year's average of $75,515. The majority of respondents in this sector (78%) did not receive supplemental income. Of the 22% that did receive supplemental income, the average amount was $2580 a year. The following job titles were reported for people in this sector: 29% were chemists or spectroscopists; 17% were senior scientists, researchers, or research fellows; 17% were laboratory directors or managers; 14% were analysts; 10% were staff scientists, researchers, or research fellows; 2% were laboratory technicians or technologists; 2% were technical directors; 1% were process chemists; 1% were process engineers; 1% were CEOs or presidents; and 7% listed "other" as their job title. Compared to the private sector, the work in government labs is more environmentally focused, with 33% of respondents reporting environmental as their primary area of analysis; 25% reported analytical chemistry, which is slightly lower than in the private sector; 17% reported forensics or narcotics — a big difference compared to the 1% that chose this category in the private sector; 9% reported agricultural or food; 5% reported instrumentation design and development; 3% reported organic chemicals; 2% reported medical or biological; 2% reported electronics or semiconductors; 1% reported inorganic chemicals; 1% reported energy or petroleum; and 1% reported metallurgy.
Academia
Respondents working in academia reported an average salary of $67,363, which is a decrease of about $2700 compared to last year's average. The majority of academic respondents (81%) do not receive any supplemental income. Of the 19% that do receive some supplemental income, the average amount is $8353. Respondents' job functions were 22% full professor; 17% associate professor; 12% assistant professor; 10% staff scientist, researcher, or research fellow; 8% research assistant or associate; 7% laboratory director or manager; 7% laboratory technician or technologist; 6% post-doc; 4% senior scientist, researcher, or research fellow; 3% analysts; 2% chemists or spectroscopists; 1% CEO or president; 1% technical director; and 1% replied "other" as their job title. The primary field of analysis in this sector was 43% analytical chemistry, which was the highest of all three sectors; 14% medical or biological, again the highest of all three sectors; 9% organic chemicals, which is 6% higher than both of the other sectors; 9% instrumentation design and development, which is lower than the private sector but higher than government labs; 5% environmental, lower than both of the other sectors; 4% inorganic chemicals, which is 1% higher than the private sector and 3% higher than government labs; 3% pharmaceuticals, which is 10% lower than the private sector and 3% higher than government labs where it was not reported at all; 3% electronics or semiconductors, about equal to both of the other sectors; 2% plastics, polymers, or rubber, which is slightly lower than private industry and higher than government labs where this was not reported; 2% agricultural or food, lower than both of the other sectors; 2% energy or petroleum, equal to the private industry and 1% higher than government labs; 1% forensics or narcotics, lower than government labs and the same as the private industry; 1% metallurgy, lower than the private sector and the same as government labs; and 1% ceramics, which was slightly higher than both sectors.
Figure 2 shows the average salaries we have reported from 2010 through 2012 for these three sectors.
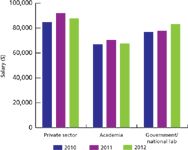
Figure 2: Salary summary by job sector, 2010â2012.
Heavy Workload and High Stress: All in a Day's Work
How many times have you stayed at work late trying to finish up or skipped lunch to get ahead on your mountain of paperwork? The common phrase "It's all in a day's work" takes on a frightening new meaning when employees are consistently putting in overtime just to keep abreast of their increasing workloads, which often go hand-in-hand with higher stress levels. A high percentage of respondents reported that their workloads and stress levels increased this year, yet the majority of people are still satisfied with their jobs.
According to our survey, 59% of respondents reported an increase in workloads over last year; 35% said their workloads stayed the same; and 5% reported a decrease in their workload (1% responded with "not applicable"). Respondents were given several choices as possible causes for increased workloads, with the option to select as many as applied: 58% selected an increase in business; 49% selected staffing cuts; 36% selected new equipment in the lab; 36% selected new handling techniques or procedures; and 24% selected new regulations.
Approximately 49% of respondents reported increased stress levels at work within the past year; 44% reported that their stress levels remained the same; 5% reported decreased stress levels; and 2% selected "not applicable." Figure 3 shows this year's stress level results compared to our results from last year. Respondents were given several choices as possible causes for increased stress levels, with the option to select as many as applied: 48% selected job insecurity or staffing uncertainty; 46% selected negative workplace attitudes; 39% selected business uncertainty; 36% selected inter-department conflicts; 25% selected recent layoffs; 23% selected lack of training and continuing education; 22% selected more stringent procedures; 10% selected that they cannot keep up with technological advances; 7% selected requirement to publish; and 5% selected foreign competition. Respondents also were given several choices as possible causes for decreased stress levels, with the option to select as many as applied: 65% selected improved workplace attitudes; 30% selected increased staffing; 15% selected new technology has increased productivity or quality; 10% selected more automation through new equipment; and 10% selected that the specialization of lab personnel decreased workloads.
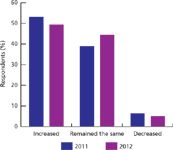
Figure 3: Stress levels, 2011â2012. (2% responded not applicable in 2012 and 1% reported not applicable in 2011.)
Happy, Nonetheless
Spectroscopists must be a happy group of people, however, because despite continued reports of increased workloads and stress they remain satisfied with their current positions: 41% report feeling satisfied; 33% feel very satisfied; and 13% feel extremely satisfied. Only 10% are not satisfied; and 3% are not at all satisfied. Figure 4 shows this year's results.

Figure 4: Job satisfaction levels with current position, 2012.
Similarly, 41% of respondents report feeling satisfied with their current employer; 27% are very satisfied; 13% are extremely satisfied; 14% are not satisfied; and 5% are not at all satisfied. Respondents wrote in answers to say why they are feeling satisfied with their employers. The most common answers were: interesting or enjoyable work, job security, good benefits, work hours, or wages, friendly environment, and good opportunities. Common responses for why respondents felt dissatisfied with their employers include limited growth opportunities, poor management, lack of training or tools, no raises, poor benefits, and unethical practices.
A Supporting Role
Working for a company that is supportive of your career development is an unseen benefit, yet it is something that employees value tremendously. According to our results, 44% of respondents feel that their company is supportive of their career advancement; 21% feel it is very supportive; 7% feel it is extremely supportive; 20% feel it is not supportive; and 8% feel it is not supportive at all. There are many ways in which a company can provide that support. For example, 57% of respondents said their company offers in-house training, including tuition reimbursement, training courses, and seminars. Another 79% of respondents said that their companies cover the cost of conferences or web seminars, even though those events might not be necessary for professional certification or career advancement. Finally, a company that offers benefits will benefit itself with happy and healthy employees; 67% of respondents work for a company that offers a 401k plan; 60% work somewhere that offers another type of retirement plan or pension; 9% work for a company that provides childcare, and several respondents wrote in other benefits such as medical benefits, stock options, profit sharing, or a company car.
Time to Make a Move?
Whether you are looking for a career change of your own free will or forced into it by a company layoff, it's a stressful and agonizing process for many, so it comes as no surprise that 57% of respondents are not considering making a job change within the next 12 months; only 21% are considering making a job change; and 22% are unsure. Of the respondents that would like to make a job change, the majority cited income as the motivator. Other reasons include professional advancement, intellectual challenge, job environment, job security, and geographic location.
Marketing yourself is a critical step in career advancement and a major factor of that is choosing the right time to move to the next job. When asked how long it will take to make their next career step, 23% of respondents said more than 5 years; 12% said 4–5 years; 11% said 3–4 years; 20% said 2–3 years; 22% said 1–2 years; and 11% said less than a year. Taking the economic downturn into account, 41% of respondents felt that they will reach their career goals but it will take longer than they originally anticipated because of the economy; 32% felt that their prospects are as good now or better than before the downturn; and 26% are not optimistic that they will ever reach their career goals. Respondents wrote in answers for what they need to reach their next career step, the responses included research; funding; teaching; retraining; more experience; stability; education; an improved economy; and increased publishing.
The Effect of Location
Last, but not least, we asked our survey respondents to tell us in which region of the country they live. This year, 30% of respondents were from the Midwest; 25% were from the Southeast; 22% were from the Northeast; 19% were from the Southwest; and 4% were from the Northwest. We also asked respondents from outside the United States to write in their locations, some of those responses included the United Kingdom, Czech Republic, the Netherlands, Canada, Spain, Italy, China, Germany, South Africa, Sweden, the Philippines, Switzerland, Belgium, France, Ireland, and India.
Figure 5 shows a breakdown of salaries by region in the United States; let's take a closer look at that data. The Southwest has the highest salary again this year, with an average of $92,238. This is a decrease from last year's average of $101,023. The education levels in this region were as follows: 47% had doctoral degrees; 33% had bachelor's degrees; and 20% had master's degrees. The focus of those degrees was chemistry (67%); physics (11%); biology (8%); biochemistry or biophysics (7%); environmental engineering or science (4%); pharmaceutical science (2%); and geology or earth science (1%). The majority of of respondents work in private industry (59%), followed by 24% in government or national labs, 13% in academia, and 1% in the military (3% selected other).
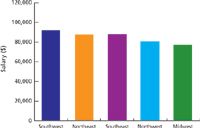
Figure 5: Salary summary by geographical region, 2012. (Southwest: CA, HI, AZ, NM, NV, CO, UT, OK, TX; Northeast: NY, MA, CT, PA, VT, NH, RI, ME, NJ; Southeast: LA, MS, AL, GA, FL, TN, KY, NC, SC, AR, DE, VA, WV, MD, DC; Northwest: OR, WA, ID, MT, WY, AK; Midwest: OH, IN, IL, IA, MO, MI, MN, WI, KS, ND, SD, NE.)
The Northeast is back in the second place seat after falling to fourth last year, with an average salary of $89,290. This is an increase of about $2500 compared to last year's average. These respondents' highest degree of education was 41% doctoral degrees; 28% bachelor's degrees; 23% master's degrees; and 7% associate degree. Degrees were mainly received in chemistry (69%); physics (8%); biochemistry or biophysics (6%); biology (4%); environmental engineering or science (4%); geology or earth science (2%); polymer science (2%); pharmaceutical science (2%); and chemical engineering (1%). The majority of respondents work in private industry (73%), followed by 14% in academia and 8% in government or national labs (5% selected other).
With an average salary difference of a mere $197 compared to the Northeast, the Southeast falls to third place this year with an average salary of $89,093. This is a decrease of about $680 compared to last year's average of $89,775, but is still much higher than 2010's average salary of $77,021. These respondents' highest degree of education was 42% doctoral degrees; 37% bachelor's degrees; 19% master's degrees; and 2% associate degrees. The areas that these degrees focus on are chemistry (73%); biochemistry or biophysics (9%); biology (6%); environmental engineering or science (5%); physics (4%); and chemical engineering (1%). Most of respondents in this region work in private industry (52%), followed by 28% in government or national labs and 16% in academia (4% selected other).
The Northwest is up this year with an average salary of $80,879, an increase of about $7500 compared to last year's average of $73,380. There was a tie between respondents in this area with bachelor's degrees (36%) and doctoral degrees (36%), and 27% had master's degrees. Degrees were mainly received in chemistry (48%); environmental engineering or science (14%); biochemistry or biophysics (9%); biology (9%); geology or earth science (9%); and physics (9%). The majority of respondents work in government or national labs (45%), followed by 32% in private industry and 18% in academia (4% replied other).
Finally, the Midwest has dropped to last place this year with an average salary of $78,851, which is an increase of about $75 compared to last year's average of $78,777. Respondents in this region reported the following education levels: 39% have bachelor's degrees; 36% have doctoral degrees; 21% have master's degrees; and 4% have associate degrees. Degrees were mainly received in chemistry (76%); biology (8%); biochemistry or biophysics(5%); chemical engineering (5%); polymer science (2%); geology or earth science (1%); physics (1%); and environmental engineering or science (1%). The majority of respondents work in private industry (66%), followed by 20% in academia and 10% in government or national labs (4% replied other).
Methodology
The staff of Spectroscopy designed the 2012 Spectroscopy Salary Survey and administered it using an on-line survey tool. A link for the on-line survey successfully sent to 33,336 subscribers and a total of 628 individuals responded. The field time for the survey was December 6, 2011 through February 1, 2012 (and two reminder emails were sent out). To encourage participation, subscribers who responded to the survey were entered into a drawing to win one of five $100 gift cards.
Reference
(1) N.S. Johnson, Spectroscopy 17(3), 18 (2002).
Best of the Week: AI and IoT for Pollution Monitoring, High Speed Laser MS
April 25th 2025Top articles published this week include a preview of our upcoming content series for National Space Day, a news story about air quality monitoring, and an announcement from Metrohm about their new Midwest office.
LIBS Illuminates the Hidden Health Risks of Indoor Welding and Soldering
April 23rd 2025A new dual-spectroscopy approach reveals real-time pollution threats in indoor workspaces. Chinese researchers have pioneered the use of laser-induced breakdown spectroscopy (LIBS) and aerosol mass spectrometry to uncover and monitor harmful heavy metal and dust emissions from soldering and welding in real-time. These complementary tools offer a fast, accurate means to evaluate air quality threats in industrial and indoor environments—where people spend most of their time.