A Brush with Frequency Comb Spectroscopy: A Developing Story
In the late 1990s and early 2000s, frequency combs upended metrology, providing linkages that allowed accurate measurement of differences in microwave and optical frequencies. As the technology around frequency comb generation has matured, numerous other uses have been discovered. Here, we will discuss the some of the methods of application of frequency combs to spectroscopy, and some of the recent implementations that may make practical, fieldable spectroscopic devices with frequency combs ready in the near future.
A frequency comb is a laser source with a series of evenly spaced narrow lines exhibiting phase coherence. The most common way to produce a frequency comb is with a mode-locked ultrafast laser. It was for their contributions to frequency comb development that John Hall and Theodor Hänsch earned their share of the Nobel Prize in Physics in 2005. Frequency combs can also be produced by modulation of a continuous wave laser, or four-wave mixing in a crystal.
Considering the mode-locked ultrafast laser, in the time domain, the electric field of the pulse waveform looks like a sinusoid in a Gaussian envelope, as shown in Figure 1a. The period of the sinusoid is equivalent to twice the length of the laser cavity (a round trip), divided by the group velocity. In frequency space, this looks like a series of narrow lines separated by the laser pulse repetition frequency, as in Figure 1b. Thus, the laser repetition frequency drives the resolution in many applications. The typical spectrum of a frequency comb can have hundreds (or even thousands) of lines, and can extend up to an octave in frequency space.
FIGURE 1: (a) The output of a mode-locked ultrafast laser contains components from a group of longitudinal cavity modes, collectively emitted with a time spacing of Tr at a frequency of fr. These modes each add to the laser pulse. Dispersion-induced phase- and group-velocity distributions relate to the coherence of the pulse, resulting in a frequency offset f0. (b) In frequency space, this periodic wavetrain can be described as a Fourier series, with each component frequency νN having a specific amplitude.
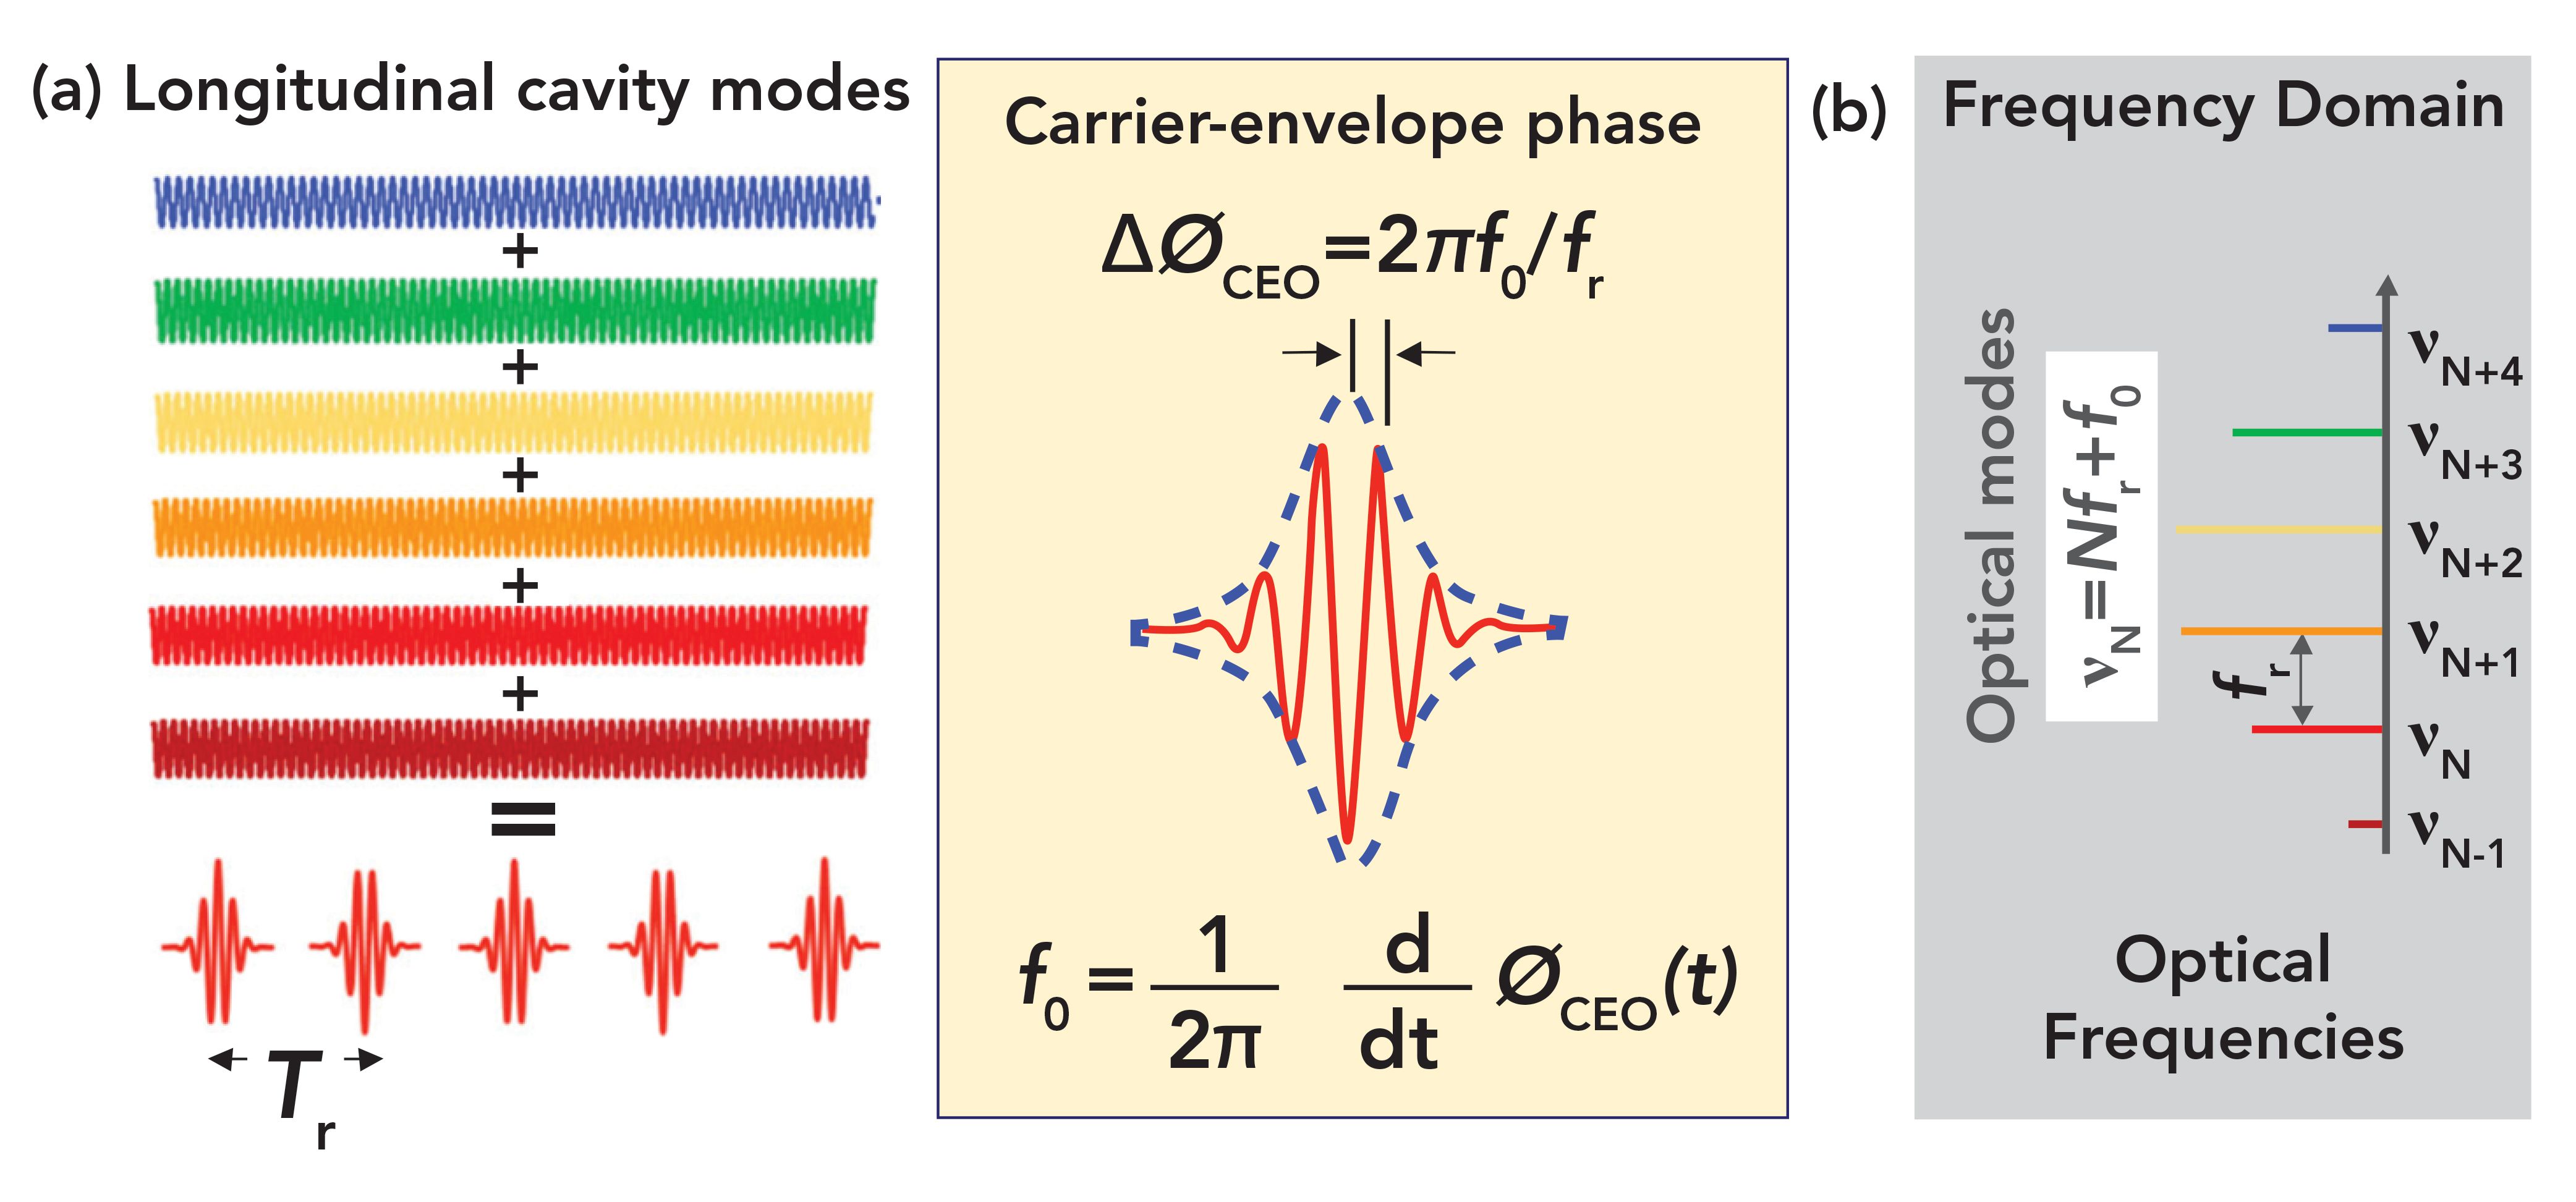
There are several excellent references that provide details about frequency comb operation in the context of spectroscopy (1,2). In practice, the comb from a mode- locked ultrafast laser is very simply parameterized by a group of comb frequencies fN,
fN = nfr + f0 [1]
where fr is the repetition frequency of the laser, n is a large integer, and f0 is a frequency offset related to the dispersion in the cavity or gain medium that can be tuned. In practice, the absolute spacing between comb lines is set by the laser repetition rate fr and the fine tuning of the comb to hit specific wavelengths is accomplished by feedback and control of the laser cavity (length and dispersion) to influence the interaction between laser modes and adjust the carrier mode frequency offset f0. Detection and control of f0, in combination with fr, provides knowledge of the exact wavelength of every mode of the optical comb. Details of measurement of f0, which is non-trivial, are given in reference (1).
Generation of frequency combs is easiest in the near-infrared (NIR), where ultrafast lasers such as Ti:sapphire and fiber lasers have been instrumental to development. Up-conversion and down-conversion of these sources is the most prevalent method of accessing the visible, mid-infrared (MIR), or longwave regions of the spectrum, although other methods exist. Frequency translation of NIR sources can be done using nonlinear conversion in optical crystals or in photoconductive antennas, where frequency mixing with secondary continuous wave (CW) or pulsed sources can facilitate translation of the wavelength. Combs can be filtered using Fabry–Pérot interferometers or other methods to access particular lines or regions of the spectrum. Further details about comb technology availability in particular spectral regions is given in references (1,2), and elsewhere.
Applications of Frequency Combs to Spectroscopy
The Frequency Comb as a Direct Source
The simplest way of using a frequency comb is as a direct light source with a single detector. Line widths of gas-phase molecular transitions at atmospheric pressure are suitably narrow, for example, that a particular comb line can be matched to a particular molecular transition for absorption or excitation. In this case, ideally all other comb lines would be detuned from transitions, and a single detector can be used to monitor the result without interferences. For 2-photon excitation, the even spacing of the comb lines is a boon; all of the lines around a central frequency 1⁄2v will combine in pairs to add to the transition frequency v, and hence substantial power can be applied to pump the transition. Possibly the earliest example of this was given in some early work by Hänsch’s group at Stanford in 1978 (3).
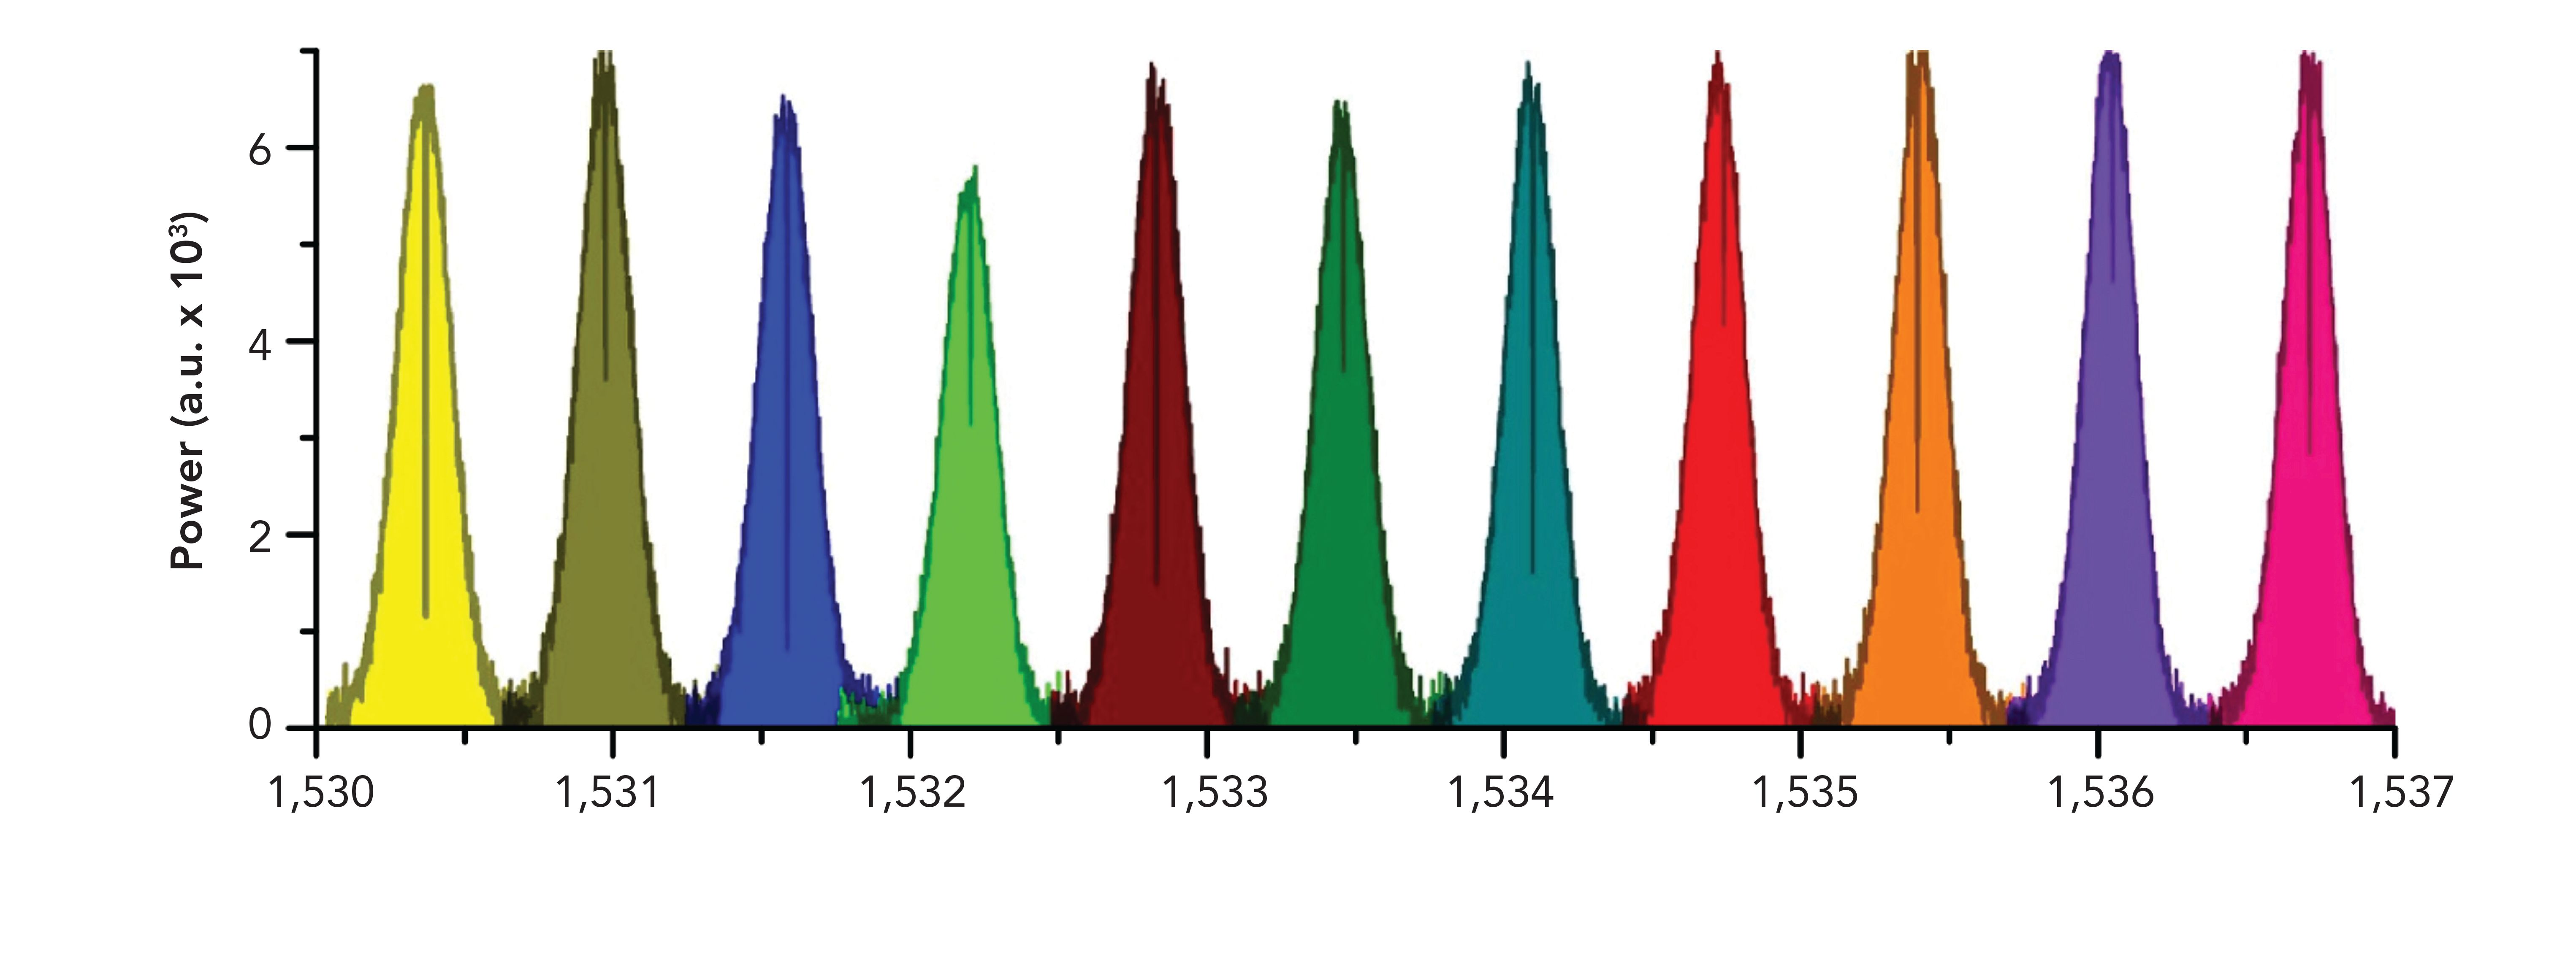
A relatively recent example of using a frequency comb as a direct source is given by Coluccelli and associates (4). Their 2016 contribution demonstrated an all-fiber direct comb measurement. They demonstrated their frequency comb method on acetylene, C2H2. Instead of collecting the light on a single-element detector, they imaged the transmission measurement on a 320 x 256 indium gallium arsenide (InGaAs) camera, following collection through a multimode fiber. Each wavelength has a predetermined multimode (MM) speckle pattern; this pattern was stored for each wavelength of interest and subsequently used to calibrate the wavelength during measurement. Figure 2 illustrates measurement of multiple bands of C2H2.
FIGURE 2: A sequence of transmission spectra by a 142-mm cell filled with pure 12C2H2 at pressure of 10 mbar acquired with the MM fiber spectrometer. The sequence has been measured by setting a tunable filter (−10 dB band of 0.6 nm) at the desired central wavelength and imaging the speckle patterns at the MM fiber output onto an InGaAs camera (40-μs exposure time, 10 frames averaged). Each spectrum spans 1 nm and is sampled by ~500 comb lines.
The Frequency Comb in Combination with a Spectrometer
For studies of condensed phases, typically less resolution is needed and multiple lines are used to interact with a broader feature in the sample. In most cases, standard dispersive spectrometers do not have the resolution to resolve individual comb lines, but this is not required. Rather, the frequency comb is used as a broadband source.
When more resolution is required, creative approaches have been used. Fabry–Pérot resonators can be used to filter for specific comb lines, such that specific transitions are targeted. One of the most innovative approaches has been using ringdown spectroscopy in conjunction with a dispersive spectrometer. Thorpe and colleagues modeled the transfer function of the many laser lines through a 1⁄4-meter spectrometer with a 25 GHz resolution (corresponding to about 60 comb lines), following absorption in a cavity ringdown cell. The time-based ringdown signal of the multiple lines at each detection frequency was deconvoluted, yielding pristine absorption spectra of Ar, C2H2, H2O, O2, and NH3 (5).
Michelson Interferometer-Based Comb Spectroscopy
The high brightness and discrete lines in a frequency comb enhance the results in applications using a Michelson interferometer. Compared with standard setups using a broadband source, using frequency combs in the interferometer keep all of the good features of the method, but eliminate some of the drawbacks. For example:
- High brightness of the laser at specific comb wavelengths decreases measurement time.
- Ability to resolve individual comb lines substantially improves the overall resolution, previously dependent on the travel of the moving mirror in the interferometer. The instrumental function is no longer a significant factor in measured line shapes.
- Exact wavelength referencing in the comb (possible but not always implemented) eliminates the need for reference features in the sample.
For these reasons, Fourier transform spectroscopy (FTS) with a Michelson interferometer using frequency combs has substantial potential, particularly in gas-phase infrared analysis. It benefits from a large base of knowledge and peripherals such as long-path cells.
An example of FTS with a frequency comb in the mid-infrared is given in the recent paper by Sadiek and colleagues (6). They used a mid-IR frequency comb produced by a high-power 125 MHz Yb-doped fiber laser down-converted through difference frequency generation in a Mg-doped periodically-polled lithium niobate crystal, after mixing with a Raman-shifted soliton generated from the same Yb-doped fiber laser in a highly nonlinear fiber. This is a good example of the complexity of comb generation outside of the relatively easy near-infrared region.
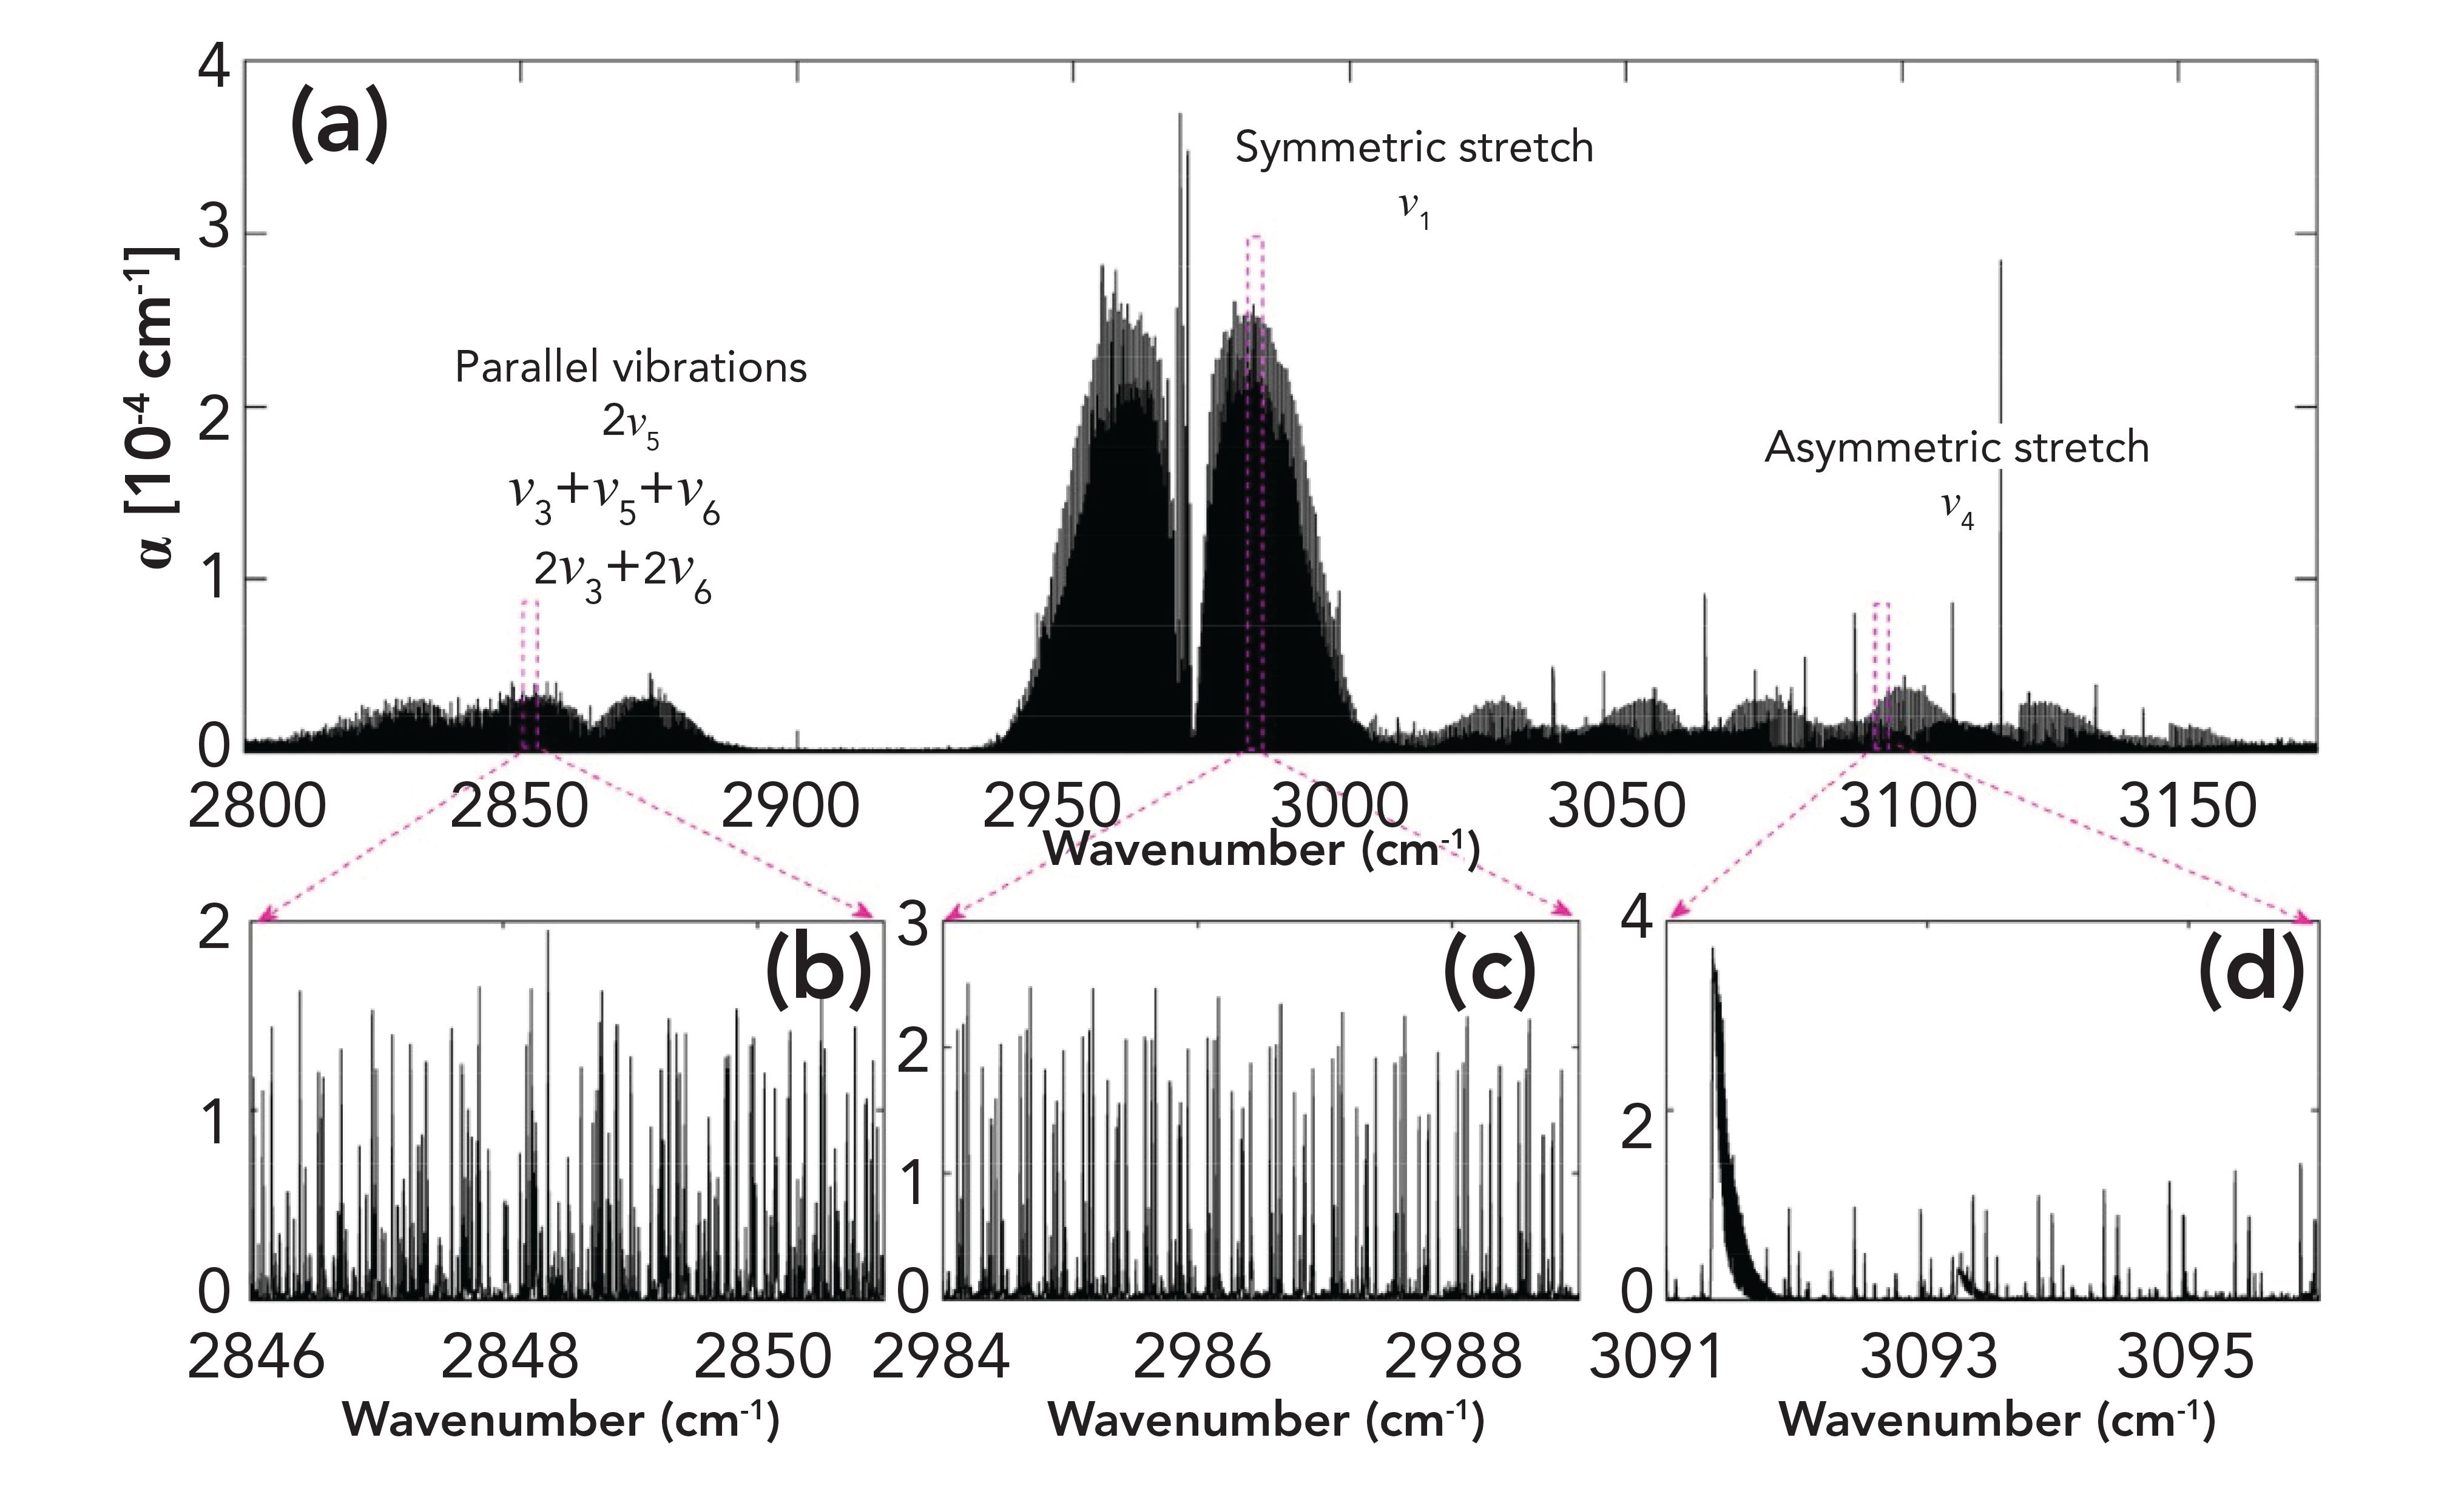
The authors used this source to measure a high-resolution spectrum in the C-H stretch region from 2800 to 3160 cm-1 (~ 3.3 μm) of iodomethane (12CH3I). A series of measurements at 125 MHz were interleaved to obtain a final sample point spacing of 11 MHz, which translates to approximately 0.4 picometer resolution at a wavelength of 3.3 μm. The resulting high-resolution spectrum is shown in Figure 3.
FIGURE 3: (a) Overview of the broadband high-resolution spectrum of pure CH3I measured at 0.03 mbar in the range from 2800 to 3160 cm-1. (b)-(d) The zoomed in spectra showing the dense ro-vibrational structures of the different bands. Spectra in panels (b) and (d) were measured at a pressure of 0.11 mbar to increase the absorption signal due to the lower intensity compared to the ν1 band in panel (c).
Dual-Comb Spectroscopy
Dual-comb spectroscopy removes the requirement for a moving mirror for Fourier transform spectroscopy. Instead of generating a frequency difference by projecting a single source along both of the paths in the Michelson interferometer, with one path having a moving mirror, dual-comb spectroscopy uses two frequency combs. The reference comb is held at a particular frequency fr, and the second comb is at a frequency fr + δf. The second comb is sent through the sample to be analyzed, and (as in a Michelson interferometer), both combs are directed to a single detector. Over time, the second comb sweeps through the first.
This has the same effect as a moving mirror in a traditional Michelson interferometer, but with some notable advantages. Obviously, a mechanical component is removed, potentially increasing reliability and simplicity. Second, the resolution is strictly limited only by the repetition frequency fr, which determines the spacing between the comb teeth. Difficulties include phase and frequency-locking between the lasers. In the frequency domain, imperfections in locking leads to broadening of features. However, substantial work is underway to minimize these issues for fieldable systems; even more than a decade ago laboratory researchers had achieved sub-picometer resolution for gas phase spectra in the near-infrared with high signal-to-noise (7). Dual-comb spectroscopy is probably the most promising mode for applications, as it requires no moving parts and can be accomplished with a single detector. An excellent, relatively recent, overview is given by Coddington and colleagues (8).
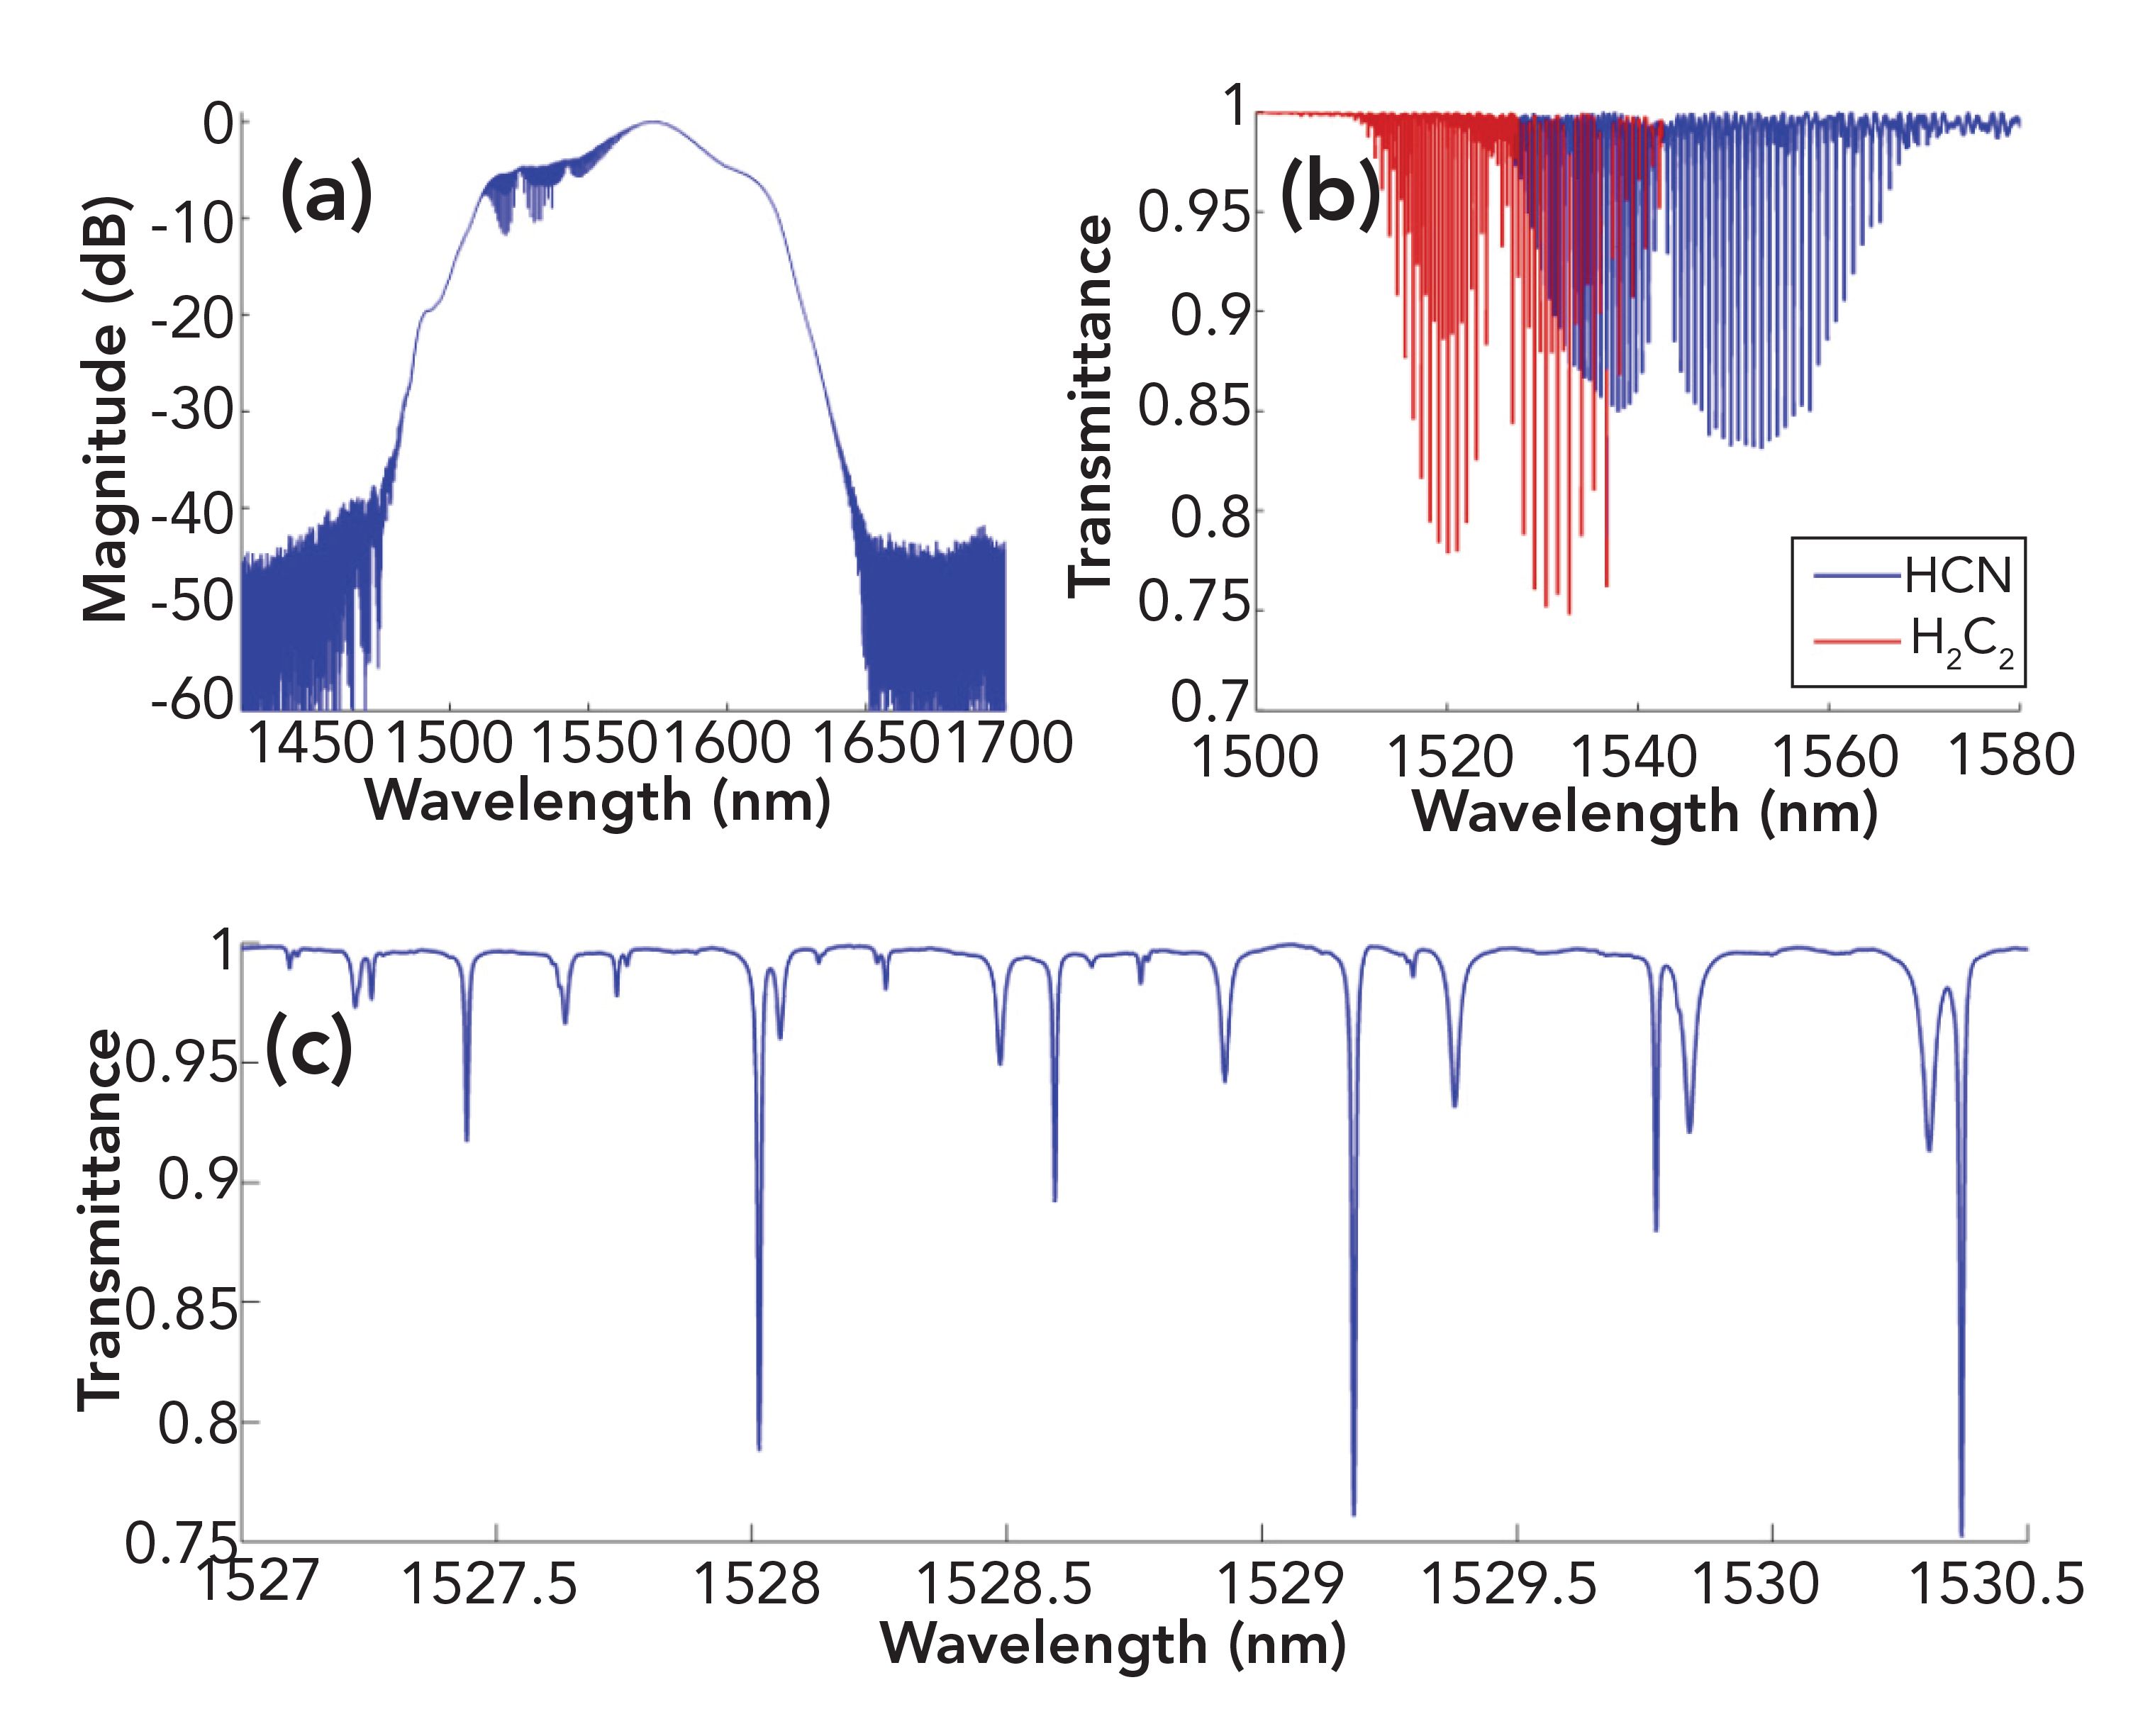
An approach that seems to be one of the most straightforward for eventual application relies on digital processing on a high-speed FPGA to continuously correct and average interferograms from dual-comb spectrometers. This somewhat relaxes the mode-locking requirements and improves spectral quality. Roy and associates achieved real-time processing on signals acquired at 100 MHz during one of the first demonstrations of digital correction of dual-comb spectra in 2012 (9). Their results with a combination of hydrogen cyanide and acetylene are shown in Figure 4. Digital processing capabilities have improved substantially in the intervening nine years, and multiple groups and manufacturers are working on making dual-comb spectrometers practical for laboratory and even field use.
FIGURE 4: Spectrum from a 24-hour measurement with real-time digital correction of interferograms. (a) Full spectrum on a logarithmic scale. (b) Transmittance from gas cells containing C2H2 and HCN. The baseline was normalized by fitting. (c) Zoom between 1527 nm and 1530.5 nm of the cell’s transmittance. Difference in the width between HCN and C2H2 lines is attributable to the pressure in the two cells.
Another recent set of efforts has been to use dual-comb spectroscopy to measure high-speed or transient events, such as combustion, rapid chemical reactions, or laser plasmas. The Jones group at the University of Arizona, in conjunction with researchers at the Pacific Northwest National Laboratory and privately held Opticslah, LLC, have pioneered single-shot time-resolved measurements in evolving laser-induced plasmas, and have recently shown a “burst mode” dual-comb spectroscopy method involving delay lines to create a series of time-resolved measurements in laser plasmas (10).
Outlook for Frequency Comb Spectroscopy
This article has attempted to outline for the non-specialist some of the salient features of the burgeoning work in frequency comb spectroscopy. There is a rich literature and a highly active community in physics, chemistry, and engineering working to develop methods and new applications for frequency combs in metrology.
This rapid evolution is making practical frequency comb spectroscopy closer to reality, as continued development clears technical hurdles and simplifies systems. Laboratory instruments based on fiber lasers and mid-infrared quantum cascade lasers are beginning to appear. A surge in activity around single-cavity dual-comb lasers, microresonators, quantum cascade lasers, and interband cascade lasers holds hope to deliver field-deployable and compact spectrometers in the foreseeable future. Size, weight, and power (SWAP) of demonstration systems is decreasing and in many cases is compatible with battery power. With an eye to fieldable applications, I am keenly looking forward to the next decade of development in frequency comb spectroscopy!
References
(1) T. Fortier and E. Baumann, Commun Phys. 2, 153 (2019). https://doi. org/10.1038/s42005-019-0249-y
(2) N. Picqué and T.W. Hänsch, Nat. Photonics 13, 146–157 (2019). https://doi.org/10.1038/s41566- 018-0347-5
(3) J.N. Eckstein, A.I. Ferguson, and T.W. Hänsch, Phys. Rev. Lett. 40, 847–850 (1978).
(4) N. Coluccelli, Nat. Commun. 7, 12995 (2016) https://doi.org/10.1038/ncomms12995
(5) M.J. Thorpe, et al., Science 311(5767), 1595-1599 (2006).
(6) I. Sadiek, et al. J. Quant. Spectrosc. Radiat. Transfer 255, 107263 (2020).
(7) I. Coddington, et al., Phys. Rev. Lett. 100, 013902 (2008).
(8) I. Coddington, et al., Optica 3(4), 414–426 (2016).
(9) J. Roy, et al., Opt. Express 20, 21932–21939 (2012)
(10) Y. Zhang, et al., Optics Letters 46(4), 860–863 (2021).
Steven G. Buckley, PhD, is the General Manager of the Applied Systems business at Ocean Insight, an affiliate associate professor at the University of Washington, and has started and advised numerous companies in spectroscopy and in applications of machine learning. He has approximately 40 peer-reviewed publications and 6 patents. His work in practical optical spectroscopy, such as LIBS, Raman, and TDL spectroscopy, dovetails with the coverage in this column, which reviews methods (new and old) in laser-based spectroscopy and optical sensing. Direct correspondence to: SpectroscopyEdit@mmhgroup.com. ●


Real-Time Battery Health Tracking Using Fiber-Optic Sensors
April 9th 2025A new study by researchers from Palo Alto Research Center (PARC, a Xerox Company) and LG Chem Power presents a novel method for real-time battery monitoring using embedded fiber-optic sensors. This approach enhances state-of-charge (SOC) and state-of-health (SOH) estimations, potentially improving the efficiency and lifespan of lithium-ion batteries in electric vehicles (xEVs).