A Novel High Selectivity Fluorimetric and Colorimetric Probe Based on Rhodamine B Hydrazide Derivatives for Detecting Hg2+ in Aqueous Media
A colorimetric and fluorescent dual-channel chemosensor (G1) with a simple structure was designed and synthesized to identify Hg2+ in an aqueous solution with high selectivity and sensitivity. After adding Hg2+, the color of G1 in the dimethyl sulfoxide (DMSO)/H2O (2:8, v/v) solution changed from colorless to a distinct rose red, whereas the fluorescence changed from colorless to bright orange under ultraviolet (UV) light. The detection limit on the fluorescence response of G1 to Hg2+ was as low as 6.09 × 10⁻⁷ mol/L. The results of the Job’s plot suggested that the combined stoichiometry between G1 and Hg2+ was 1:1. By successively adding Hg2+ and ethylenediaminetetraacetic acid (EDTA), the fluorescence process can be reversed and almost no fluorescence loss. In addition, G1-based test strips were produced and were able to qualitatively detect Hg2+ in tap water.
With the development of science and technology, mercury (Hg) is widely used in medical, military, and electrical applications (1–3). Hg2+ is easily accumulated in the human body, and its great toxicity lies in its strong ability to bind to thiol groups and amino groups in proteins and enzymes (4,5), which can further cause vision loss, mental disorders, movement disorders, tumor formation, and other diseases (6–8). After mercury-containing compounds are introduced into the ecosystem, their strong migration and low degradation pollutes the environment (9–11). The maximum allowable limit of mercury ions in drinking water that was stipulated by the World Health Organization is 6 ng/mL (12–14).
In recent years, more fluorescent sensors, nanoparticles, and chemical probes have been developed for mercury (II) detection because of their simple operation, high sensitivity and selectivity, and short detection time (15–22). However, most of the functional groups of fluorescent probes are easily oxidized and contain sulfur (23–26), which is highly toxic (27–34). Therefore, it is of great significance to develop an effective and rapid detection method for mercury ions.
Our research group has studied mercury-detecting probes for a long time (35–43). Rhodamine is a type of fluorescent probe luminescent group with high fluorescence quantum efficiency, favorable water solubility, and a high absorption coefficient (44–46). In the absence of Hg(II), rhodamine was present in the nonfluorescent spiral state. However, with the addition of Hg(II), the color changed, the fluorescence emission was enhanced, and the spiral ring opened. Because of these observations when Hg(II) is added to rhodamine, it makes rhodamine an ideal signal group for detecting Hg(II) (47,48). In this paper, we designed a probe, G1, based on a rhodamine-benzaldehyde derivative, and systematically investigated the recognition performance toward metal ions. After adding Hg2+, the G1-based ring went through an opening process, the solution color changed from colorless to red, and the fluorescence changed from a closed to an open state. Rhodamine B acted more effectively in Hg2+ detection because of its long excitation wavelength, good light stability, high fluorescence quantum yield, good water solubility, and less toxicity compared to other rhodamines. The results showed that G1 was an open fluorescence sensor with high sensitivity and high selectivity to detect Hg2+. The test paper based on the probe G1 was constructed, and that was able to successfully detect Hg2+ in water.
Experimental
Materials and Physical Methods
All reagents and solvents in the experiment were purchased from the market without further purification. Perchlorate salt of cations (Cu2+, Fe3+, Co2+, Ni2+, Cd2+, Pb2+, Zn2+, Cr3+, Hg2+, Ag+, Ca2+, and Mg2+) were purchased from Alfa-Aesar Chemical Reagent Co. and stored in a vacuum desiccator. Melting points were performed on an X-4 digital melting point apparatus. The ultraviolet-visible (UV-vis) absorption spectra and fluorescence emission spectra was carried out by a UV-2550 UV-vis absorption spectrometer and an RF-5301 fluorescence spectrometer using a 1-cm quartz cell. Data from 1H NMR and 13C NMR were recorded using a Varian Mercury-400BB A nuclear magnetic resonance (NMR) spectrometer and the measured mass spectrometry (MS) data was recorded using a ZAB-HS mass spectrometer instrument.
Synthesis of Compound 1
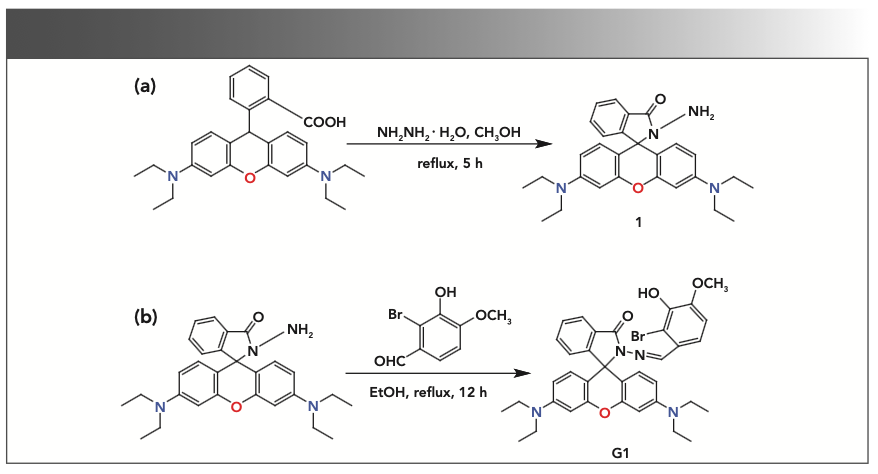
Compound 1 was obtained by one-step condensation (49), using rhodamine B (1.92 g, 4 mmol) and hydrazine hydrate (2 mL, 4 mmol) in methanol (20 mL). The reaction was refluxed 75 °C for 6 h. After the reaction was completed, it was cooled to room temperature. When the pH was adjusted to 8 with a sodium hydroxide (NaOH) solution, a large amount of solid precipitation occurred. The compound was then washed three to four times with distilled water to produce a pale pink compound in 81% yield, melting point: 213–215 °C.
Synthesis of G1
Compound 1 (0.92 g, 2 mmol) and 2-bromo-3-hydroxy-4-methoxybenzaldehyde (0.46 g, 2 mmol) were dissolved in ethanol (20 mL), and the solution was stirred and refluxed for 6 h. After the mixture was cooled to room temperature and the precipitate was washed with distilled water, the mixture was filtered and the precipitate was recrystallized with DMF-H2O to give a crimson compound in 77% yield. As shown in Scheme 1, the melting point was between 234–236 °C.
SCHEME 1: The synthesis process of G1.
General Procedure for UV-vis and Fluorescence Spectroscopy Experiments
In UV-vis and fluorescence experiments, G1 and several cations (Cu2+, Fe3+, Co2+, Ni2+, Cd2+, Pb2+, Zn2+, Cr3+, Hg2+, Ag+, Ca2+, and Mg2+) were prepared in DMSO solution. At the same time, the subjects in all experiments were kept at a con- stant concentration (2.0 × 10⁻⁵ M). The UV-vis absorption spectrum and the fluorescence spectrum were measured using a UV-2550 UV-vis absorption spectrometer and a RF-5301 fluorescence spectrometer, respectively.
General Procedure for 1H NMR Experiments
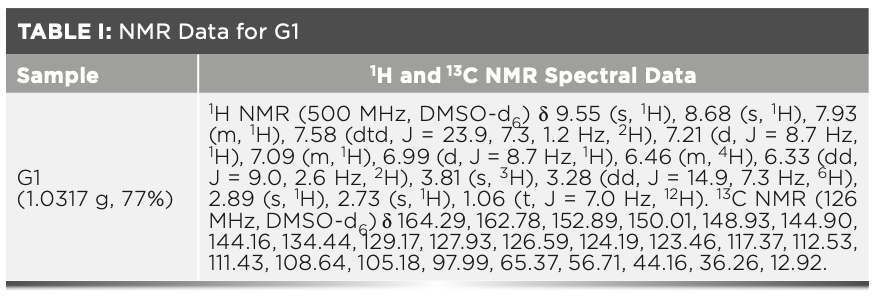
The procedure was as follows: 5 mg of ligand G1 was dissolved in an nucleus magnetic tube with DMSO-d6, and 0.01 mol/L of a Hg2+ solution was prepared with DMSO-d6, the latter being added to the former in the corresponding amount. Then, the measurement was carried out in a Varian Mercury-400BB NMR apparatus (Table I).
Results and Discussion
After adding 50 equivalents of various cations (Cu2+, Fe3+, Co2+, Ni2+, Cd2+, Pb2+, Zn2+, Cr3+, Hg2+, Ag+, Ca2+, and Mg2+) in a G1 (2.0 × 10⁻⁵
v/v) solution at room temperature, we observed these solutions changing. The results showed that a wide absorption peak appeared at 562 nm on the UV-vis absorption spectrum. However, no significant change was observed after adding other cations to the G1 solution. Meanwhile, it was observed that the G1 solution changed from colorless to rose red after the addition of Hg2+ alone (Figure 1).
FIGURE 1: (a) UV-vis spectra of G1 (2.0 × 10⁻⁵ M) in the presence of 50 equivalent various anions in a DMSO:H2O (2:8, v/v) solution. Inset: Color changes of G1 (2.0 × 10⁻⁵ M) with various anions (50 equivalent) in the DMSO:H2O (2:8, v/v) solution. (b) Fluorescence spectrum of G1 (2.0 × 10⁻⁵ M) in the presence of 50 equivalent various anions in a DMSO:H2O (2:8, v/v) solution. Inset: Color changes of G1 (2.0 × 10⁻⁵ M) after adding Hg2+ at room temperature under UV light.
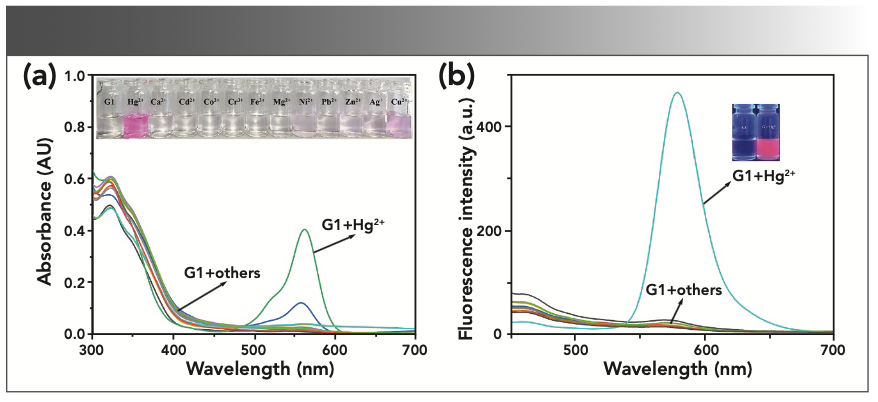
The fluorescence spectrum showed that G1 in a DMSO/H2O (2:8, v/v) solution had almost no fluorescence under 437 nm excitation. With the addition of Hg2+ to the G1 solution, the fluorescence intensity at 578 nm was significantly enhanced and a change in fluorescence color from colorless to bright orange could be observed. At the same time, other cations (Cu2+, Fe3+, Co2+, Ni2+, Cd2+, Pb2+, Zn2+, Cr3+, Hg2+, Ag+, Ca2+, and Mg2+) didn’t cause any significant change in the fluorescence emission of the G1 solution. The results suggested that the G1 solution was able to uniquely identify Hg2+.
We conducted the Hg2+ titration experiment at room temperature to investigate the change in the response of G1 (2.0 × 10⁻⁵ M) to the ring opening of the rhodamine derivatives in the DMSO/H2O (v/v =2:8) solution. As shown in Figure 2, the Hg2+ (0.1 M) gradually added to the DMSO/H2O (2:8, v/v) solution of G1, and the changes in UV-vis absorption spectrum and fluorescence spectrum were observed. In the UV-vis absorption spectrum, as Hg2+ increases from 0 to 15.2 equivalents, the absorption peak at 562 nm gradually increases. Figure 4 shows the change in fluorescence emission spectra with the addition of Hg2+. At the excitation at 400 nm, when the concentration of Hg2+ increased from 0 to 24.1 equivalents, the fluorescence intensity of the host gradually enhanced.
FIGURE 2: (a) Absorbance spectra titration of G1 (2.0 × 10⁻⁵ M) in the presence of different concentrations of Hg2+ in DMSO:H2O (v/v= 2:8). (b) Fluorescence intensity titration of G1 (2.0 × 10⁻⁵ M) in the presence of different concentrations of Hg2+ in DMSO/H2O (v/v= 2:8).
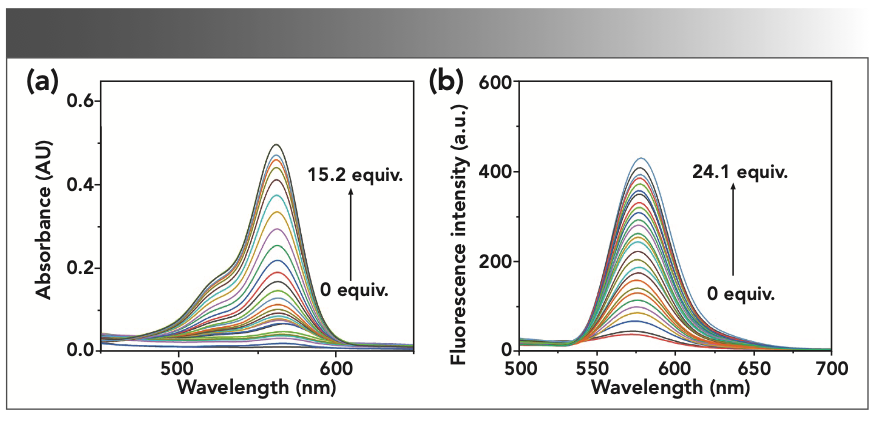
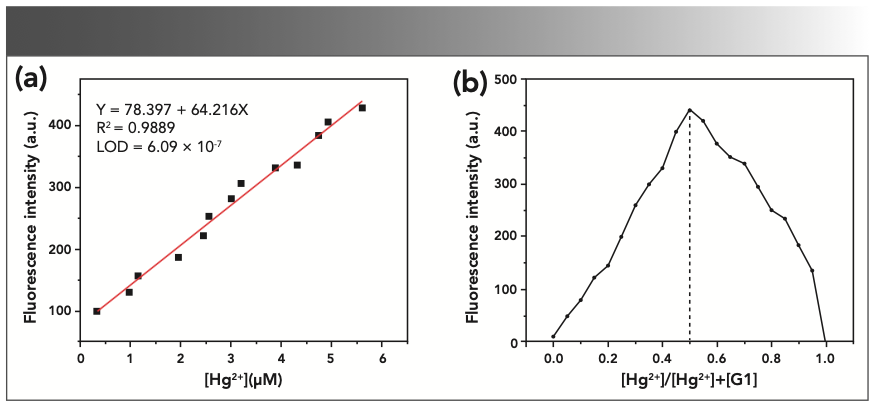
FIGURE 4: (a) Fluorescence detection limit spectra of G1 in a DMSO:H2O (v/v =2:8) solution upon adding an increasing concentration of Hg2+. (b) Job’s plots of G1 and Hg2+.
To further verify the selectivity of the sensor G1, we studied the recognition ability of the host G1 to Hg2+ in the presence of a series of cations (Cu2+, Fe3+, Co2+, Ni2+, Cd2+, Pb2+, Zn2+, Cr3+, Hg2+, Ag+, Ca2+, and Mg2+) by recording the changes in the UV-vis spectra and the fluorescence spectrum. As shown in Figure 3, we found that the absence of Hg2+, no significant spectral changes were observed after the addition of other cations to G1. However, when Hg2+ was added to the solution, they all showed significant spectral changes. The experimental results showed that other cations had considerable influence on the recognition of Hg2+ by G1 in the UV-vis spectra and fluorescence spectrum.
FIGURE 3: (a) Absorbance spectra changes for G1 (2.0 × 10⁻⁵ M) in the presence of selected metal ions in DMSO:H2O (v/v =2:8) solution. (b) Fluorescence spectra of G1 (2.0 × 10⁻⁵ M) in the presence of selected metal ions in a DMSO:H2O (v/v =2:8) solution.
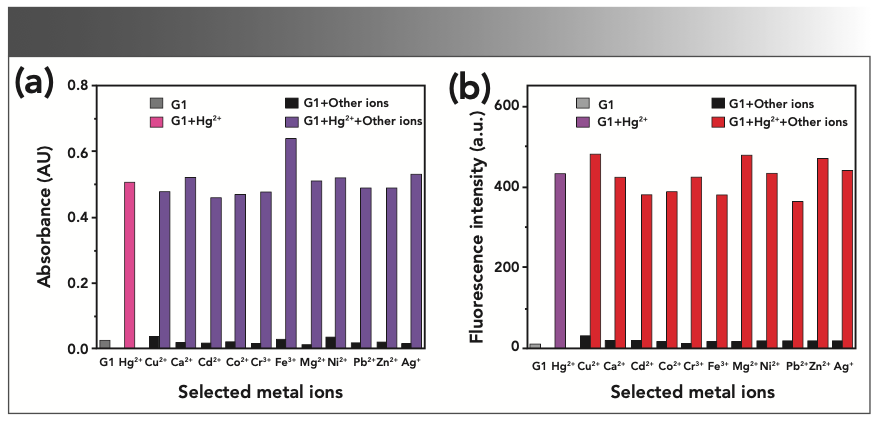
Figure 4 shows that the fluorescence intensity of G1 changes almost linearly with the increase of the Hg2+ concentration. As calculated on the basis of 3SB/S (where SB is the standard deviation of the blank solution and S is the slope of the calibration curve) (50), the detection limit was down to 6.09 × 10⁻⁷ M. To determine the stoichiometric ratio of G1 and Hg2+, we set the total concentration of the host and guest as a fixed value, and a Job’s plot was drawn. We changed the ratio of the host and guest in the solution before measuring the fluorescence spectrum. The result showed that the stoichiometric ratio of G1:Hg2+ is 1:1.
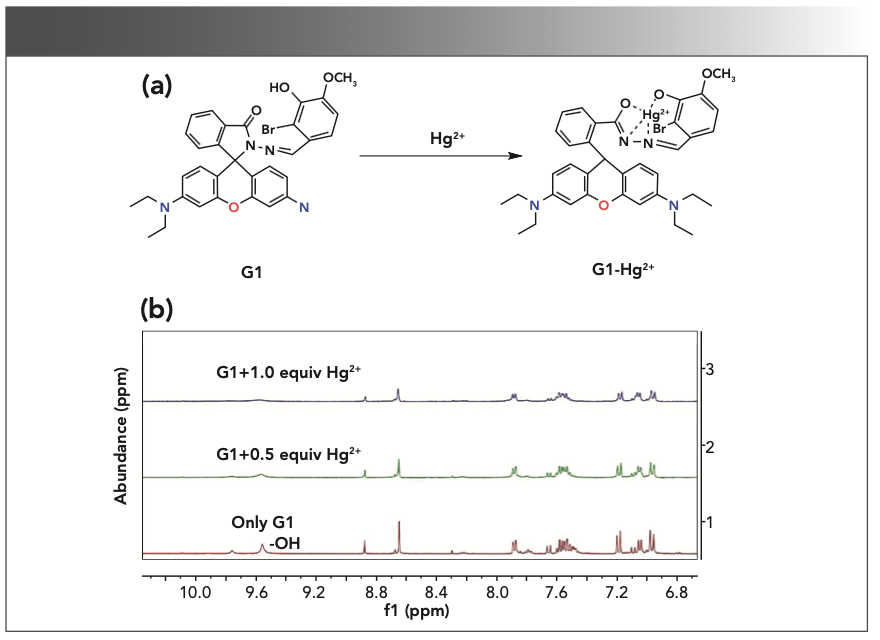
To explore the mechanism of sensor G1 for Hg2+, 1H NMR titration was carried out. As shown in Figure 5, G1 has a single peak at 8.64 ppm and 9.55 ppm in DMSO-d6, which corresponds to−CH=N and−OH, respectively. After Hg2+ was added, the −OH peak of the G1 gradually disappeared. In addition, the proton peak in the benzene ring also had a splitting phenomenon because of the electron density change caused by the ring opening of the spirolactam of the G1. Based on these results, we showed the possible reaction mechanism between G1 and Hg2+.
FIGURE 5: (a) The proposed reaction mechanism between G1 and Hg2+. (b) 1H NMR spectrum changes of different amounts of Hg2+ added dropwise in a G1 solution.
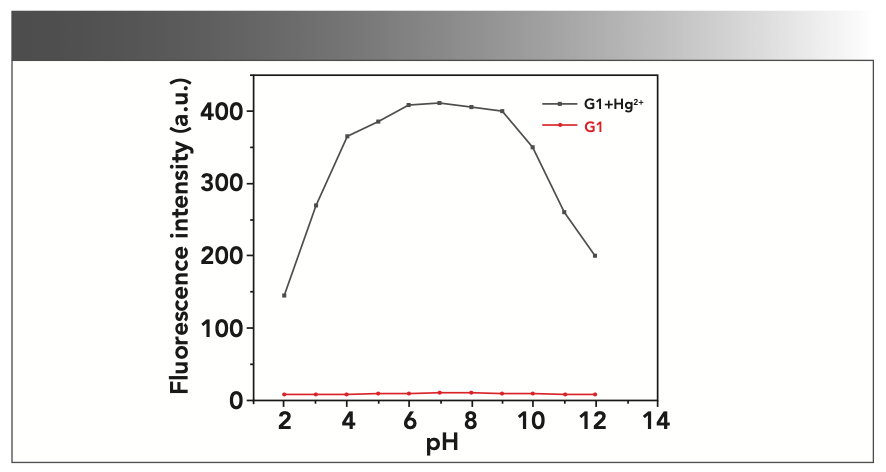
To test the effect of pH (2–12) on the recognition process of G1 in the DMSO/H2O (2:8, v/v) solution, we added Hg2+ to the different pH values of the G1 buffer solution for pH experiments. When adding Hg2+ to G1 buffer solutions of different pH values, it was found that the host G1 recognized Hg2+ in the pH range of 4–9. It indicated that the recognition of ions with the host G1 is affected by pH (Figure 6).
FIGURE 6: Corresponding fluorescence intensity of G1 to Hg2+ under different pH conditions.
Application
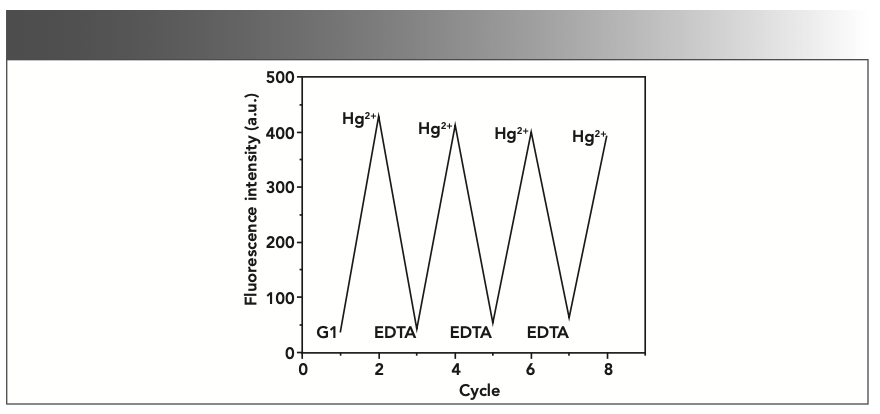
We studied the repeatability of the sensor and added ethylenediaminetetraacetic acid (EDTA) to the G1-Hg2+ mixture to test and identify whether the process was reversible. As shown in Figure 7, the fluorescence of the G1-Hg2+ solution restored to the initial state after EDTA was added, indicating that the complexation process of the main body G1 Hg2+ was reversible. Because of the strong complexing ability of EDTA of Hg2+, the sensor demetalized and spironolamide ring regeneration led to the fluorescence quenching again after EDTA and Hg2+ complexed. The fluorescence of sensor G1 can be switched “Off-On-Off” repeatedly, with little fluorescence loss during this process.
FIGURE 7: The reversibility of the fluorescence of G1 controlled by alternating additions of EDTA and Hg2+.
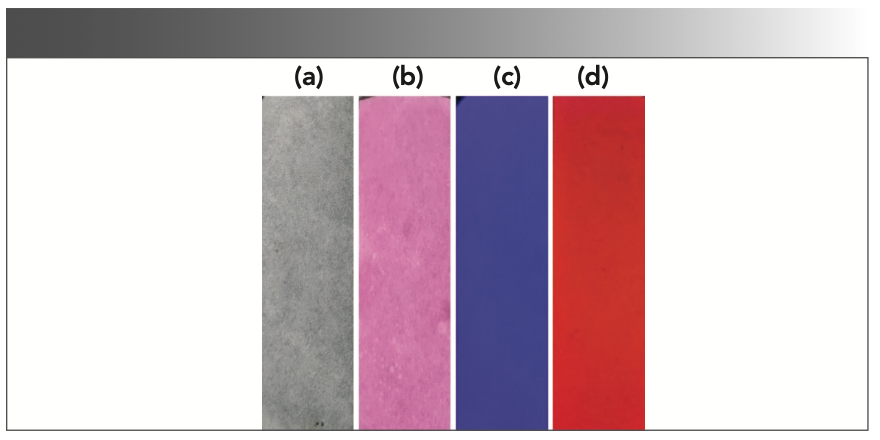
We made test strip based on the host G1, which could quickly detect Hg2+ in the actual environment. We dipped the prepared test paper into a DMSO solution of G1 (0.1 mol/L), and dried it in a vacuum drying oven. As shown in Figure 8, when Hg2+ aqueous solution was added to the prepared test strip, the obvious color change of the test strip was clearly observed, with strong red fluorescence being observed under the UV lamp. Therefore, the prepared test strip was able to quickly and efficiently detect Hg2+ in the aqueous solution.
FIGURE 8: Photographs of G1 (0.1 M) on test strips (a) only G1, (b) after immersion into water solutions with Hg2+, (c) only G1 under the UV lamp, and (d) after immersion into water solutions with Hg2+ under a UV lamp at room temperature and irradiation under UV light at 365 nm.
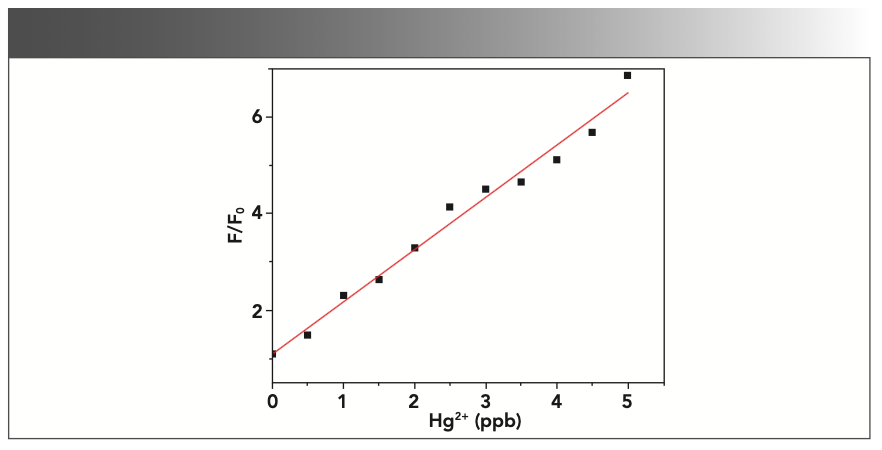
We further verified that G1 detects the Hg2+ content in the water environment. We added 0–5 ppb of Hg2+ to the G1 (0.1 mol/L) solution. When the concentration reached 2 ppm (the maximum allowable level of mercury ions in US Environmental Protection Agency drinking water), the fluorescence intensity of the sensor G1 increased by three times (Figure 9).
FIGURE 9: Linear fluorescence response of G1 (0.1 M) in water samples. The response (F) is normalized to the emission of the free sensor (F0).
Through analyzing the water samples, we verified the practicability of the sensor. Under the same conditions, we used the fluorescence method to determine the Hg2+ content in the tap water sample, and repeated the test three times. As shown in Table II, the Hg2+ concentration determined by the experiment was similar to the added amount concentration, and the recovery rate was approximately 100%. The relative standard deviation (RSD) was less than 3.90%, indicating that the sensor G1 was accurate and feasible to measure the mercury content in environmental samples.

Conclusion
We designed and synthesized a convenient, fast and efficient sensor G1, which can selectively recognize Hg2+ in a wide pH range with dual-channel. The detection limit of the sensor G1 for Hg2+ fluorescence response was 6.09 × 10⁻⁷ M. By successively adding Hg2+ and EDTA, the fluorescence pro- cess can be reversed, and the switching process can be repeated many times with almost no fluorescence loss. The mechanism of G1 recognition was discussed by means of 1H NMR, and it was believed that the reaction mechanism between G1 and Hg2+ was because of the ring opening of the spironolac- tone ring of rhodamine. In addition, G1-based test strips were prepared, which could be used as colorimetric and fluorescence measurement tools for the rapid detection of Hg2+. The qualitative determination of mercury ions in tap water has been tested successfully, and the feasibility of G1 in practical application has been verified. We believe that G1 has potential application potential as a Hg2+ dual-channel chemical sensor.
Conflicts of Interest
There are no conflicts to declare.
Acknowledgments
We gratefully acknowledge the support of the National Nature Science Foundation of China (No. 21467012).
References
(1) Y. Li, J.N. Xiong, S. Li, X.J. Wen, Y.C.L.T. Yu, X. Xiong, et al, Spectrosc. 234, 118277–118286 (2020).
(2) L. Luo, T. Song, H. Wang, Q. Yuan, and S. Zhou, Spectrochim. Acta. A Mol. Biomol. Spectrosc. 193, 95–101 (2018).
(3) B. Babamiri, A. Salimi, and R. Hallaj, Biosens. Bioelectron. 102, 328–335 (2018).
(4) A.R.N.I. Onyido and E. Buncel, Biomolecule. Chem. Rev. 104, 5911– 5930 (2004).
(5) S.T.M. Fujiki, Water Sci. Technol. 25, 133–140 (1992).
(6) H.H. Harris, Science 301, 1203 (2003).
(7) J. Zhu, Z.J. Zhao, J.J. Li, and J.W. Zhao, Spectrochim. Acta. A Mol. Biomol. Spectrosc. 177, 140–146 (2017).
(8) R. Singh, S.K. Rai, M.K. Tiwari, A. Mishra, A.K. Tewari, P.C. Mishra, and R.K. Singh, Chem. Phys. Lett. 676, 39–45 (2017).
(9) L. Cui, J. Wu, M. Li, and H. Ju, Electrochem. Commun. 59, 77–80 (2015).
(10) R. Beauvais-Fluck, F. Gimbert, O. Mehault, and C. Cosio, J. Hazard Mater. 338, 140–147 (2017).
(11) H. Chen, W. Lin, and L. Yuan, Org. Biomol. Chem. 11, 1938–1941 (2013).
(12) Z. Sun, M. Yang, Y. Ma, and L. Li, Crystal Growth & Design 17, 4326–4335 (2017).
(13) Office of Water, EPA Fact Sheet (U.S. Environmental Protection Agency, Washington, D.C., EPA Report 823/F-01/011, 2001).
(14) W.F. Grant, Mutat. Res. 99, 273–291 (1982).
(15) B. Zhang and L.H. Guo, Biosens. Bioelectron. 37, 112–115 (2012).
(16) S.K. Patil and D. Das, Spectrochim. Acta A Mol. Biomol. Spectrosc. 210, 44–51 (2019).
(17) E. Bozkurt and H.I. Gul, Sens. Actuators B Chem. 255, 814–825 (2018).
(18) W. Huang, D. Wu, G. Wu, and Z. Wang, Dalton Trans 41, 2620–2625 (2012).
(19) Q. Lin, X.-M. Jiang, X.-Q. Ma, J. Liu, H. Yao, Y.-M. Zhang, and T.-B. Wei, Sens. Actuators B Chem. 272, 139–145 (2018).
(20) X.-M. Jiang, X.-J. Huang, S.-S. Song, X.-Q. Ma, Y.-M. Zhang, H. Yao, et al, Polym. Chem. 9, 4625–4630 (2018).
(21) Q. Lin, X.-W. Guan, Y.-M. Zhang, J. Wang, Y.-Q. Fan, H. Yao, and T.-B. Wei, ACS Sustainable Chem. Eng. 7, 14775–14784 (2019).
(22) J.-P. Hu, J.-X. He, H. Fang, H.-H. Yang, Q. Zhang, Q. Lin, H. Yao, Y.-M. Zhang, T.-B. Wei and W.-J. Qu, New J. Chem. 44, 13157–13162 (2020).
(23) D. Singhal, N. Gupta, and A.K. Singh, RSC Advances 5, 65731–65738 (2015).
(24) S. Jing, C. Zheng, S. Pu, C. Fan, and G. Liu, Dyes Pigm. 107, 38–44 (2014).
(25) I.J. Chang, K.S. Hwang, and S.K. Chang, Dyes Pigm. 137, 69–74 (2017).
(26) S.W.F. Song, S. Watanabe, P.E. Floreancig, and K. Koide, J. Am. Chem. Soc. 130, 16460–16461 (2008).
(27) Q.Q. Rui, Y. Zhou, Y. Fang, and C. Yao, Spectrochim. Acta. A Mol. Bio- mol. Spectrosc. 159, 209–218 (2016).
(28) S. Gupta and M.D. Milton, New J. Chem. 42, 2838–2849 (2018).
(29) M. Wang, J. Wen, Z. Qin, and H. Wang, Dyes Pigm. 120, 208–212 (2015).
(30) S. Angupillai, J.-Y. Hwang, J.-Y. Lee, B.A. Rao, and Y.-A. Son, Sens. Actuators B Chem. 214, 101–110 (2015).
(31) R.S.K. Daware, R.S. Kalubarme, M. Kasture, A. Pandey, C. Terashima, and S.W. Gosavi, Sens. Actuators B Chem. 265, 547–555 (2018).
(32) A.S. Rao, D. Kim, T. Wang, K.-H. Kim, S. Hwang, and K.H. Ahn, Org. Lett. 14, 2598–2601 (2012).
(33) Y. Fang, Y. Zhou, J.-Y. Li, Q.-Q. Rui, and C. Yao, Sens. Actuators B Chem. 215, 350–359 (2015).
(34) K. Song, J. Mo, and C. Lu, Spectrochim. Acta A Mol Biomol. Spectrosc. 179, 125–131 (2017).
(35) J.-H. Hu, Y. Sun, J. Qi, P.-X. Pei, Q. Lin, and Y.-M. Zhang, RSC Advances 6, 100401–100406 (2016).
(36) J.-H. Hu, J.-B. Li, Y. Sun, P.-X. Pei, and J. Qi, RSC Advances 7, 29697– 29701 (2017).
(37) Z.-Y. Yin, J.-H. Hu, K. Gui, Q.-Q. Fu, Y. Yao, F.-L. Zhou, et al, J. Photochem. Photobiol. 396, 112542 (2020).
(38) Y. Sun, J.H. Hu, J. Qi, and J.B. Li, Spectrochim. Acta A Mol. Biomol. Spectrosc. 167, 101–105 (2016).
(39) P.X. Pei, J.H. Hu, Y. Chen, Y. Sun, and J. Qi, Spectrochim. Acta A Mol. Biomol. Spectrosc. 181, 131–136 (2017).
(40) J.H. Hu, Y. Sun, J. Qi, Q. Li, and T.B. Wei, Spectrochim. Acta A Mol. Biomol. Spectrosc. 175, 125–133 (2017).
(41) J.-H. Hu, C. Long, Q.-Q. Fu, P.-W. Ni, and Z.-Y. Yin, J. Photochem. Photobiol. 379, 105–111 (2019).
(42) Q.-Q. Fu, J.-H. Hu, Y. Yao, Z.-Y. Yin, K. Gui, N. Xu, et al, J. Photochem. Photobiol. 391, 126806 (2020).
(43) P.X. Pei, J.H. Hu, C. Long and P.W. Ni, Spectrochim. Acta A Mol. Biomol. Spectrosc. 198, 182–187 (2018).
(44) D. Wan, Y.-X. Li, and P. Zhu, Sens. Actuators B Chem. 221, 1271–1278 (2015).
(45) N. Melnychuk and A.S. Klymchenko, J. Am. Chem. Soc. 140, 10856–10865 (2018).
(46) B. Liu and F. Li, Appl. Math. Lett. 59, 94–100 (2016).
(47) L. Feng, J. Sha, Y. He, S. Chen, B. Liu, H. Zhang, and C. Lu, Microporous Mesoporous Mater. 208, 113–119 (2015).
(48) J. Jeong, B.A. Rao, and Y.-A. Son, Sens. Actuators B Chem. 220, 1254–1265 (2015).
(49) P.-X. Pei, J.-H. Hu, P.-W. Ni, C. Long, J.-X. Su, and Y. Sun, RSC Adv. 7, 46832–46838 (2017).
(50) R.G. Brereton, Analyst 112, 116–121 (1987).
Kai Gui, Ying Yao, Hui-Xin Liu, Xu-Mei Fu, and Jing-Han Hu are with the College of Chemical and Biological Engineering at Lanzhou Jiaotong University, in Lanzhou, China. Direct correspondence to Jing-Han Hu at 435832314@qq.com●

New Study Reveals Insights into Phenol’s Behavior in Ice
April 16th 2025A new study published in Spectrochimica Acta Part A by Dominik Heger and colleagues at Masaryk University reveals that phenol's photophysical properties change significantly when frozen, potentially enabling its breakdown by sunlight in icy environments.
Tracking Molecular Transport in Chromatographic Particles with Single-Molecule Fluorescence Imaging
May 18th 2012An interview with Justin Cooper, winner of a 2011 FACSS Innovation Award. Part of a new podcast series presented in collaboration with the Federation of Analytical Chemistry and Spectroscopy Societies (FACSS), in connection with SciX 2012 ? the Great Scientific Exchange, the North American conference (39th Annual) of FACSS.
New Fluorescence Model Enhances Aflatoxin Detection in Vegetable Oils
March 12th 2025A research team from Nanjing University of Finance and Economics has developed a new analytical model using fluorescence spectroscopy and neural networks to improve the detection of aflatoxin B1 (AFB1) in vegetable oils. The model effectively restores AFB1’s intrinsic fluorescence by accounting for absorption and scattering interferences from oil matrices, enhancing the accuracy and efficiency for food safety testing.
Can Fluorescence Spectroscopy Evaluate Soil Dissolved Organic Matter Dynamics?
February 20th 2025A new study published in Chemical Engineering Journal by researchers from Northeast Agricultural University in China reveals that biochar aging, influenced by environmental factors like UV exposure and wet-dry cycles, alters dissolved organic matter composition and affects its effectiveness in remediating cadmium-contaminated soil.
Geographical Traceability of Millet by Mid-Infrared Spectroscopy and Feature Extraction
February 13th 2025The study developed an effective mid-infrared spectroscopic identification model, combining principal component analysis (PCA) and support vector machine (SVM), to accurately determine the geographical origin of five types of millet with a recognition accuracy of up to 99.2% for the training set and 98.3% for the prediction set.