Analysis of Elements in Snack Foods: A Closer Look at Pepperoni, Rice Noodles, Frozen Dinners, and Pizza
A set of food samples with different percentage compositions of fats, proteins, and carbohydrates were digested in a single microwave digestion batch and analyzed to determine elemental concentrations using inductively coupled plasma–mass spectrometry (ICP-MS) and ICP-optical emission spectroscopy (OES) using the U.S. Food and Drug Administration (FDA) Elemental Analysis Manual (EAM) 4.7 (for ICP-MS) and FDA EAM 4.4 (for ICP-OES). Built-in software tools were used to streamline the analytical workflow, which is especially useful for new or less experienced users running these methods. Processed foods often contain high concentrations of some elements and trace amounts of others, so a wide analytical range is required. The ICP-MS method used to analyze the varied samples in this work was new. To ensure optimum setup of the ICP-MS method, semi-quantitative results were used to assess the solid content of the food digests before the sample preparation dilution was finalized. The same food samples were analyzed using ICP-MS and ICP-OES and the two methods were compared.
Agricultural food samples contain a wide variety of trace and minor elements, which can vary depending on several factors, including the geographical location, soil type, agricultural practices, and crop type. Along with the elements that have been monitored for decades, newly emerging contaminants may also be present in agricultural soil and other chemicals and additives that enter the food chain. Important emerging contaminants include the technology critical elements (TCEs), such as rare earth elements (REEs) that are used in advanced materials, renewable energy, batteries, consumer electronics, and life science applications. The mining, refining, use, and disposal of these elements may cause environmental contamination, which can ultimately lead to food contamination.
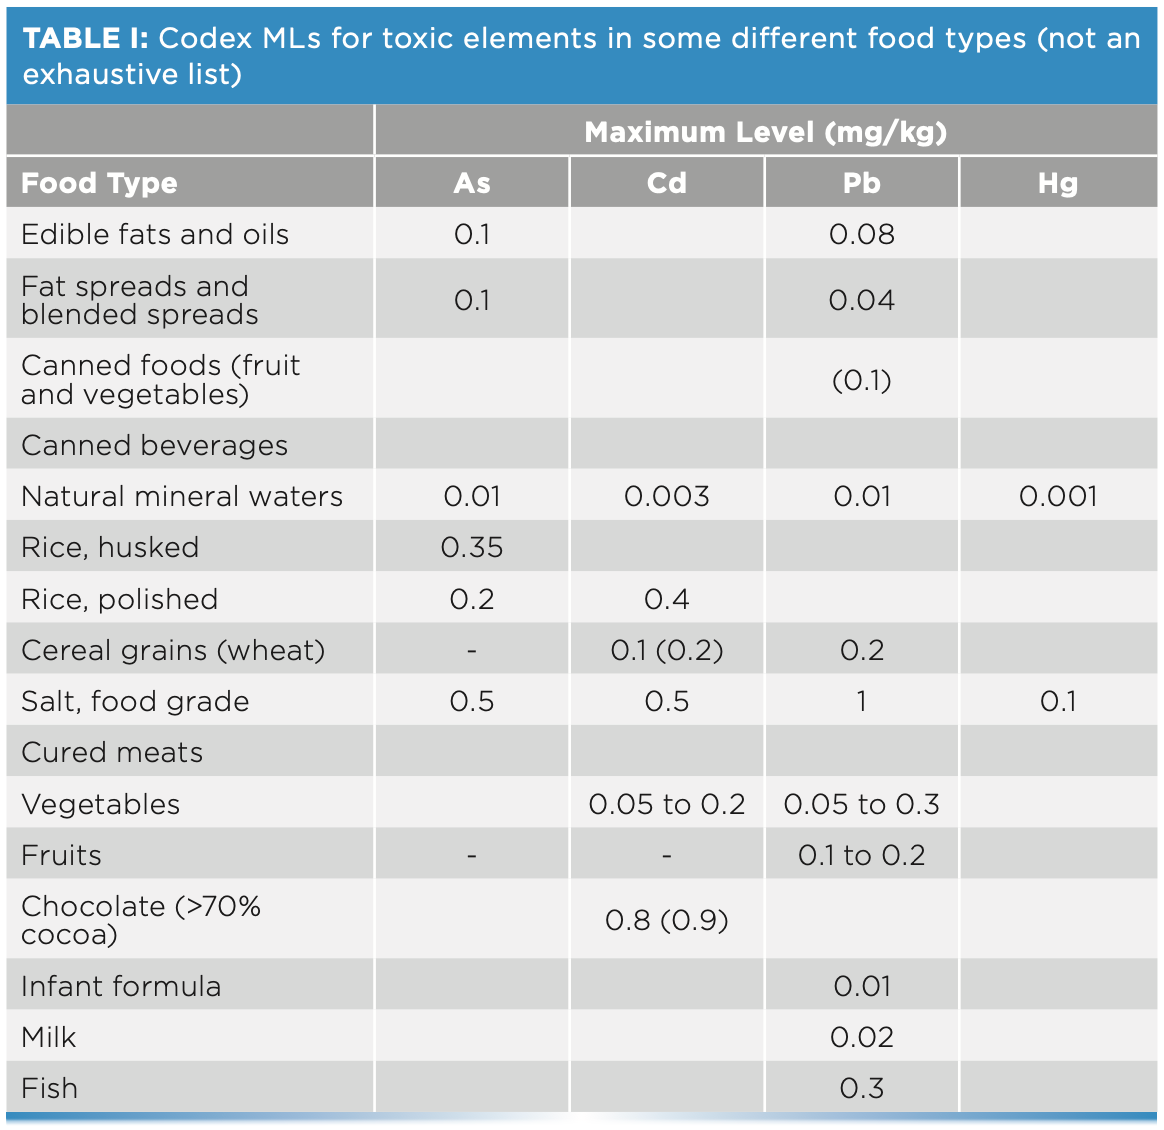
Snack foods contain multiple ingredients and are often highly processed, with each ingredient and process representing a potential source of contamination. Although cases are rare, especially if manufacturers adhere to Current Good Manufacturing Practices (cGMP) (1), processed foods can become contaminated at any point during the production, packaging, and distribution process. Typically, the chemicals that are controlled in foodstuffs include organic contaminants, such as pesticide residue, and inorganic contaminants. According to the general standard for food and feed outlined in the Codex Alimentarius (2) published by the Food and Agricultural Organization (FAO) and World Health Organization (WHO), the most concerning elements include arsenic (As), cadmium (Cd), lead (Pb), and mercury (Hg). The maximum levels (MLs) of each of these elements depend on the type of food, as shown in Table I. Codex MLs ensure food does not contain contaminants at levels which could threaten human health. Many countries base legislation on Codex standards and related texts.
To ensure foods are safe and comply with United States regulations and laws, the U.S. Food and Drug Administration (FDA) develops and publishes works that describe analytical methods that manufacturers or importers can use in their laboratories. Examples include the FDA Elemental Analysis Manual (EAM) 4.4 for inductively coupled plasma–optical emission spectroscopy (ICP-OES) and EAM 4.7 for ICP–mass spectrometry (MS) (3,4). Both ICP-OES and ICP-MS are well-established techniques, and because of their multielement and high sample throughput capabilities, both are widely used in the routine measurement of trace elements in a wide range of samples, including foods and beverages (5–11). EAM 4.4 and 4.7 outline how to determine multiple elements in food digests prepared using microwave-assisted acid decomposition. The methods also outline a series of quality control (QC) tests to ensure instrument performance and data accuracy.
To assist busy analysts who run the EAM methods using ICP-OES or ICP-MS, software tools can speed up method development, improve the usability of both techniques, and provide confidence in the results. Many laboratories that analyze unknown samples or handle a wide variety of samples use semi-quantitative analysis to gain a better understanding of the sample before developing the quantitative method. Knowing more about the samples is useful for all analysts, but software tools that reduce some of the uncertainty of using ICP techniques are especially useful for new users.
Acquiring a full ICP-MS or ICP-OES spectrum adds only a few seconds to the quantitative measurement, but the extra data collected can provide valuable additional information on the samples. As a technique, ICP-MS can acquire semi-quantitative results for as many as 78 elements in each sample, which provide a more complete overview of the sample composition and confirmation of the quantitative results. The additional information provides certainty and confidence in the results, preventing the need for remeasurements, potentially saving time and resources over the course of the analytical sequence.
Processed foods often contain high concentrations of calcium (Ca), iron (Fe), potassium (K), magnesium (Mg), sodium (Na), phosphorus (P), manganese (Mn), copper (Cu), and zinc (Zn), whereas trace elements such as As, chromium (Cr), Cd, Pb, nickel (Ni), molybdenum (Mo), selenium (Se), and Hg are required analytes in most regulated methods, so a wide analytical range is required.
Materials and Methods
Samples and Sample Preparation
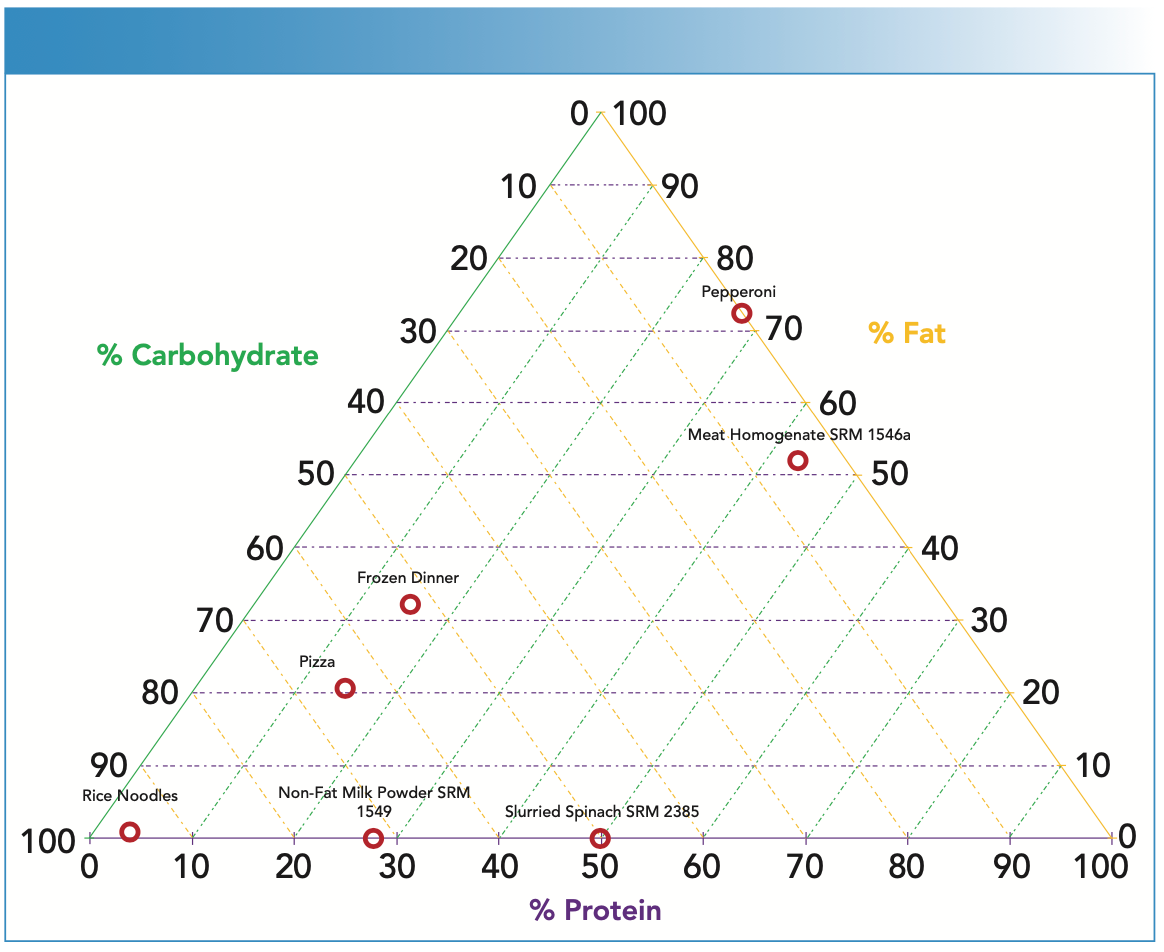
A set of food samples with different percentage compositions of fats, proteins, and carbohydrates were measured in this study, including pepperoni, rice noodles, frozen dinner, and frozen pizza bought from a supermarket in North Carolina (Figure 1).
FIGURE 1: Nutritional composition plot for foods and standard reference materials (SRM) analyzed in this study.
The food samples were digested as received, except the frozen pizza and frozen dinner, which were homogenized in a blender before sampling. The samples were prepared for analysis according to the digestion procedure outlined in the EAM method using a MARS 6 iWave closed-vessel microwave digestion system (CEM Corporation). After accurately weighing the samples (approximately 0.5 g of food or SRM) into 75 mL PFA MARSXpress vessel liners, 8 mL of nitric acid (HNO3) and 1 mL of hydrogen peroxide (H2O2) were added to the vessel liners. Duplicates of the samples, standard reference materials (SRMs), and spiked samples were then digested in a single batch using the heating program shown in Table II. Each digestion batch can accommodate up to 40 varied food sample matrices, with a single program being used for all sample types. Finally, 0.5 mL concentrated hydrochloric acid (HCl) was added to the digests, followed by deionized water (DIW) to a final weight of 100 g.

Analytical Sequence
Calibration standards for both ICP-MS and ICP-OES methods were prepared in 1% HNO3 and 0.5% HCl using standard solutions (environmental calibration standard, multielement calibration standard-1, and 1000 μg/mL single calibration standard for Hg, Agilent Technologies). For ICP-MS analysis, most elements were calibrated from 0.1 to 25 ppb, and Cu, Zn, and Mn were calibrated up to 250 ppb, whereas Hg was calibrated from 0.01 to 2.5 ppb. For ICP-OES analysis, standards were prepared from 10 ppb to 10 ppm for all elements, with a 100-ppm standard for Ca, K, Mg, Na, and P.
For ICP-MS analysis, an internal standard (ISTD) solution containing 2 ppm scandium (Sc), germanium (Ge), rhodium (Rh), indium (In), terbium (Tb), lutetium (Lu), and bismuth (Bi) was prepared in a solution consisting of 1% HNO3, 0.5% HCl, and 10% isopropanol (IPA). The IPA was added to ensure a consistent level of carbon (C) in the digests and calibration standards. This approach alleviated the concern of signal variability that could occur for some poorly ionized analytes (such as As and Se) because of ionization enhancement in the presence of C. The ISTD solution was added automatically to the sample and standard solution at a ratio of approximately 1:16 using a T-connector fitted to the sample uptake line that directly lead to the nebulizer.
The ICP-OES ISTD consisted of a 2 mg/L solution of yttrium (Y) in 2% HNO3, which was added in-line at a dilution of ~1:8. The sample peristaltic pump tubing was white-white (1.03 mm i.d.), and the internal standard was orange-green (0.38 mm i.d.). The standard sample introduction system was used, consisting of a glass-concentric nebulizer and a double-pass, glass cyclonic spray chamber. An independent check solution (ICS) and standard blank were analyzed after calibration, and a check standard and standard blank were analyzed every 10 samples thereafter.
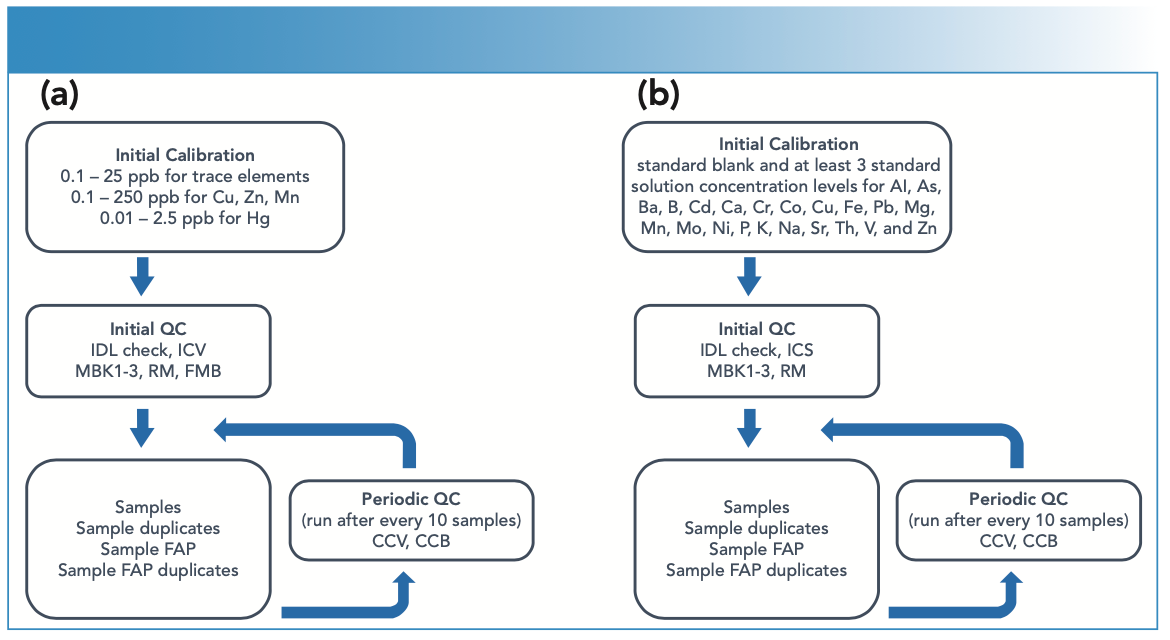
The analytical sequences of calibration standards, samples, and QC solutions for both techniques are shown in Figure 2. Each EAM method specified a minimum number of QC samples to be analyzed with each batch of sample. These QC samples include reference materials (RM), fortified analytical portions (FAP), fortified analytical solutions (FAS), method blanks (MBK), fortified method blanks (FMB), and the number of replicates to be included in each analytical run.
FIGURE 2: Analytical sequence for (a) ICP-MS and (b) ICP-OES.
Instrumentation
The accuracy of the semi-quantitative analysis of complex sample matrices by ICP-MS is vastly improved if all elements are acquired using helium collision cell mode to control polyatomic interferences. Helium collision cell mode is widely used to remove polyatomic interferences in multielement quantitative analysis. Because helium is a nonreactive gas, no new interferences are formed in the cell, whereas common matrix-based polyatomic interferences are removed using kinetic energy discrimination (KED). This makes helium mode ideally suited to the quantitative and semi-quantitative analysis of samples with complex and variable major element compositions (12). In this study, a single quadrupole ICP-MS instrument (7850, Agilent Technologies) fitted with an octopole-based collision–reaction cell (Octopole Reaction System CRC) and Ultra High Matrix Introduction (UHMI) aerosol dilution technology was used.
Although polyatomic ions were successfully removed using helium cell mode, some other spectral overlaps required a different approach. The REEs have relatively low second ionization potentials, so they can form a small percentage of doubly charged ions (M2+) in the plasma along with the normal single-charged (M+) ions. Doubly charged ions appear at half their true mass in the ICP-MS mass spectrum because the quadrupole mass filter separates ions based on their mass-to-charge ratio (m/z). Therefore, REEs, such as neodymium (Nd), samarium (Sm), gadolinium (Gd), and dysprosium (Dy), which have isotopes at masses 150, 156, and 160, will form M2+ ions at m/z 75, 78, and 80, respectively. If the REEs are present at a high enough concentration in a sample, these REE2+ ions can interfere with the measurement of the normal analytical isotopes of As and Se. The EAM 4.7 ICP-MS method recommends that analysts measure 146Nd, 147Sm, 155Gd, and 163Dy to monitor the potential overlaps on 75As and 82Se. When analyzing unknown or new sample types, the REE content can be quickly and simply assessed using the IntelliQuant semi-quantitative analysis function of ICP-MS MassHunter software (version 4.6 and later). If a high concentration of REEs is expected or identified following the semi-quantitative analysis, a method wizard within the software can set up an automated function to correct for the contribution that REE2+ ions make to the signals measured for As and Se.
In this study, the semi-quantitative data were calculated from a full mass quick scan spectrum acquired as part of the quantitative analysis, with only two seconds of additional measurement time. The semi-quantitative results provide valuable information about the elemental content of food samples, including:
- The full elemental composition of each sample. The results can be displayed in a table of concentrations or as a periodic table heat map, enabling a quick overview and easy comparison of each sample’s composition (Figure 4).
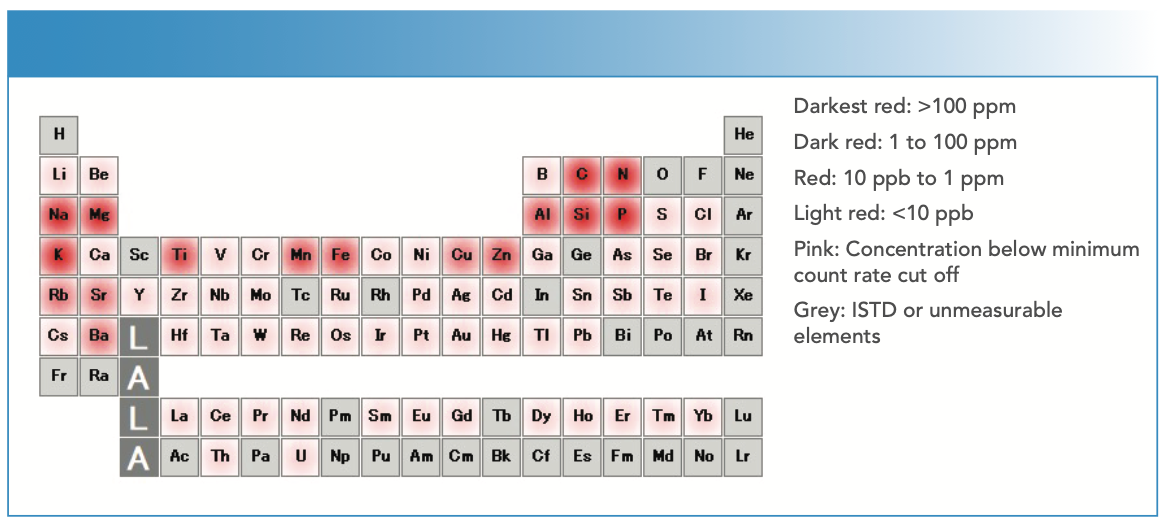
- Identifying the presence of unexpected major or trace elements not included in the quantitative analysis and identifying contamination during sample preparation. For example, the relatively high concentration of Ti identified in the powdered doughnut from the periodic table heat map shown in Figure 4 might be unexpected. It was likely because of TiO2 in the white frosting, but the full mass IntelliQuant spectrum can be used to unequivocally confirm the element from its isotope pattern.
- An estimation of the total matrix solids (TMS) level for each sample run, or for a typical sample of a new sample batch.
- The TMS function uses the semi-quantitative data to calculate the approximate solids levels of a sample.
FIGURE 4: Periodic table heat map view of ICP-MS semiquantitative data acquired for powdered doughnut, showing a high concentration of titanium.
The calculation excludes gas elements, such as argon (Ar), oxygen (O), and nitrogen (N), together with C, P, sulfur (S), and the halides, ensuring a more accurate result. To simplify method setup and ensure the best possible accuracy for uncalibrated elements, the semi-quantitative data (and TMS calculation) uses a mass response profile generated from the quantitative calibration standards. The TMS function is a great diagnostic tool in identifying possible causes of internal standard suppression. It is especially useful when dealing with unknown and potentially difficult food sample matrices by helping the analyst to decide if a sample needs to be diluted or a higher HMI setting is needed. The measured TMS levels for the samples analyzed in this study are shown in Table III.

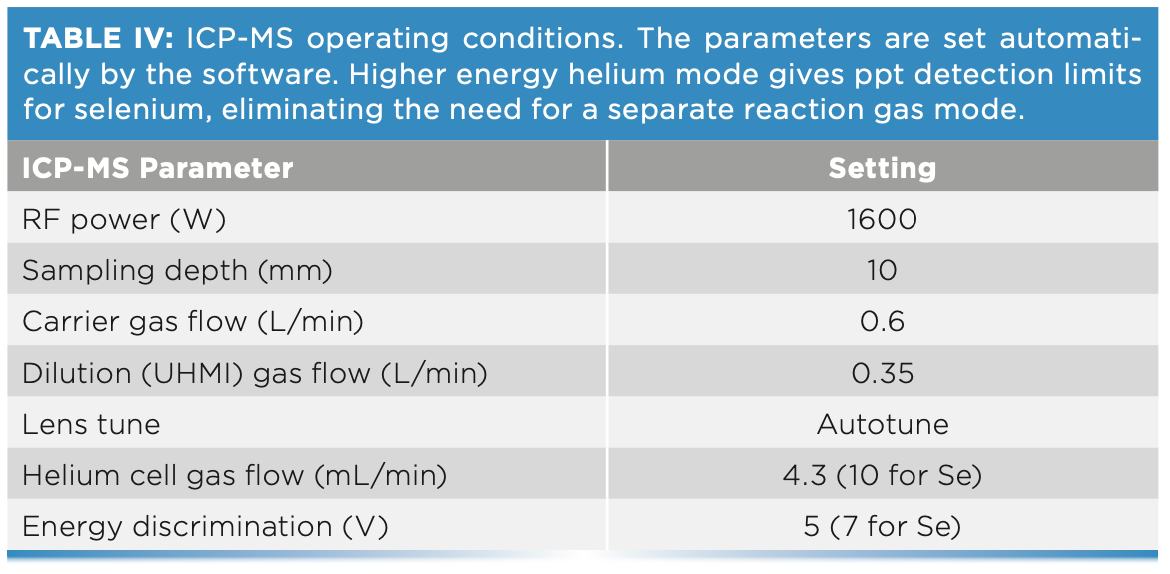
Based on the TMS levels in these food sample types (Table III), the plasma mode of “HMI-4” was selected. HMI applies an additional flow of Ar gas to dilute the sample aerosol by a factor of four times. This “aerosol” dilution method saves the analyst from having to manually dilute samples, which saves time and reduces the chance of introducing errors or contaminants. When HMI is used, all related settings are auto-tuned for the matrix levels of the target sample types. For ease of setup, other instrument operating settings were optimized automatically using the auto-tune function of the instrument control software. Also contributing to the ease of method setup, all quantitative analytes and the quick scan measurement were acquired in helium mode. Instrument operating conditions are listed in Table IV.
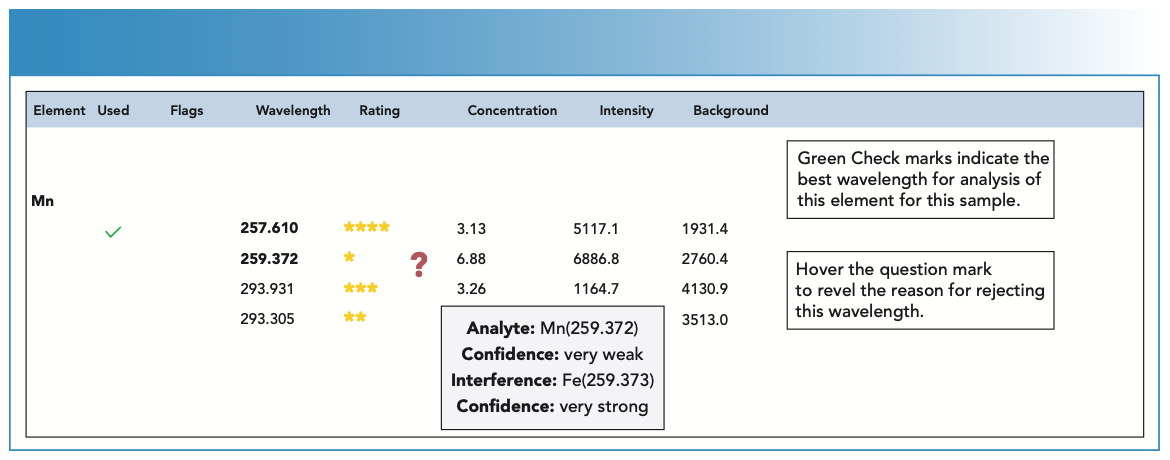
For ICP-OES analysis, semi-quantitative data was acquired using a function of the Agilent ICP Expert software known as IntelliQuant Screening. The software automatically makes wavelength recom- mendations for analytes based on the elemental composition of a sample and any potential spectral interferences that may arise from the sample matrix. An example for a beef jerky sample is given in Figure 3. The data shows a Fe interference on Mn 259.372 nm, accounting for the high concentration of Mn measured using the 259.372 nm line. In the software (Figure 3), Mn 257.610 nm was given the highest confidence ranking (five stars) so was selected for the quantitative method. Having access to this type of wavelength information makes it easier for the analyst to have confidence in the results that they report.
FIGURE 3: Information for manganese (Mn) in a beef jerky sample. The ICP- OES IntelliQuant data automatically produces a star ranking system for wavelengths. This information enables the analyst to easily identify the best wavelengths and what wavelengths to avoid.
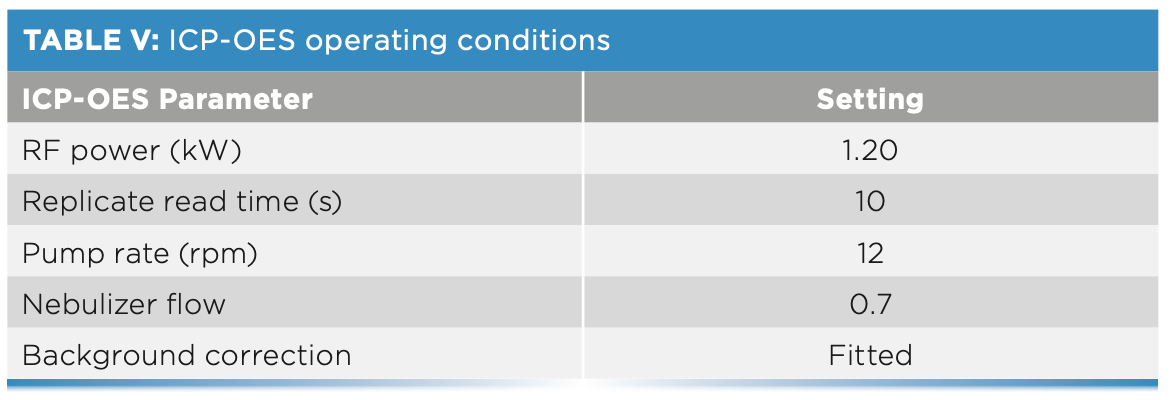
The ICP-OES sample analysis was conducted per FDA EAM-4.4 for 22 elements using an Agilent 5900 ICP-OES operating in synchronous vertical dual-view (SVDV) mode. SVDV mode allows for both the axial and radial light to reach the detector at the same time. Eliminating the need for separate plasma views shortens analysis times while maintaining low limits of detection (LOD) from axial view and the greater linear range for major cation elements from the radial view. The ICP-OES plasma parameters are shown in Table V.
Results
Quality Control Criteria in EAM 4.4 and 4.7
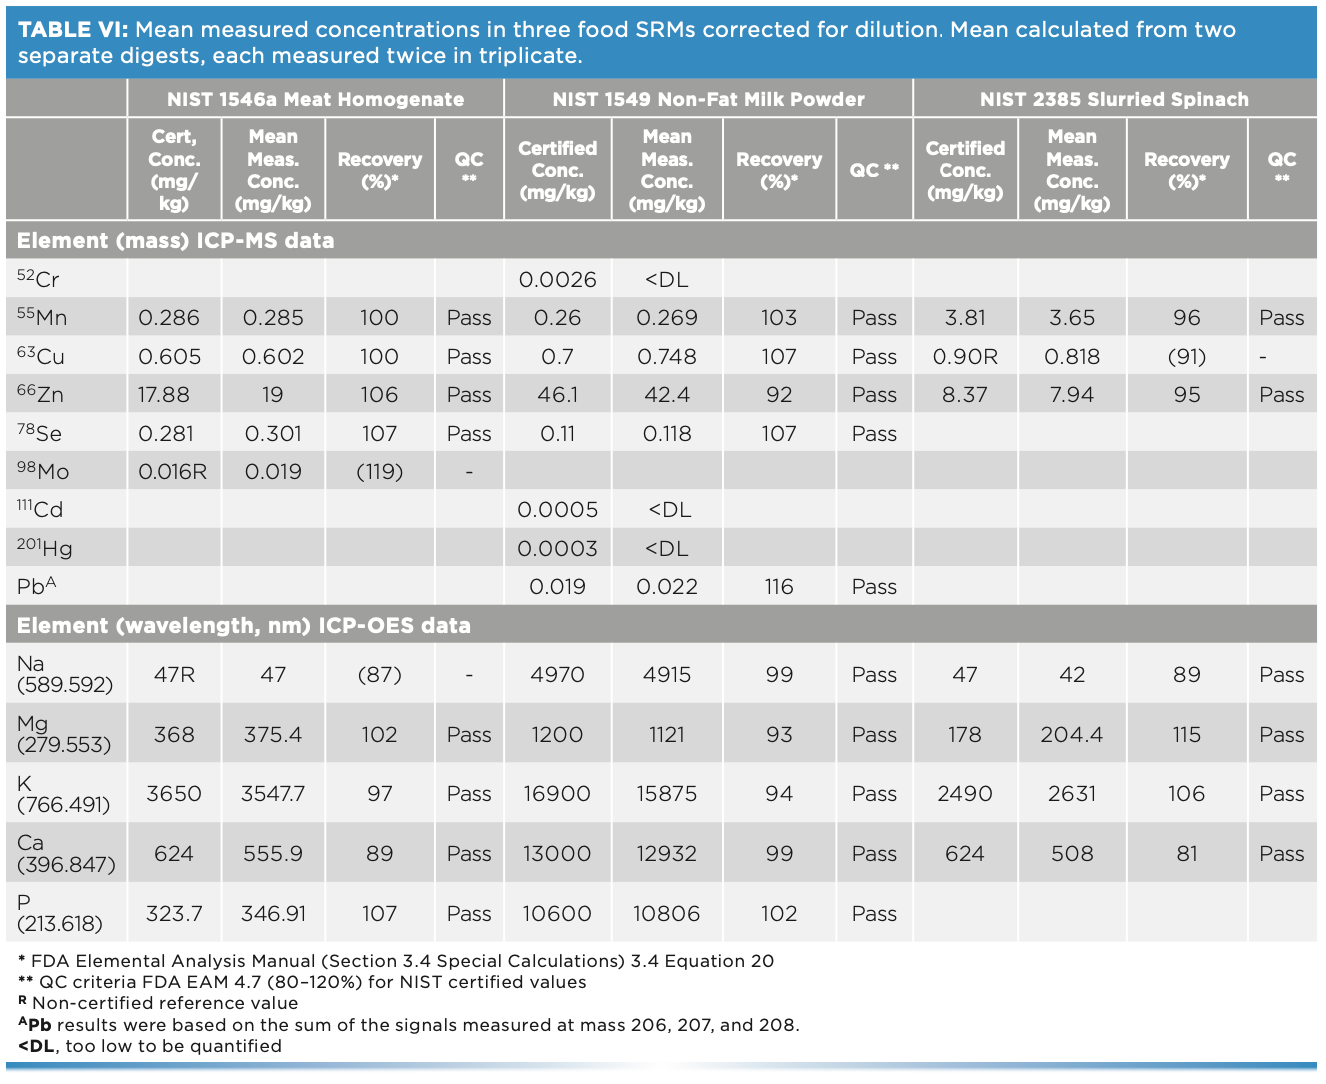
To verify the sample digestion process, two sets of the three NIST SRMs were analyzed in duplicate using ICP-MS and ICP-OES. As shown in Table VI, the mean concentrations were in agreement with the certified concentrations, meeting the QC criteria requirements of the FDA EAM method of 80–120%. Because not all SRMs are certified for all analytes, blank cells indicate the absence of a certified or reference value. There are no certified values for As, Ni, and thallium (Tl), which are listed in EAM 4.7.
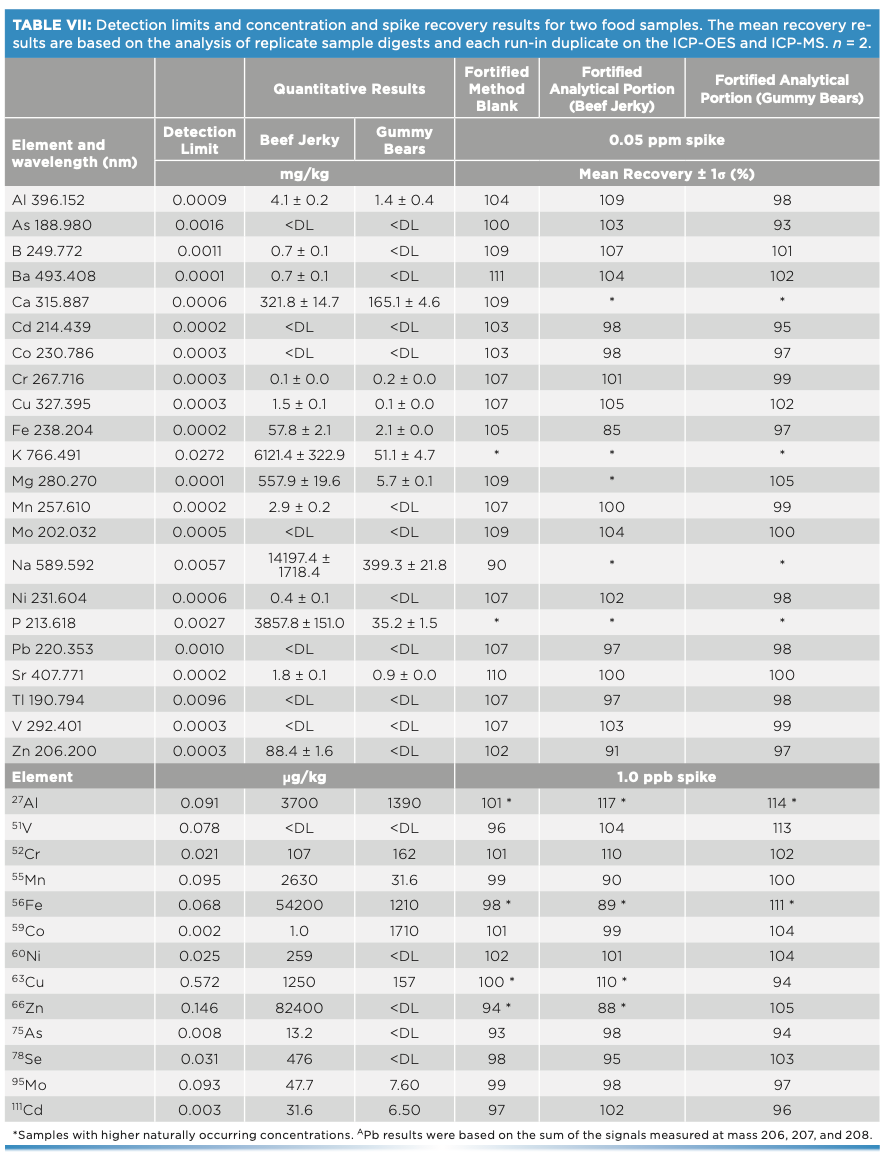
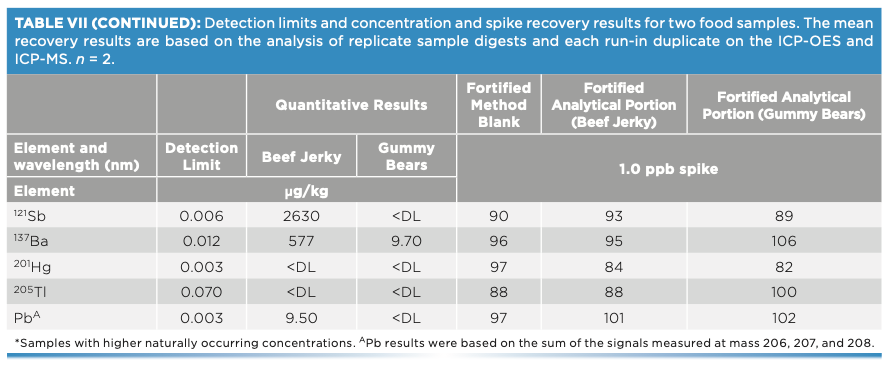
The detection limits in Table VII were calculated from three times the standard deviation of 10 measurements of the calibration blank. Per the EAM methods, minimum QC requirements were included in each analytical run. For ICP-OES, all FAP samples were spiked at 0.05 ppm, and the recoveries are shown in Table VII. For samples with higher naturally occurring concentrations, the 0.05 ppm spike results were not reported. For ICP-MS, the same samples were spiked with all elements at 1 or 50 ppb and measured using ICP-MS. For samples that had naturally occurring elemental concentrations below 5 ppb, a 1 ppb spike is reported. For samples with higher naturally occurring concentrations, the 50 ppb spike results are reported. The recoveries for all elements in the fortified food samples were within the EAM method QC criteria of ±20%, as shown in Table VII.
Quantitative Results for Food Samples
Dilution corrected quantitative results obtained using ICP-MS are given in Table VII (beef jerky and gummy bears), and Table VIII shows the dilution corrected quantitative results for frozen dinners, pepperoni, pizza, and rice noodles. In addition to the 12 elements specified in EAM 4.7, data is provided for aluminum (Al), vanadium (V), Fe, cobalt (Co), antimony (Sb), barium (Ba), thorium (Th), and uranium (U). Per the Codex elements of concern, the concentrations for As (4.4 to 89.2 μg/kg), Cd (6.5 to 39.4 μg/kg), Pb (6 to 9.5 μg/kg), and Hg (below detection limit) in all snack foods were below any of the Codex MLs (Table I). The high concentration of Al in the pizza sample, which is likely because of an Al food additive, agrees with the literature values (13).
Periodic Table View of Elements in Food Samples
ICP-MS and ICP-OES methods can both be set up to acquire and process semi-quantitative data in addition to quantitative data acquisition. The ICP-MS quick scan function used in this study acquires full mass-spectrum data for every sample with only 2 s of additional measurement time. Because the data is acquired in helium collision cell mode, analytes are free from common polyatomic ion overlaps, ensuring the quality of the results. For ICP-OES, the detector and comprehensive database of wavelengths allows the software to provide real-time sample insights based on each individual spectrum. In both cases, the results can be displayed in a table or as a color-coded periodic table heat map, showing the approximate concentration of all elements present in a sample.
Figure 4 shows an ICP-MS IntelliQuant heat map for powdered doughnuts. The color intensity indicates the concentration ranges of elements in the sample, with a darker color indicating a higher concentration of that element. The semi-quantitative data provides a complete picture of the elements present in the sample, as data can be reported for elements not included in the calibration standards, which is demonstrated by the high concentration of titanium (Ti), labeled as food additive “TiO ” on the packaging. The semi-quantitative result for Ti in the doughnut samples was ~90 ppm.
Figure 5 shows an ICP-OES generated periodic table heat map with estimated concentrations of elements in a beef jerky sample. The color-coding used to represent the concentration range for the elements is user adjustable.
Conclusions
Like many analytical laboratories, food testing facilities are under pressure to increase productivity while ensuring data quality, compliance, and audit controls, which can be challenging for staff who may be expected to analyze more samples each day or operate instrumentation that is not familiar to them. It is useful if the instrumentation they use is as intuitive as possible and any reference or regulated methods can be implemented quickly, especially by new users.
In this article, we have shown how software tools available for ICP-MS and ICP-OES can help analysts to simplify method setup and reduce the potential for errors. Software functions, such as IntelliQuant, can also provide valuable information on sample composition and additional analytes beyond the regulated method requirements. These capabilities are demonstrated for the analysis of various foods that were prepared and analyzed in accordance with the U.S. FDA EAM methods 4.4 and 4.7. None of the snack foods were found to contain potentially harmful contaminant elements above Codex maximum levels of concern.
References
(1) US Food and Drug Administration, Current Good Manufacturing Practices (CGMPs) for Food and Dietary Supplements (FDA, Rockville, MD, 2021). https://www.fda.gov/food/guidance-regulation-food-and-dietary-supplements/current-good-manufacturing-practices-cgmps-food- and-dietary-supplements.
(2) Codex Alimentarius International Food Standards, “General Standard for Contaminants and Toxins in Food and Feed, CSX 193-1995,” amended 2019, pp. 45–54 (accessed September 2021). www.fao.org/fao-who-codex- alimentarius/sh-proxy/en/?lnk=1&u rl=https%253A%252F%252Fworksp ace.fao.org%252Fsites%252Fcodex %252FStandards%252FCXS%2B193- 1995%252FCXS_193e.pdf
(3) W.R. Mindak and S.P. Dolan, U.S. Food and Drug Administration Elemental Analysis Manual, 4.4 Inductively Coupled Plasma-Atomic Emission Spectrometric Determination of Elements in Food Using Microwave Assisted Digestion, Version 1.1 (FDA, Rockville, MD, 2010).
(4) P.J. Gray, W.R. Mindak, and J. Cheng, U.S. FDA Elemental Analysis Manual, 4.7 Inductively Coupled Plasma-Mass Spectrometric Determination of Arsenic, Cadmium, Chromium, Lead, Mercury, and Other Elements in Food Using Microwave Assisted Digestion, Version 1.2 (FDA, Rockville, MD, 2020).
(5) M. Patriarca et al, J. Anal. At. Spectrom. 36, 452–511 (2021).
(6) D. Link, P.J. Walter, and H. Kingston, Enviro. Sci. Tech. 32, 3628–3632 (1998).
(7) R.A. Nadkarni, Anal. Chem. 56, 2233–2237 (1984).
(8) S.P. Dolan and S.G. Capar, J. Food Compos. Anal. 15, 593–615 (2002).
(9) U.S. Food and Drug Administration, FDA Total Diet Study, March 2021. https://www.fda.gov/food/science-research-food/total-diet-study (accessed October 2021)
(10) S.A. Baker, D.K. Bradshaw, and N.J. Miller-Ihli, At. Spectrosc. 20, 167–173 (1999).
(11) P.J. Gray and W. Cunningham, J. AOAC Int. 102(2), 590–604 (2019).
(12) E. McCurdy and G. Woods, J. Anal. At. Spectrom. 19, 607–615 (2004).
(13) S.M. Saiyed and R.A. Yokel, J. Food Additives & Contaminants 22, 234–244 (2005).
Elaine Hasty, Macy Harris, and Leanne Anderson are with CEM Corporation. Jenny Nelson and Greg Gilleland are with Agilent Technologies. Direct correspondence to: jenny.nelson@agilent.com ●
