The C-O Bond, Part I: Introduction and the Infrared Spectroscopy of Alcohols
Spectroscopy
We now turn our attention to the C-O bond, how to detect its presence in a sample from an infrared (IR) spectrum, and a study of the functional groups that contain this bond. In this first installment on the topic, we study the spectra of alcohols and learn to distinguish primary, secondary, and tertiary alcohols from each other based on their infrared spectra.
The C-O bond is found in many functional groups and has a characteristic infrared signature. In this installment the spectroscopy of this bond is introduced, and we begin a discussion ofthe spectra of alcohols.
It has taken two years and ten columns, but we are done with the infrared spectra of hydrocarbons, at least for now. The unifying theme of those columns was the stretching and bending of the C-H bond. Going forward each large group of columns will have as their unifying theme the spectroscopy of a specific chemical bond. Starting with this column we will be discussing the infrared spectroscopy of the carbon-oxygen single bond, denoted C-O. After this series, there will be groups of columns on the carbonyl (C=O) functional group, and organic nitrogen-containing compounds. At six columns per annum this process may well take a few years. So stay tuned-there’s a lot more to learn, and I doubt I will ever run out of ideas for columns on the broad and fascinating field of infrared spectral interpretation.
Introduction to C-O Bonds
C-O bonds are polar because of the electronegativity difference between carbon and oxygen, and thus these bonds have a large dipole moment. Recall from a previous column (1) that infrared peak intensities are determined by Beer’s law as shown in equation 1:
A = εlc [1]
where A is the absorbance, ε is absorptivity, l is pathlength, and c is concentration.
Also recall (1) that the absorptivity in Beer’s law is determined by the square of the change in dipole moment with respect to change in bond length during a molecular vibration, as stated in equation 2:
ε = (dµ/dx)2 [2]
where dµ is the change in dipole moment during a vibration, and dx is the change in bond length during a vibration.
Like any other chemical bond, C-O bonds are capable of stretching and contracting as shown in Figure 1.

Figure 1: The stretching vibration of the C-O bond.
This vibration involves pushing and pulling a large dipole moment, hence it has a large value of dµ/dx and gives rise to intense peaks. In general, C-O stretching peaks are intense and normally fall between 1300 and 1000 cm-1 (going forward assume all peak positions are in cm-1 units). Because this wavenumber range is in the fingerprint region (2) there are often many peaks present between 1300 and 1000, but again the distinguishing feature of C-O stretches will be their intensity. If there are no big peaks between 1300 and 1000, there may be no C-O bonds present in a sample. If there are big peaks in this region, then there are probably C-O bonds present.
The next few column installments will be devoted to alcohols and ethers, two types of functional groups that contain C-O bonds. As we will see, the number and position of C-O stretches will help us identify these functional groups and distinguish between members of the same molecular class. This change in focus will not end our examination of this bond however; some other multibond functional groups such as esters and carboxylic acids also contain C-O bonds as we will see in future columns.
The Structure and Nomenclature of Alcohols
Alcohols are a well-known group of organic molecules that contain a C-O bond. The molecular structure of perhaps the most familiar alcohol, ethyl alcohol (or ethanol), is shown in Figure 2.

Figure 2: The molecular structure of ethyl alcohol.
Alcohols are defined as having a carbon atom with an -OH group attached to it (3). The -OH moiety is called a hydroxyl group and the carbon atom attached to it is called a hydroxyl carbon. You can remember this nomenclature by realizing that a hydroxyl group contains both hydrogen and oxygen.
There are several different alcohol types determined by what is attached to the hydroxyl carbon. Ethyl alcohol is an example of a primary alcohol, because it has one carbon attached to the hydroxyl carbon, in this case a methyl group. Conversely, secondary alcohols have two carbons attached to the hydroxyl carbon, and tertiary alcohols have three. Thus the designations primary, secondary, and tertiary count up the number of carbons attached to the hydroxyl carbon. Generic structures for these three alcohols are shown in Figure 3, where the R- denotes substituent atoms that are not hydrogen. Organic chemists sometimes use the ° (degree) symbol as shorthand for denoting these alcohols. As illustrated in Figure 3 a primary alcohol is designated as 1°, a secondary alcohol as 2°, and a tertiary alcohol as 3°.

Figure 3: The generic structures of primary, secondary, and tertiary alcohols.
If an -OH is attached to an aromatic ring, the structure can be called an aromatic alcohol but is often called a phenol. The simplest aromatic alcohol is phenol, after which the family is named; it consists of a hydroxyl group attached to a benzene ring as shown in Figure 4.
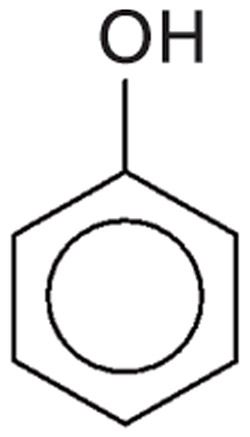
Figure 4: The chemical structure of phenol, the namesake molecule of aromatic alcohols.
The types of alcohols we will discuss in this and future columns will be primary, secondary, tertiary, and phenols.
The Infrared Spectroscopy of Alcohols
In my first column (1) I discussed how infrared peak widths are determined by the strength of the intermolecular interactions in a sample. As an example I used the spectrum of liquid water, which has peaks that are hundreds of wavenumbers wide. The broad peaks in water’s spectrum result from hydrogen bonding, a strong type of intermolecular interaction. I stated in that column that “most molecules containing the O-H functional group engage in hydrogen bonding and have broad peaks.”
As you can see in Figures 3 and 4, all alcohols have an O-H group. Just as is the case with water, the hydroxyl group in alcohols is polar, the oxygen contains a partial positive charge, the hydrogen contains a partial negative charge, and so alcohol molecules hydrogen bond to each other. The hydrogen bonding of alcohol molecules is illustrated in Figure 5.
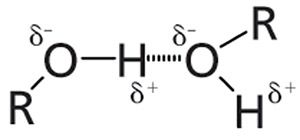
Figure 5: The hydrogen bonding of alcohol molecules. The δ+ symbol represents a partial positive charge, and the δ- symbol represents a partial negative charge.
Because of hydrogen bonding, any peak resulting from a vibration of the alcohol -OH group will be unusually broad. We will take advantage of this property to distinguish alcohol peaks from those of other functional groups.
As shown in Figures 3 and 4, the hydroxyl carbon of alcohols has at least one other carbon atom attached to it (methanol is an exception). So in reality the “C-O stretch” of alcohols involves the hydroxyl carbon and one or more carbons attached to it, giving rise to what will be called asymmetric and symmetric C-C-O stretches, which are illustrated in Figure 6.

Figure 6: The asymmetric (left) and symmetric (right) C-C-O stretches of an alcohol.
Note in Figure 6 that the asymmetric stretch involves the leftmost carbon atom moving toward and the oxygen atom moving away from the hydroxyl carbon. Whereas in the symmetric stretch the leftmost carbon and the oxygen atom are both moving away from the hydroxyl carbon.
The vibrations shown in Figure 6 are similar to the asymmetric and symmetric stretches of carbon dioxide discussed previously (1). Recall that the symmetric stretch of CO2 had a dµ/dx value of zero and thus zero peak intensity, whereas the asymmetric stretch had a large value of dµ/dx and hence an intense peak. Alcohols exhibit similar behavior to that of carbon dioxide. In general the C-C-O asymmetric stretching intensity in alcohols is greater than the C-C-O symmetric stretching intensity, because of dμ/dx differences. However, these peaks are intense on an absolute scale because they both have large values of dµ/dx.
Primary Alcohols
The infrared spectrum of a primary alcohol, ethyl alcohol, is shown in Figure 7. The assignment of the relevant peaks is shown in Table I.
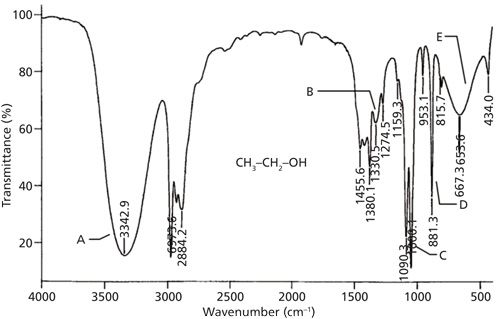
Figure 7: The infrared spectrum of ethyl alcohol obtained using the capillary thin film method.
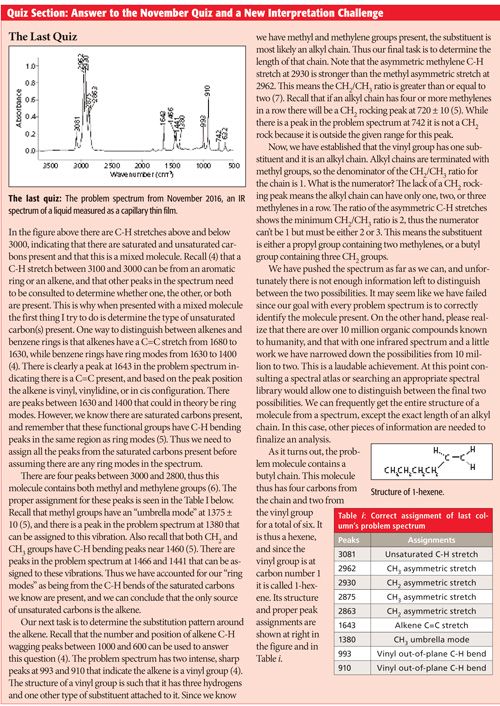
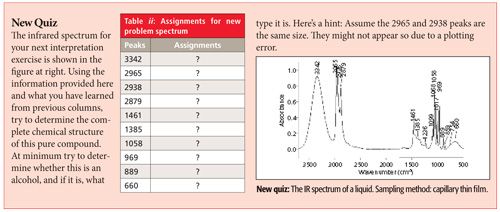
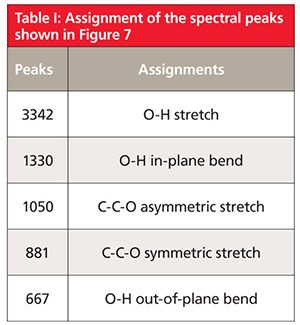
Because the hydroxyl group in alcohols engages in hydrogen bonding and hence will have broad peaks, it is easy to assign the peaks labeled A and E in Figure 7 as being from the -OH moiety. The broad peak at 3342 is from the O-H stretch of the hydroxyl group. All alcohols display this peak at 3350 ± 50. This peak is intense because the O-H bond has a large dipole moment, and thus dµ/dx for the vibration is large. We saw previously that liquid water also has a broad, intense O-H stretch in this same region (1). We will see in future installments that carboxylic acids and other functional groups containing O-H bonds also have broad O-H stretches around 3400. Thus this peak can be diagnostic for the presence of an O-H bond but it is not diagnostic for alcohols. We will need to consult other peaks in the spectra of alcohols to distinguish them from other O-H-containing molecules.
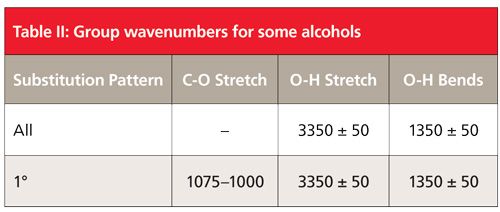
The second broad peak in Figure 7 labeled E at 667 is the out-of-plane O-H bend, or O-H wag; imagine the hydrogen atom bending above and below the plane of the page. For all alcohols this peak falls at 650 ± 50. A similar vibration, the O-H in-plane bend, involves the hydrogen bending up and down in the plane of the molecule. Its resultant peak is labeled B and falls at 1330 in Figure 7. Note it is narrower than the O-H stretch and wag but broader than the peaks around it, which is how it can be spotted in this busy spectral region. For alcohols in general this peak falls at 1350 ± 50.
Typically the asymmetric C-C-O stretch of an alcohol will be the biggest peak between 1300 and 1000 (8). Although there are a lot of peaks in this range in Figure 7, the largest one labeled C at 1050 is properly assigned as the C-C-O asymmetric stretch of ethyl alcohol based on its intensity. In general, primary alcohols have this peak from 1075 to 1000. As we will see in the next column, the position of the C-C-O asymmetric stretch is used to distinguish different types of alcohols from each other.
The symmetric C-C-O stretch of ethyl alcohol is at 881 and is labeled D in Figure 7. This peak is sometimes very intense and thus it should be assigned. However, the C-C-O symmetric stretch is not diagnostically useful since it cannot be used to distinguish different types of alcohols from each other.
I am afraid this is all we have room for in this installment. We will discuss secondary alcohols, tertiary alcohols, and phenols in the next column.
Summary
C-O single bonds are highly polar. Their stretching vibrations have large values of dµ/dx, and thus give rise to an intense stretching peak normally found between 1300 and 1000.
Alcohols consist of an -OH, or hydroxyl, group attached to a carbon. Primary, secondary, and tertiary alcohols contain different numbers of carbons attached to the hydroxyl carbon. Phenols contain a hydroxyl moiety attached to an aromatic hydrocarbon group.
Alcohols have broad OH stretching and bending peaks that result from hydrogen bonding. The OH stretch falls at 3350 ± 50, the OH in-plane bend falls at 1350 ± 50, and the O-H wag falls at 650 ± 50.
Finally, primary alcohols have a strong C-C-O asymmetric stretch between 1075 and 1000.
References
- B.C. Smith, Spectroscopy30(1), 16–23 (2015).
- B.C. Smith, Spectroscopy31(1), 14–21 (2016).
- R. Morrison and R. Boyd, Organic Chemistry 6th Edition (Prentice Hall, Englewood Cliffs, New Jersey, 1992).
- B.C. Smith, Spectroscopy31(11), 28–34 (2016).
- B.C. Smith, Spectroscopy30(7), 26–31 (2015).
- B.C. Smith, Spectroscopy30(4), 18–23 (2015).
- B.C. Smith, Spectroscopy30(9), 40–45 (2015).
- B.C. Smith, Infrared Spectral Interpretation: A Systematic Approach (CRC Press, Boca Raton, 1998).

Brian C. Smith, PhD, is West Coast Business Development Manager for CAMO software, a company that sells chemometric, multivariate analysis, and process control software. Before joining CAMO Dr. Smith ran his own FT-IR training and consulting business for more than 20 years, and taught thousands of people around the world how to improve their FT-IR analyses and interpret infrared spectra. Dr. Smith has written three books on infrared spectroscopy: Fundamentals of FTIR and Infrared Spectral Interpretation, both published by CRC Press, and Quantitative Spectroscopy: Theory and Practice published by Academic Press. He has previously worked as an applications scientist at Bio-Rad and Princeton Instruments. He has published a number of papers in peer-reviewed journals and is co-inventor on a patent for an FT-IR method to monitor dust exposure in coal mines. He holds a Ph.D. in Physical Chemistry from Dartmouth College.

AI Shakes Up Spectroscopy as New Tools Reveal the Secret Life of Molecules
April 14th 2025A leading-edge review led by researchers at Oak Ridge National Laboratory and MIT explores how artificial intelligence is revolutionizing the study of molecular vibrations and phonon dynamics. From infrared and Raman spectroscopy to neutron and X-ray scattering, AI is transforming how scientists interpret vibrational spectra and predict material behaviors.
Real-Time Battery Health Tracking Using Fiber-Optic Sensors
April 9th 2025A new study by researchers from Palo Alto Research Center (PARC, a Xerox Company) and LG Chem Power presents a novel method for real-time battery monitoring using embedded fiber-optic sensors. This approach enhances state-of-charge (SOC) and state-of-health (SOH) estimations, potentially improving the efficiency and lifespan of lithium-ion batteries in electric vehicles (xEVs).
New Study Provides Insights into Chiral Smectic Phases
March 31st 2025Researchers from the Institute of Nuclear Physics Polish Academy of Sciences have unveiled new insights into the molecular arrangement of the 7HH6 compound’s smectic phases using X-ray diffraction (XRD) and infrared (IR) spectroscopy.