The C=O Bond, Part II: Aldehydes
Aldehydes feature a unique “lone hydrogen” atom, giving rise to unique C-H stretching and bending peaks, making them easy to spot. In this installment, a new feature is also presented, “IR Spectral Interpretation Review,” where key concepts from past columns are presented for those new to the column and for readers who need a refresher.
In the second installment in our survey of the infrared (IR) spectroscopy of the carbonyl bond, we discuss aldehydes. These molecules feature a unique "lone hydrogen" atom giving rise to unique C-H stretching and bending peaks, making aldehydes easy to spot. We also introduce a new feature, "IR Spectral Interpretation Review," where key concepts from past columns are presented for those new to the column and for readers who need a refresher.
This column is into its third year, which means we have covered a lot of territory and a refresher is in order. In this installment, I introduce a new feature called "Infrared Spectral Interpretation Review." The topics will be things we studied in the past whose knowledge will be critical for understanding the current column's content.
In the last installment (1), I introduced you to the structure and infrared (IR) spectroscopy of the carbonyl group, C=O. As we discovered, carbonyl groups have an intense C=O stretching peak that typically appears at 1900–1600 cm-1, and we then studied the spectra of the ketone functional group. In this installment, the IR spectra of the aldehyde functional group, which also contains a C=O bond, is introduced.
The Aldehyde Functional Group
The aldehyde functional group contains a carbonyl bond flanked by a carbon and hydrogen as shown in Figure 1.
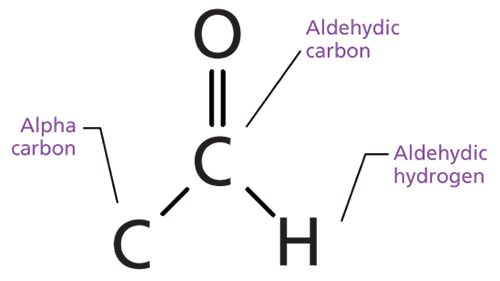
Figure 1: The structural framework of the aldehyde functional group.
The carbon in the C=O bond of an aldehyde is called the aldehydic carbon. The hydrogen attached to the aldehydic carbon is called the aldehydic hydrogen, and the carbon attached to the aldehydic carbon is called the alpha carbon. If the alpha carbon is saturated it gives a saturated aldehyde, and if the alpha carbon is aromatic the resultant functional group is called an aromatic aldehyde.
The aldehydic hydrogen in aldehydes is unique in that it is found at the end of a molecule, isolated on the far side of the carbonyl group. Our experience so far with C-H stretches is that they fall between 3200 and 2800 cm-1 (going forward assume all peak positions are in wavenumbers, cm-1) (3,4). Recall that one of the things that determines peak positions in IR spectroscopy is bond strength (2), which determines the force constant for a vibration. Because the oxygen in the C=O bond is very electronegative, it pulls electron density away from the aldehydic C-H bond, weakening the bond and lowering its force constant. The net effect is a lowering of the aldehydic C-H stretch to the 2850–2700 range. This is one of the lowest wavenumber C-H stretches you will ever see (5), making this peak a particularly good diagnostic group wavenumber for aldehydes. The IR spectrum of a saturated aldehyde, isovaleraldehyde, is shown in Figure 2.
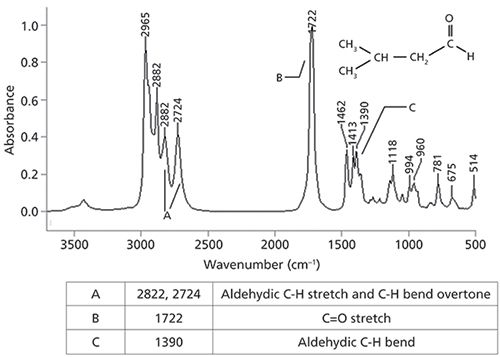
Figure 2: The IR spectrum and peak assignment table for isovaleraldehyde or 3-methylbutyraldehyde, C5H10O.
We will nominally assign the peak at 2822 as the aldehydic C-H stretch (more on the peak at 2724 later). Aldehydes also have an aldehydic C-H bending peak around 1390 (5). The C=O stretching peak for isovaleraldehyde is at 1722, and in general for saturated aldehydes this peak falls at 1730 ± 10. For aromatic aldehydes the C=O stretch falls in a lower wavenumber range, from 1710 to 1685, because of conjugation (1). Aromatic aldehydes also frequently have a medium size peak from 1210 to 1160 (5) from the stretching of the alpha carbon–aldehydic carbon C-C bond. The diagnostic group wavenumbers for aldehydes are summarized in Table I.
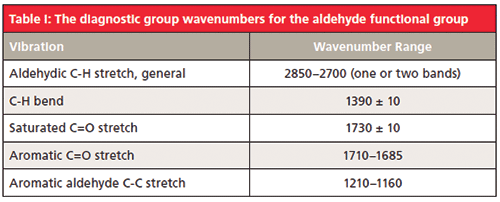
Note that the C=O stretching peak range for ketones and aldehydes overlap to some extent (1). This is why in general C=O stretching peaks by themselves are not used to identify a carbonyl containing functional group, other peaks need to be used. For aldehydes the combination of a low wavenumber C-H stretch and a C=O stretch are diagnostic.
Fermi Resonance
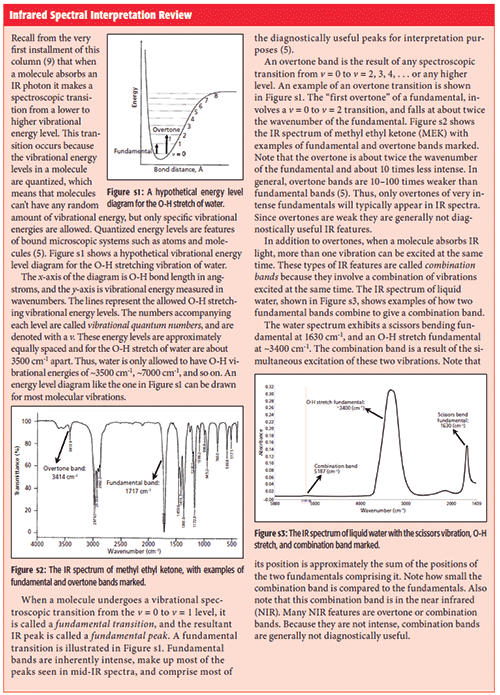
Note that in Figure 2 there are two peaks in the aldehydic C-H stretching range at 2822 and 2724. However, there is a problem here. There is only one aldehydic C-H bond, but two stretching peaks. How is this possible? The answer is that one of the peaks is from the C-H stretch, but the other is from the first overtone of the 1390 aldehydic C-H bending peak. Normally an overtone peak would not appear at this high of an intensity (for a review of overtones and their intensities see the "Infrared Spectral Interpretation Review" sidebar), but it does so here as a result of a phenomenon called Fermi resonance.
Infrared Spectral Interpretation Review
Fermi resonance (5,7) occurs if two vibrational energy levels, one a fundamental and the other an overtone, happen to be of the same symmetry and are close in energy. In this case the levels may interact vibrationally with each other, and the net spectroscopic effect is that the overtone will "steal intensity" from the fundamental, appearing more intense than expected. Additionally, the energy levels will "repel" each other and the resultant peaks will be dislocated from where they were expected.
Click here to take this month's quiz.
In the case of aldehydes, the C-H stretch fundamental and the first overtone of the aldehydic C-H bend both fall near 2800, and when they are of the same symmetry they frequently Fermi resonate, giving rise to two peaks between 2850 and 2700 rather than one. This explains the two peaks between 2850 and 2700 in Figure 2, with the 2822 peak being nominally assigned as the C-H stretch, and the 2724 peak being nominally assigned to the C-H bend overtone. To be clear, not all aldehyde spectra exhibit the peak doubling that is the hallmark of Fermi resonance, but enough do that Fermi resonance should be mentioned in any discussion of the IR spectra of aldehydes. Additionally, there are other functional groups and molecular types besides aldehydes that may exhibit Fermi resonance.
Conclusion
In conclusion, we have seen that aldehydes consist of a carbonyl bond flanked by a carbon and a hydrogen. The C=O stretch of aldehydes falls in a similar range to that of ketones, and falls in two different ranges for saturated and aromatic aldehydes. Aldehydes exhibit a unique low wavenumber C-H stretch that may be two peaks because of Fermi resonance. The diagnostic pattern of peaks to remember to identify an aldehyde is a low wavenumber C-H stretch combined with a C=O stretch. In part III of our survey of carbonyl containing functional groups, we will discuss carboxylic acids.
References
(1) B.C. Smith, Spectroscopy 32(9), 31–36 (2017).
(2) B.C. Smith, Spectroscopy 30(4), 18–23 (2015).
(3) B.C. Smith, Spectroscopy 30(7), 26–31, 48 (2015).
(4) B.C. Smith, Spectroscopy 30(9), 40–45 (2015).
(5) B.C. Smith, Infrared Spectral Interpretation: A Systematic Approach (CRC Press, Boca Raton, Florida, 1999).
(6) B.C. Smith, Spectroscopy 31(1), 14–21 (2016).
(7) E. Fermi, Z. Physik 71(250), 250–255 (1931).
(8) B.C. Smith, Spectroscopy 31(7), 30–34 (2016).
(9) B.C. Smith, Spectroscopy 30(1), 16–23 (2015).
Jon. W. Wong, PhD

Brian C. Smith, PhD, is the West Coast Business Development Manager for CAMO Software, a company that sells chemometric, multivariate analysis, and process control software. Before joining CAMO, Dr. Smith ran his own FT-IR training and consulting business for more than 20 years. Dr. Smith has written three books on infrared spectroscopy: Fundamentals of FTIR and Infrared Spectral Interpretation, both published by CRC Press, and Quantitative Spectroscopy: Theory and Practice published by Academic Press. He can be reached at: SpectroscopyEdit@UBM.com
AI Shakes Up Spectroscopy as New Tools Reveal the Secret Life of Molecules
April 14th 2025A leading-edge review led by researchers at Oak Ridge National Laboratory and MIT explores how artificial intelligence is revolutionizing the study of molecular vibrations and phonon dynamics. From infrared and Raman spectroscopy to neutron and X-ray scattering, AI is transforming how scientists interpret vibrational spectra and predict material behaviors.
Real-Time Battery Health Tracking Using Fiber-Optic Sensors
April 9th 2025A new study by researchers from Palo Alto Research Center (PARC, a Xerox Company) and LG Chem Power presents a novel method for real-time battery monitoring using embedded fiber-optic sensors. This approach enhances state-of-charge (SOC) and state-of-health (SOH) estimations, potentially improving the efficiency and lifespan of lithium-ion batteries in electric vehicles (xEVs).
New Study Provides Insights into Chiral Smectic Phases
March 31st 2025Researchers from the Institute of Nuclear Physics Polish Academy of Sciences have unveiled new insights into the molecular arrangement of the 7HH6 compound’s smectic phases using X-ray diffraction (XRD) and infrared (IR) spectroscopy.