Density Functional Theory Investigation on the Molecular Structure and Vibrational Spectra of Triclosan
Density functional theory (DFT) methods possess a strong ability in the molecular modeling of geometrical and spectroscopic parameters because of their high accuracy and consistency with experimental data. In this study, the performances of different DFT methods to predict the molecular structural and vibrational properties of triclosan were investigated and compared. DFT methods comprised of five commonly used functionals, namely B3LYP, LSDA, PBEPBE, CAM-B3LYP, and M06-2X, were examined. The proper choice of the basis set had a significant influence on the DFT simulation results. Therefore, the effects of different basis sets, including LANL2DZ, SDD, LANL2MB, 6-311G, and 6-311++G(d,p), on the theoretical calculations of triclosan, were also evaluated. Results revealed that the M06-2X/6-311++G(d,p) level of theory was superior to other levels in simulating the structure of triclosan. The LSDA/6-311G level of theory showed the best performance in predicting the vibrational spectra of triclosan. These results can provide a fundamental benchmark for the study of environmental pollution mechanisms and ecological effects of triclosan.
Triclosan (2,4,4’-trichloro-2’-hydroxydiphenyl ether), a broad-spectrum antibacterial agent, has been extensively used in many types of personal care products, including toothpaste, hand sanitizer, cleaners, shampoo, deodorant soaps, and cosmetics (1). Triclosan has also been incorporated into disinfectants, beddings, kitchen appliances, toys, socks, and underwear (2). Most of the time, triclosan gets into the water through sewage treatment and eventually flows into the surface water, underground water, and soil. Currently, triclosan has been found most often in treated wastewater effluents and sludge, surface waters, and sediments (3). According to researchers, triclosan is toxic to mammals and water-living organisms such as fish and algae (4). Therefore, the threats of triclosan to human health and the ecological environment have attracted increased attention.
The molecular modeling of geometrical and spectroscopic parameters is a rapid and cost-effective way to determine the application potential of numerous compounds (5). It can provide insights into the relationship between electronic structure and mechanical properties. Until now, few studies have performed theoretical calculations on triclosan. Iconomopoulou and others (6) recorded the Raman spectrum of triclosan in its solid state within the range of 500–3500 cm-1. Connor and others (7) provided the potential energy surface of the triclosan molecule and conducted ab initio structural analysis. Özişik and others (8) reported the calculated harmonic frequencies at the B3LYP/6-311G level along with the infrared (IR) intensities and presented the vibrational assignments of triclosan on the basis of the total energy distribution. Latosińska and others (9) studied the molecular dynamics and thermal stability of triclosan in solid state by nuclear quadrupole resonance spectroscopy. They used density functional theory (DFT) with the B3LYP hybrid function and the 6-311++G** basis set to determine the geometry optimization, Raman spectrum, and electric field gradient.
DFT is becoming a powerful tool in the theoretical investigation of the structural and vibrational properties of molecules because of its accuracy and consistency with experimental data. Various methods are available in DFT, and the prediction results significantly differ by using different theory levels. The performance comparisons among these various DFT levels are crucial for understanding the toxic properties and action mechanisms of triclosan. Positive and effective measures should be taken to eliminate the influence of triclosan on aquatic ecosystems and human and animal health. However, to the best of our knowledge, no study has conducted structural and vibrational analysis of triclosan with the application of DFT functionals coupled with various basis sets.
On the basis of the above considerations, the main objective of this study was to find the best functional and basis set that could accurately predict the geometry and vibrational spectra of triclosan by comparing the calculated results with the experimental counterparts.
Methods
All quantum chemical calculations were conducted using the Gaussian 09W software package (10), which was installed on Windows 10. The visualization of the optimized structure and simulated vibrational spectra was performed using the GaussView 6.0 software. The initial optimization parameters of triclosan were taken from experimental molecular geometry (11). The geometry of triclosan was calculated on the basis of B3LYP, LSDA, PBEPBE, CAM-B3LYP, and M06-2X functionals with the LANL2DZ, SDD, LANL2MB, 6-311G, and 6-311++G(d,p) basis sets. Subsequently, on the basis of the optimized structures, the vibrational frequencies of the target compound were computed at the same theory level.
The neglect of anharmonicity effects and electron correlation often led to the overestimation of calculated vibrational frequencies. The wavenumber-linear scaling (WLS) method has been extensively applied in frequency calculations because of its simplicity and efficacy (12–14). Here, we employed the WLS method to correct the calculated vibrational frequencies.
Results and Discussion
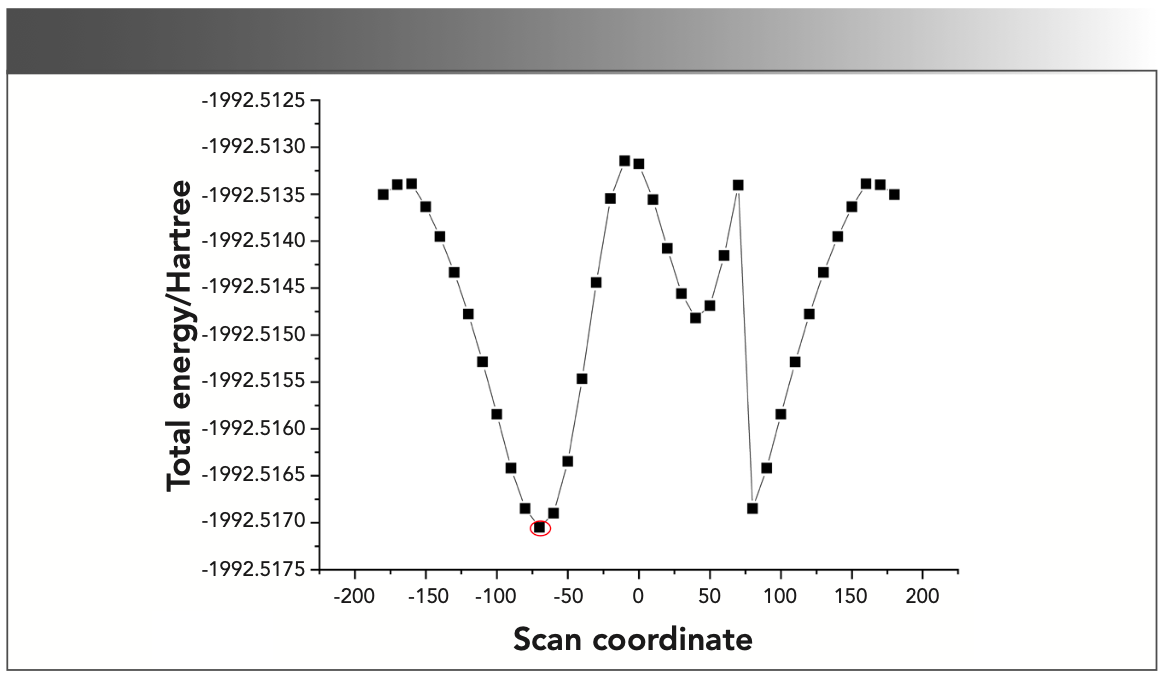
The most stable minimum energy conformation of the triclosan molecule should be investigated before proceeding to geometry optimization and the frequency calculations. Therefore, the potential energy scan on the dihedral angle, C4-C3-O10-C15, was performed using the B3LYP/6-311G level with the region of −180° to +180° at a step of 10°. Figure 1 depicts the graphical presentation of the potential energy scan, which reveals that the lowest potential energy was at −70° (−1992.5171 Hartree).
FIGURE 1: Graph of potential energy scan of the triclosan molecule.
Geometry Optimization with Various Methods Using the LANL2DZ Basis Set
DFT is an approximation method that can deal with heterogeneous interacting multiparticle systems. The exchange–correlation energy plays a key role in all of the functionals, and their approximate natures determine the accuracy of the DFT methods.
Local-density approximations (LDAs) are a class of approximations to the exchange–correlation energy functional in DFT, which only depend on the value of the electronic density at each point in space. The local spin-density approximation (LSDA) is the extension of LDAs to spin-polarized systems, which is appropriate for systems having slowly varying densities. Nevertheless, LDAs tend to favor high-spin-state structures and yield overbinding energies (15).
PBEPBE belongs to generalized gradient approximations (GGAs), which improve the LSDA definition of the exchange–correlation energy by incorporating the first derivatives of the electronic density. In GGAs, the exchange–correlation potential depends on the electron density and its gradient, and it is a complicated function in three-dimensional (3D) space. GGAs tend to soften and expand bonds (16), providing better structural energy differences (17), atomization energies, and total energies (18). However, PBEPBE is not desirable in describing many important properties in solid-state physics (19).
B3LYP, CAM-B3LYP, and M06-2X, belonging to hybrid density functionals, have found widespread application in quantum chemical calculations (20–23). They are a class of approximations to the exchange–correlation energy functional in DFT that includes a portion of exact exchange from Hartree–Fock theory with exchange and correlation from other sources. B3LYP is Becke’s three-parameter hybrid exchange function (24) coupled with Lee–Yang–Parr (LYP) correlation function. CAM-B3LYP combines the features of hybrid functional B3LYP with the long-range corrected functionals of Hirao and others (25). It is a mixture of Hartree–Fock and DFT exchange. The highly parameterized, empirical exchange correlation functional, M06-2X (26), developed by Zhao and Truhlar, has proven to be a promising tool in dealing with noncovalent interactions (27,28). It accounts implicitly for “medium-range” electron correlation because of the way noncovalent interactions are parameterized, which is sufficient in describing the dispersion interactions within many complexes (28).
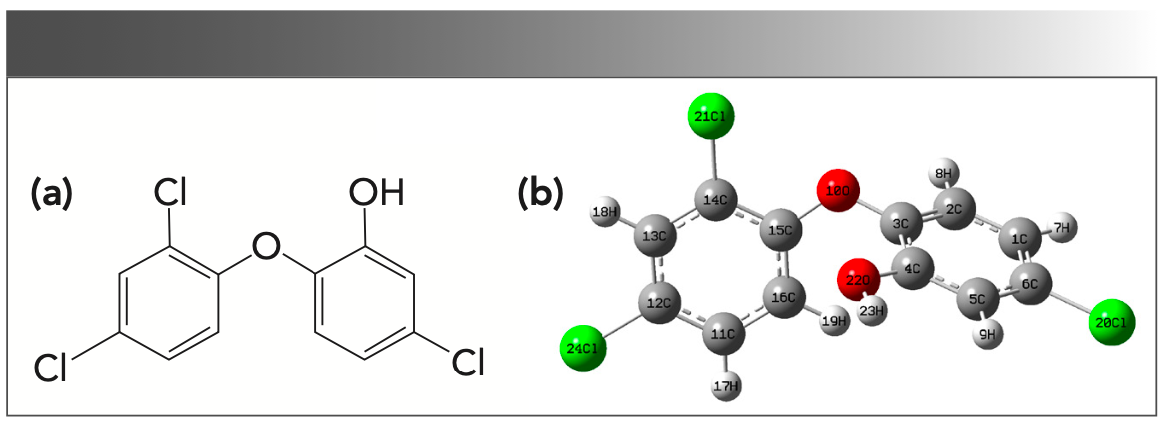
Figure 2a displays the chemical structure of triclosan. Figure 2b provides the optimized structure of triclosan at the M06-2X/6-311++G(d,p) theory level. The geometrical parameters optimized by the five different DFT functionals at the LANL2DZ basis set for the triclosan molecule are presented in Table I. Additionally, Table I lists the experimental values for performance comparison.
FIGURE 2: (a) Chemical structure of triclosan. (b) Optimized structure of triclosan at M06-2X/6-311++G(d,p) level.
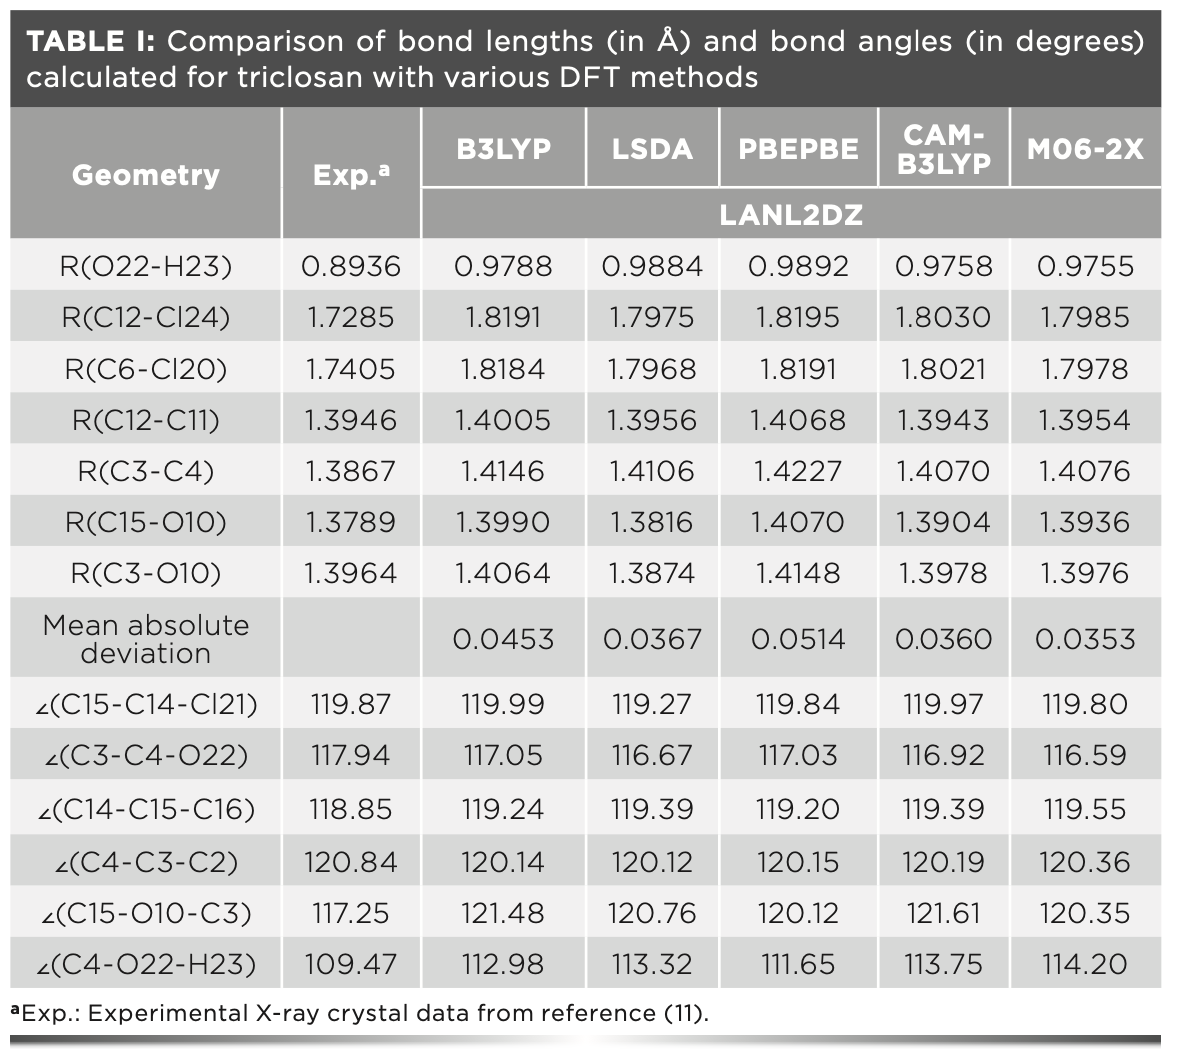
As shown in Table I, the computed bond lengths at various levels were generally longer than the corresponding experimental ones. The O22-H23 bond distances computed by B3LYP, LSDA, PBEPBE, CAM-B3LYP, and M06-2X at the LNL2DZ basis set were 0.9788, 0.9884, 0.9892, 0.9758, and 0.9755 Å, respectively. Compared with the corresponding experimental value of 0.8936 Å, the absolute errors were 0.0852 Å for B3LYP, 0.0948 Å for LSDA, 0.0956 Å for PBEPBE, 0.0822 Å for CAM-B3LYP, and 0.0819 Å for M06-2X. The bond lengths predicted by M06-2X were nearest to the experimental value. Moreover, the M06-2X method yielded the best results in the simulation of the C3-O10 and O22-H23 bond distances. For C12-Cl24, C6-Cl20, and C15-O10, M06-2X was superior to B3LYP, PBEPBE, and CAM- B3LYP, whereas it was slightly poorer than LSDA. Moreover, CAM-B3LYP provided better predictions of C12-C11 and C3-C4 bonds compared with M06-2X.
The mean absolute deviations between the experimental bond distances and the simulated results are also listed in Table I, which were 0.0453, 0.0367, 0.0514, 0.0360, and 0.0353 Å for B3LYP, LSDA, PBEPBE, CAM-B3LYP, and M06-2X, respectively. Overall, among the five DFT methods, M06-2X gave the best performance in bond length prediction of the title compound.
The calculated C15-O10-C3 angles regardless of calculating levels were larger than the observed value by ap- proximately 2.87°–4.36°. The calculated C4-O22-H23 angles with various DFT methods differed by 2.18°–4.73° with the observed value. The absolute prediction errors for other bond angles were not more than 1.35°. These results demonstrated good agreement between the theoretical geometrical parameters of triclosan and the experimental ones.
Geometry Optimization with M06-2X at Various Basis Sets
The proper choice of basis set has a significant influence on the geometry optimization results. Thus, selecting an optimal basis set is essential in enhancing the accuracy of the DFT simulation, which can help us to better understand the properties of the target compound. Here, we conducted geometry optimization of triclosan using M06-2X with various basis sets. The optimized geometrical parameters and the experimental ones are listed in Table II.
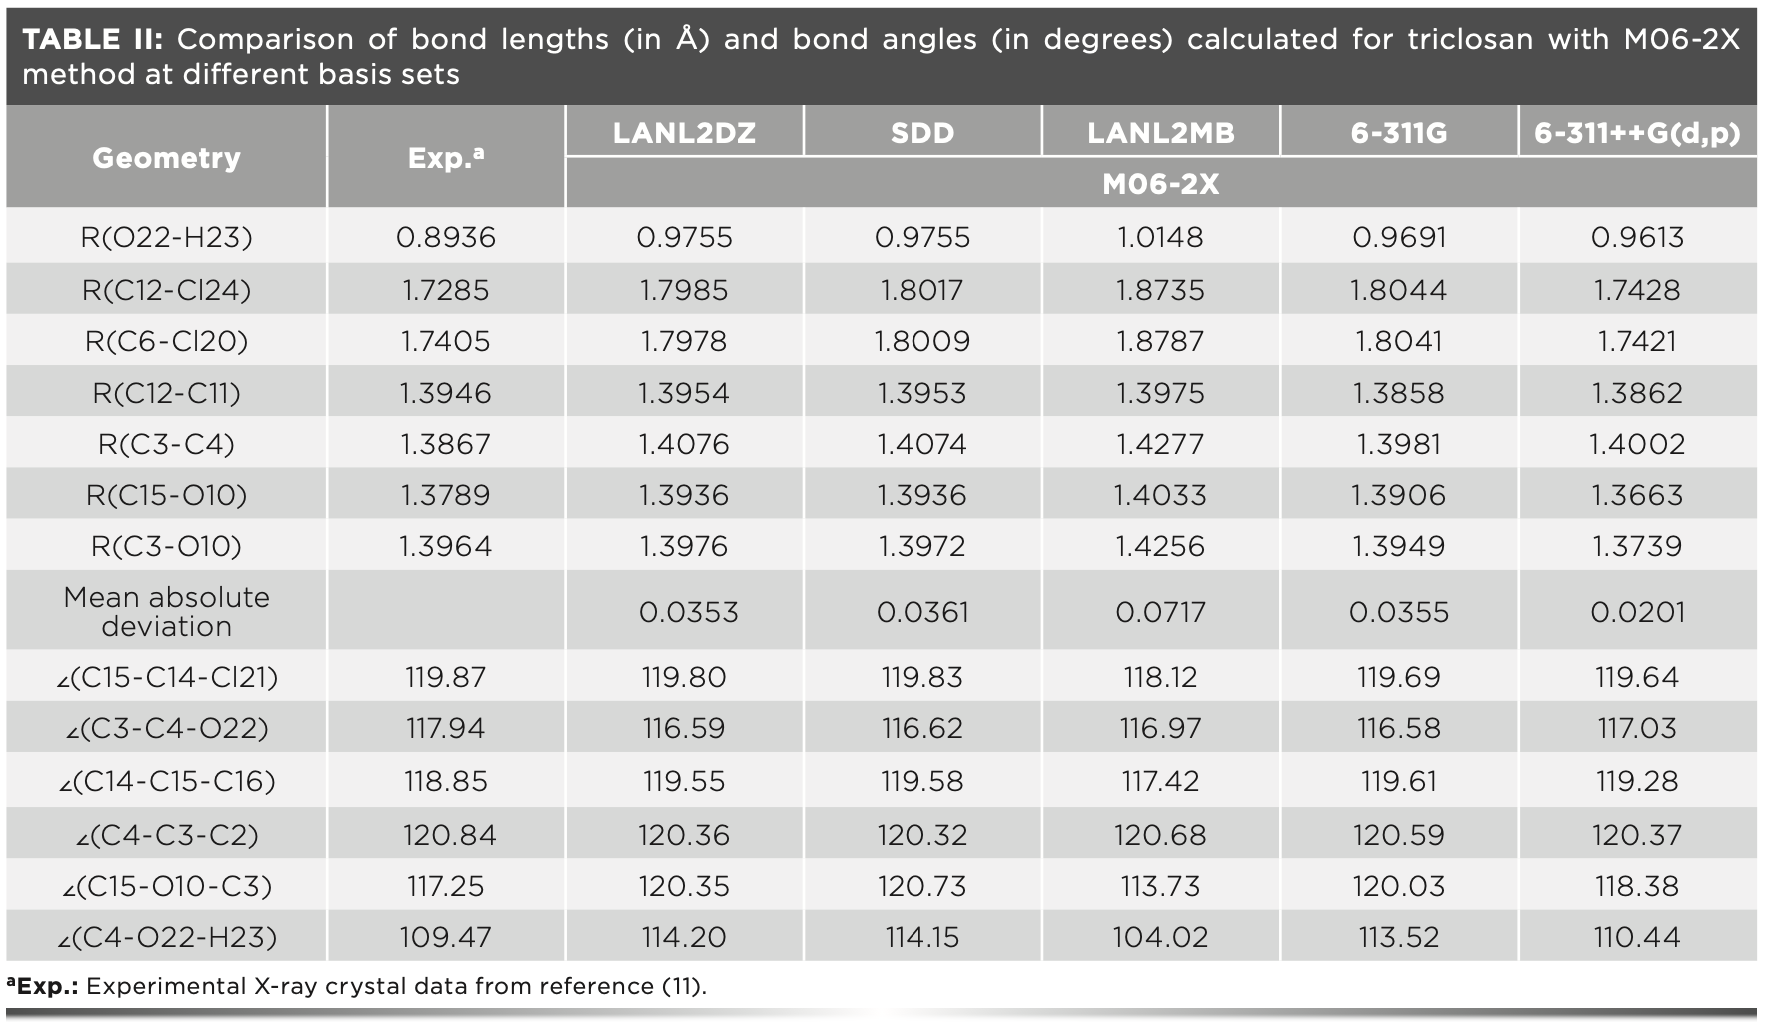
The O22-H23 distance was 0.8936 Å in the crystal structure of triclosan. We calculated this distance as 0.9755, 0.9755, 1.0148, 0.9691, and 0.9613 Å by using the LANL2DZ, SDD, LANL2MB, 6-311G, and 6-311++G(d,p) basis sets, respectively. The 6-311++G(d,p) basis set yielded the best results. The C12-Cl24 bond distances calculated by the aforementioned levels of theory were 1.7985, 1.8017, 1.8735, 1.8044, and 1.7428 Å, respectively. Compared with the observed value of 1.7285 Å, the absolute errors were 0.0700, 0.0732, 0.1450, 0.0759, and 0.0143 Å, respectively. The bond lengths simulated by 6-311++G(d,p) were in better agreement with the observed value than other basis sets. Furthermore, the 6-311++G(d,p) basis set also performed better in the prediction of the C6-Cl20 length.
The mean absolute deviations (in Table II) were 0.0353 Å for LANL2DZ, 0.0361 Å for SDD, 0.0717 Å for LAN-L2MB, 0.0355 Å for 6-311G, and 0.0201 Å for 6-311++G(d,p). We can conclude that the 6-311++G(d,p) outperformed other basis sets in simulating the bond lengths of triclosan. The 6-311++G(d,p) basis set was a split valence basis of triple zeta quality; 6-311G was enlarged by diffuse functions and augmented by the d-polarization function on heavy atoms and the p-polarization function on hydrogens. The inclusion of polarization and diffuse functions in basis sets, such as 6-311++G(d,p), is promising when the studied system has long-range interactions (for example, hydrogen (O-H...Cl) and halogen (Cl...O) bonds in the triclosan molecule).
With the exception of C15-O10-C3 and C4-O22-H23, the calculated bond angles showed an acceptable agreement with the experimental counterparts, and the differences were not more than 1.75°. For C15-O10-C3, the error between the experimental angles and the computed ones with M06-2X at various basis sets ranged from 1.13° to 3.52°. For C4-O22- H23, the calculated values differed with the experimental value by 0.97°–5.45°.
Vibrational Spectra Calculated with Various Methods at LANL2DZ Basis Set
The scaled vibrational frequencies together with the IR intensities for triclosan computed with various DFT levels at LANL2DZ basis set are summarized in Table III. Table III also lists the vibrational assignments and observed frequencies of this molecule, which were taken from the literature (8).
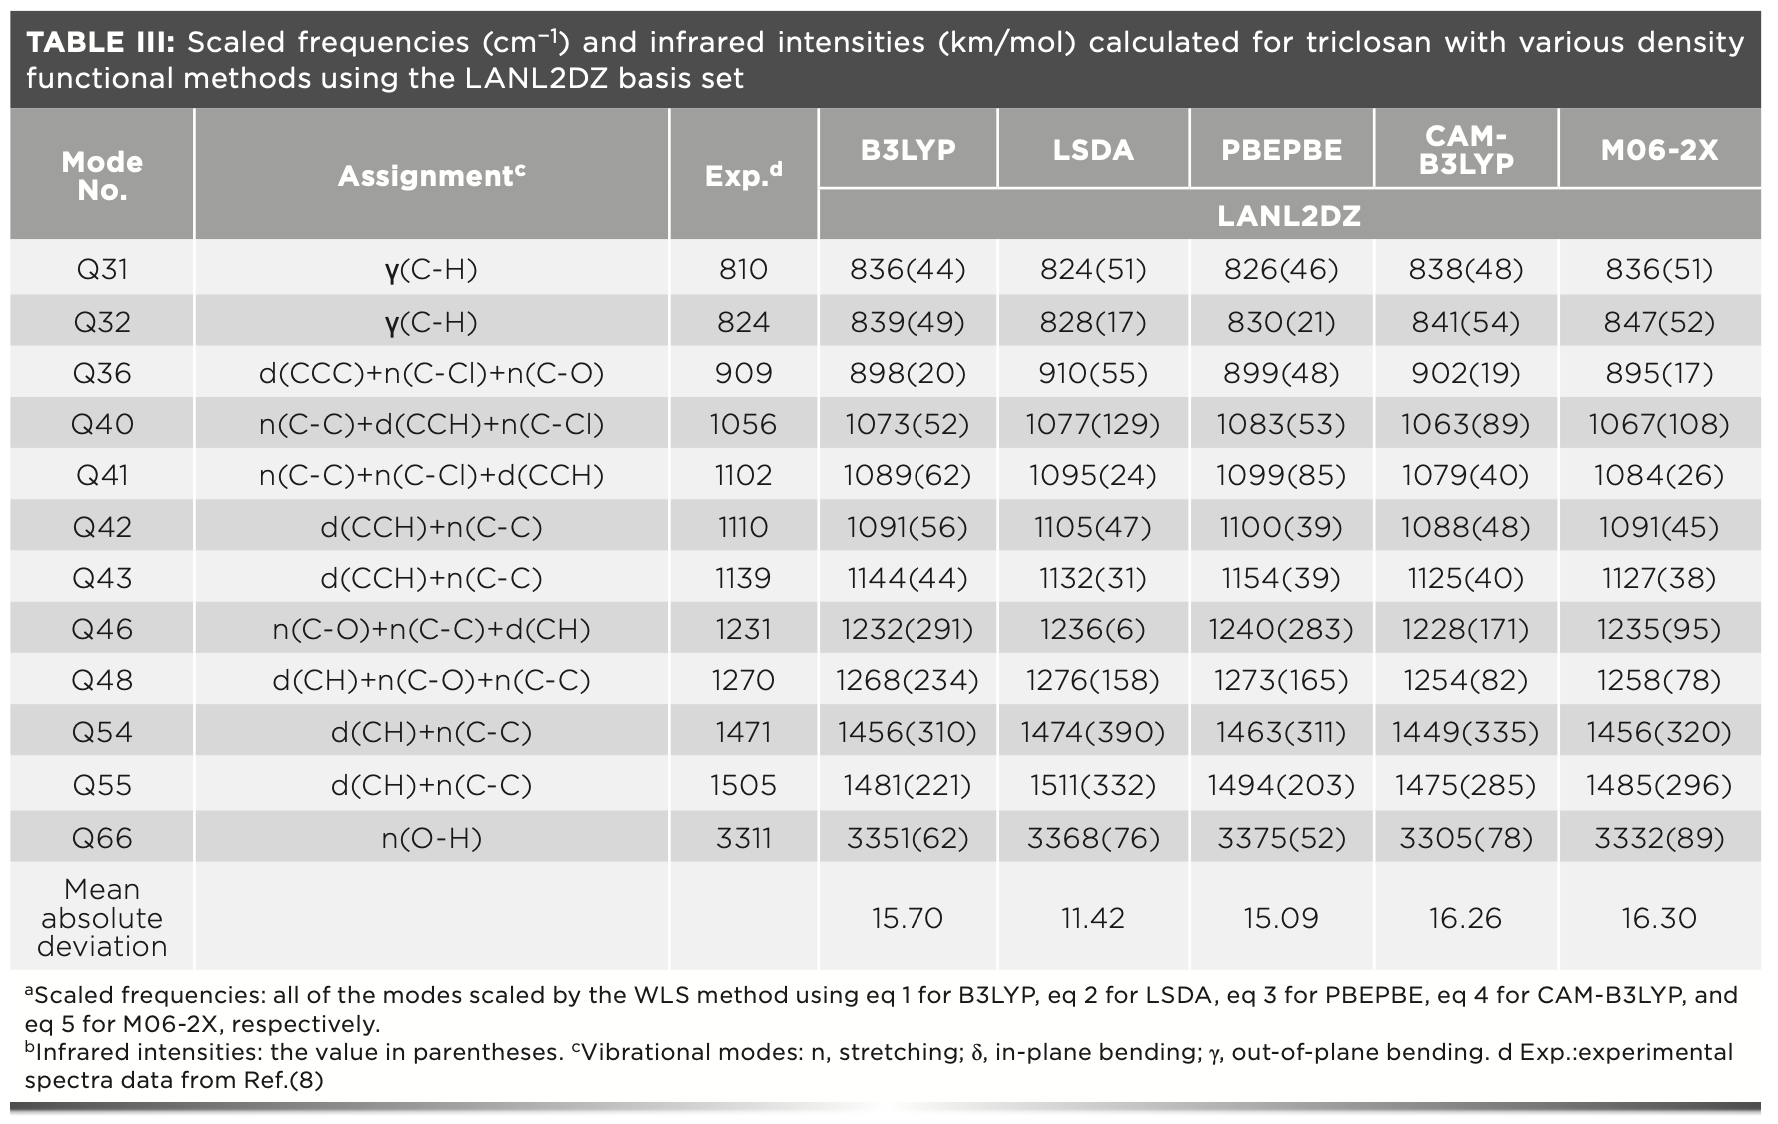
A total of 66 vibrational frequencies can be experimentally observed. We chose 12 frequencies to analyze because their IR intensities were relatively stronger. The harmonic frequencies with weaker intensities were of no significance to our theoretical investigations of the structural and vibrational spectra of triclosan.
To date, different scaling procedures for correcting computed vibrational frequencies have been proposed to reduce the prediction errors (29–31). These scaling methods demonstrated their capabilities in reproducing vibrational spectra. However, the transferability of the scaling factors for these methods were not satisfactory because of the interactions between the molecule and the surroundings. Determination of the optimal scale factor is a major issue in the correction process. The WLS procedure can provide a good description of the relationship between the scale factor and the calculated vibrational frequencies (13,14). It has the advantage of simplicity and efficacy and thus was employed in the present study.
A scatter diagram of the ratios of the experimental harmonic frequencies to the calculated ones, f(exp)/f(calc), against f(calc), with various functionals, is illustrated in Figure 3.
FIGURE 3: Correlation between the ratios of the experimental frequencies to the unscaled calculated harmonic frequencies, f(exp)/f(calc), and the unscaled calculated harmonic frequencies with different methods for triclosan.
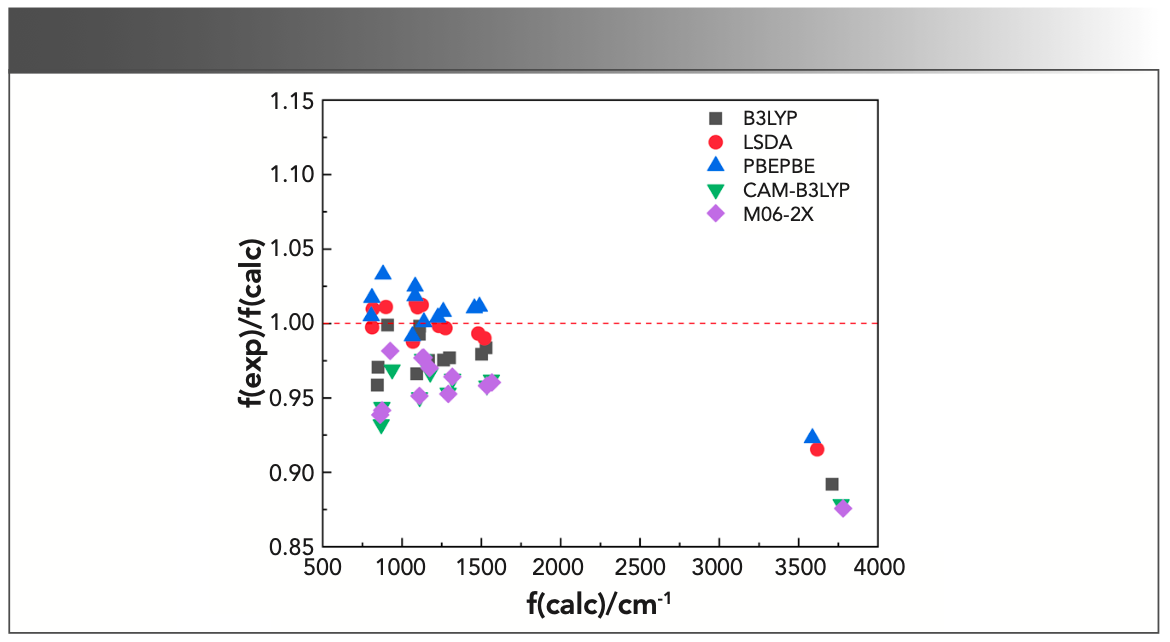
The correlations between f(exp)/f(calc) and f(calc) for B3LYP, LSDA, PBEPBE, CAM-B3LYP, and M06-2X could be obtained from Figure 3, which were as follows:

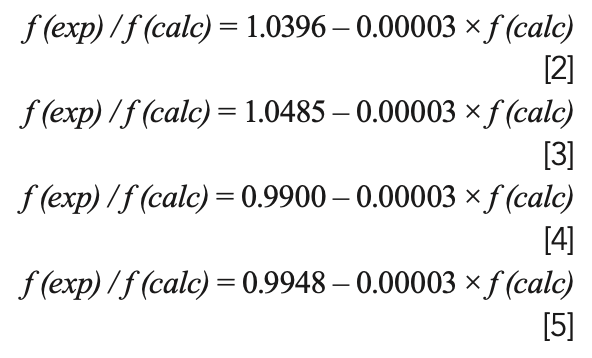
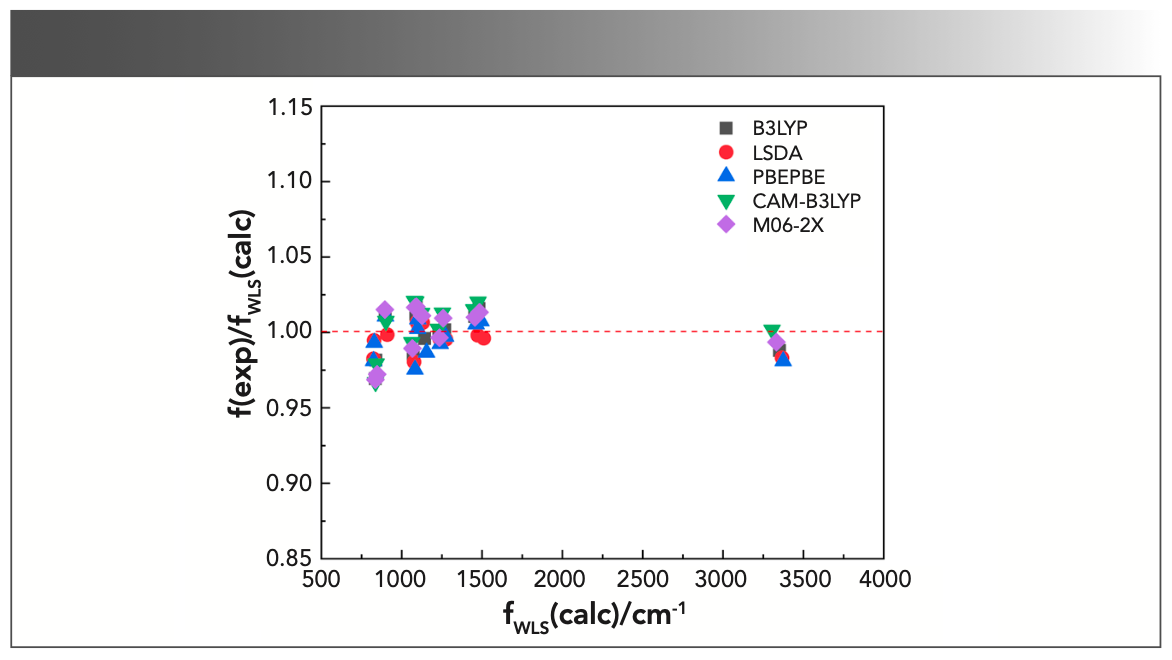
where f(exp)/f(calc) is exactly the scale factor. As can be seen from the above formulas, there would be a corresponding scaling factor for each calculated harmonic frequency. Thus, the number of scale factors was the same as that of the calculated frequencies, which was the major difference between WLS and other correction methods. Subsequently, the calculated frequencies are multiplied by their corresponding scaling factors to obtain the WLS-scaled frequencies. To obtain a more intuitive understanding of the effect of scaling factors on the vibrational frequencies, the ratios of the experimental frequencies to the WLS-scaled calculated frequencies, f(exp)/fWLS(calc), for five different DFT methods were plotted against fWLS(calc) in Figure 4. Comparing the values of f(exp)/fWLS(calc) within the range of 0.97–1.02 with the f(exp)/f(calc) values within the range of 0.85–1.05 in Figure 3, we could conclude that all of the calculated frequencies obtained good correction regardless of theory level, especially for the n(O-H) frequency. The red dashed line in Figure 4 represents the ideal results: the closer the points are to this, the better the DFT method is. As can be seen, the calculated frequencies (scaled) with LSDA showed better agreement with the experimental value.
FIGURE 4: Plot of the ratios of the experimental frequencies to the WLS- scaled calculated harmonic frequencies, f(exp)/fWLS(calc), against the WLS- scaled calculated harmonic frequencies with different methods for triclosan.
The vibrational spectra of triclosan calculated with B3LYP, LSDA, PBEPBE, CAM-B3LYP, and M06-2X using the LAN-L2DZ basis set are presented in Figure 5. The strong absorption bands at 1471 and 1505 cm−1 in the experimental spectra are attributed to the combinations of C-H in-plane bending and C-C stretching. The calculated vibrational frequencies with the above methods were 1502 and 1530, 1481 and 1520, 1456 and 1488, 1535 and 1564, and 1535 and 1567 cm-1, respectively. With the application of WLS, the values were 1456 and 1481, 1474 and 1511, 1463 and 1494, 1449 and 1475, and 1456 and 1485 cm-1, respectively. Apparently, the theoretical frequencies calculated by LSDA matched better with the observed value. Additionally, for C-H out-of-plane bending and C-Cl stretching vibration modes, LSDA was superior to other methods in the prediction of the vibrational frequencies.
FIGURE 5: Theoretical frequencies (no scale) and IR intensities calculated with B3LYP, LSDA, PBEPBE, CAM-B3LYP, and M06-2X methods using the LANL2DZ basis set for triclosan. Note the abscissa (x-axis) is in wavenumbers (cm-1).
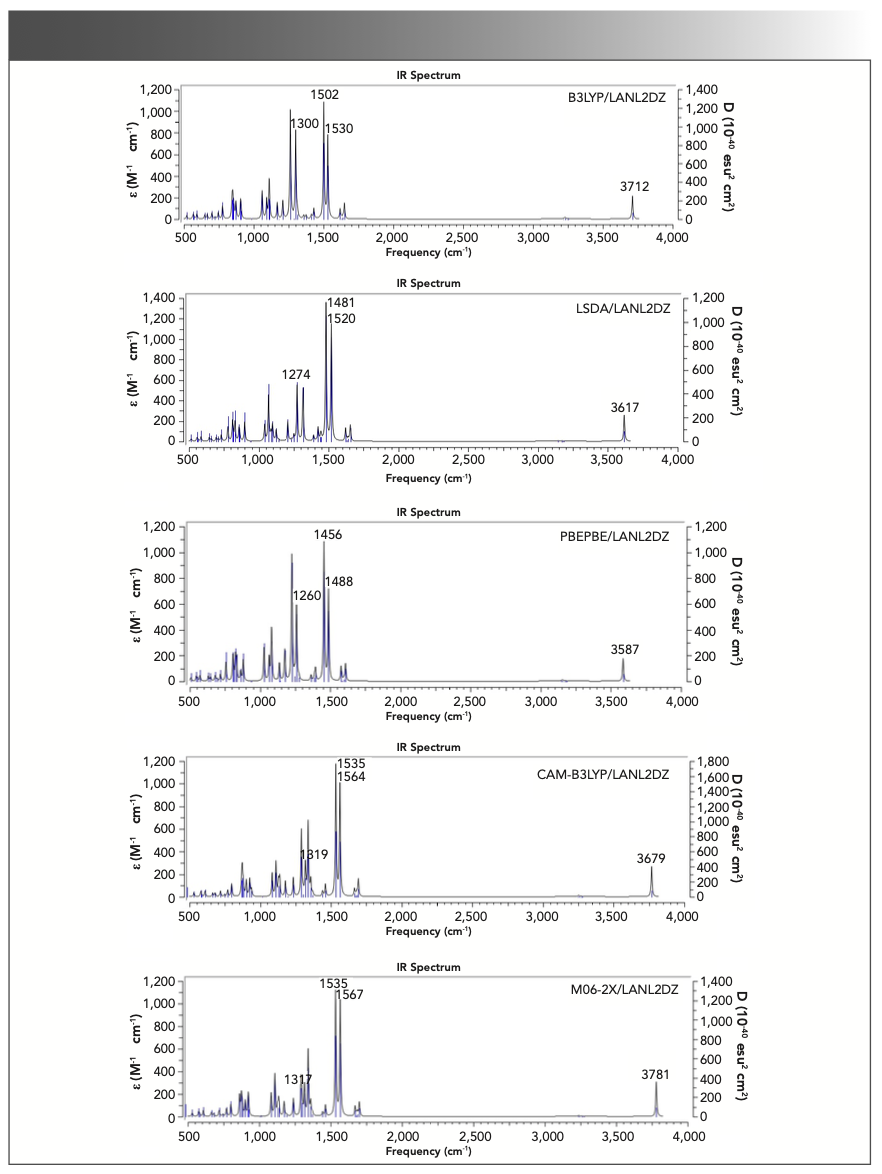
The values of mean absolute deviations for B3LYP, LSDA, PBEPBE, CAM-B3LYP, and M06-2X were 15.70, 11.42, 15.09, 16.26, and 16.30 cm-1, respectively (Table III). Remarkably, LSDA performed the best for vibrational frequency calculation of triclosan, and its mean absolute deviation value was much smaller than those of other methods.
Vibrational Spectra Calculated with LSDA Method at Various Basis Sets
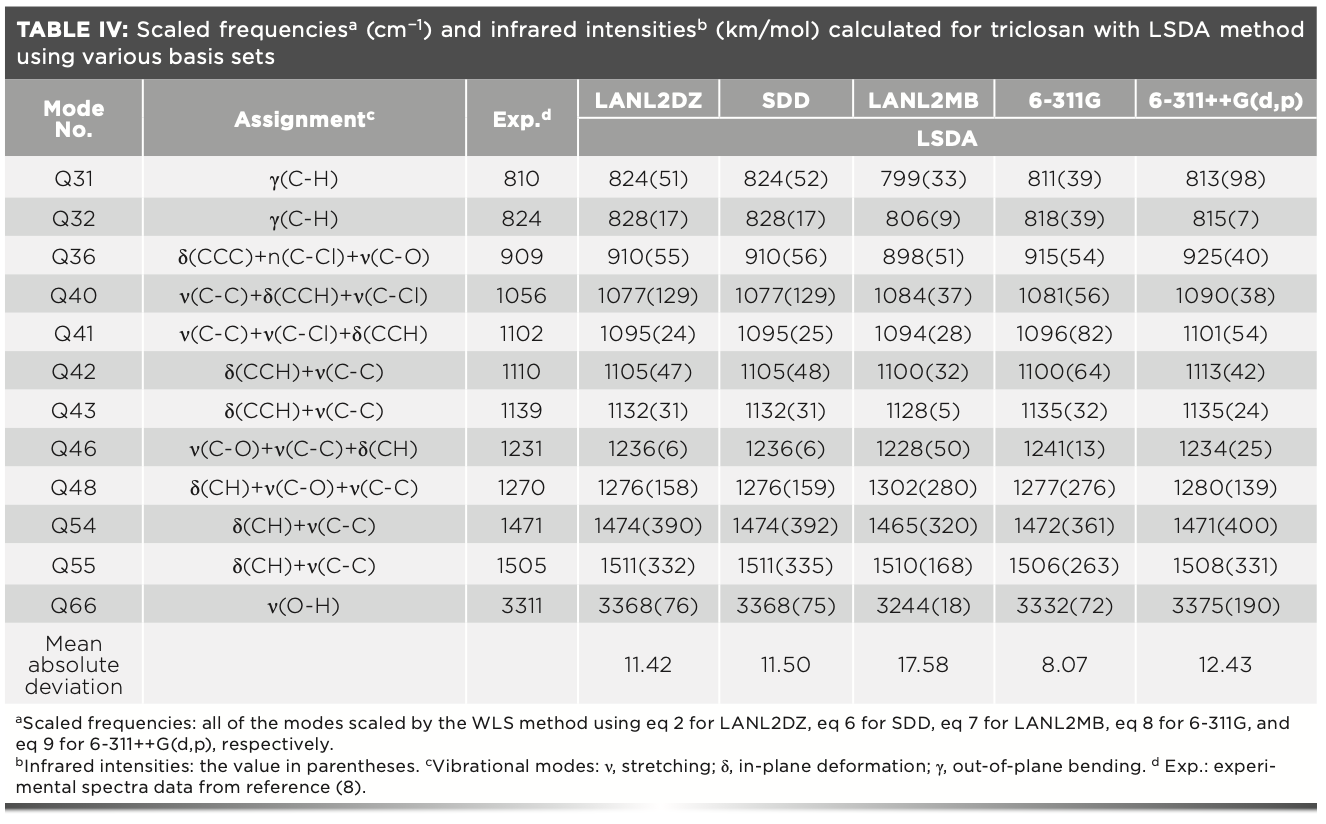
The scaled frequencies together with the relative IR intensities for triclosan calculated with LSDA using various basis sets, the vibrational band assignments, and the experimental harmonic frequencies of the title molecule taken from reference (8) are listed in Table IV.
A scatter diagram of the values of f(exp)/f(calc) against the f(calc) with various levels of theory is illustrated in Figure 6.
FIGURE 6: Correlation between the ratios of the experimental frequencies to the unscaled calculated harmonic frequencies, f(exp)/f(calc), and the unscaled calculated harmonic frequencies with LSDA method at various basis sets for triclosan.
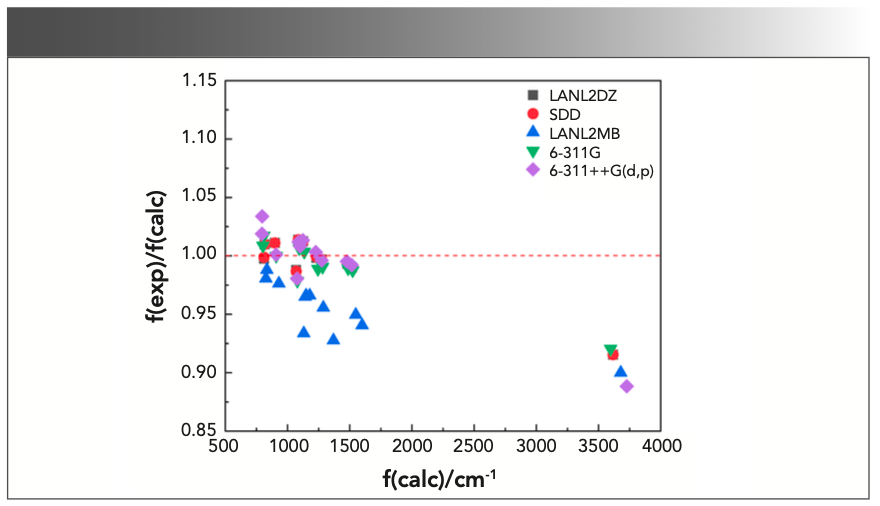
On the basis of the figure, we could derive the relationship between f(exp)/ f(calc) and f(calc) at LANL2DZ, SDD, LAN-L2MB, 6-311G, and 6-311++G(d,p) basis sets as follows:

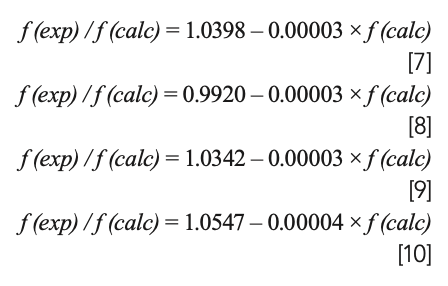
As can be observed, a one-to-one correspondence existed between the calculated vibrational frequencies and the scale factors. The number of scale factors was equal to that of the calculated frequencies in the WLS procedure. To further investigate the effectiveness of different basis sets in simulating vibrational spectra of triclosan, a scatter plot of the values for f(exp)/fWLS(calc) with various basis sets against the fWLS(calc) is shown in Figure 7. The comparison between Figures 6 and 7 revealed that all the calculated frequencies through WLS scaling process have better agreement with the observed frequencies than the unscaled calculated ones. Among the five basis sets surveyed here, data points yielded by 6-311G were more closely distributed at the red dashed line, indicating that the 6-311G performed better in the prediction of vibrational frequencies of triclosan.
FIGURE 7: Plot of the ratios of the experimental frequencies to the WLS- scaled calculated harmonic frequencies, f(exp)/fWLS(calc), against the WLS- scaled calculated harmonic frequencies with LSDA method at different basis sets for triclosan.
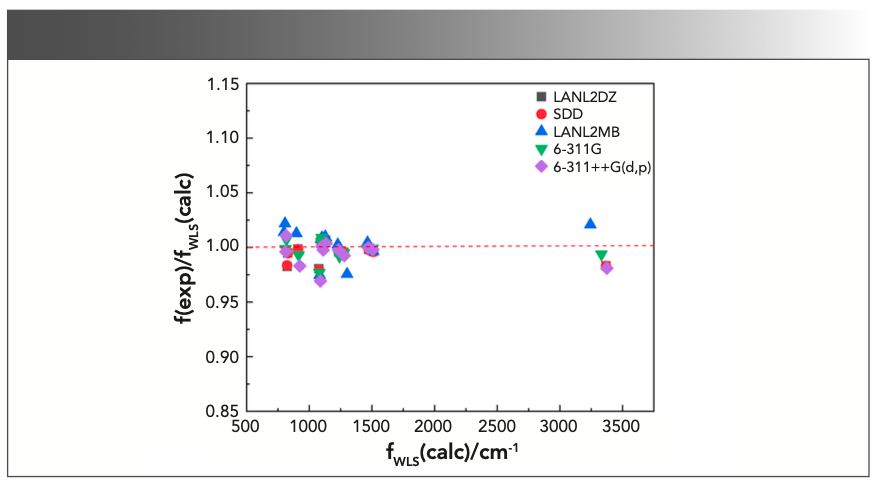
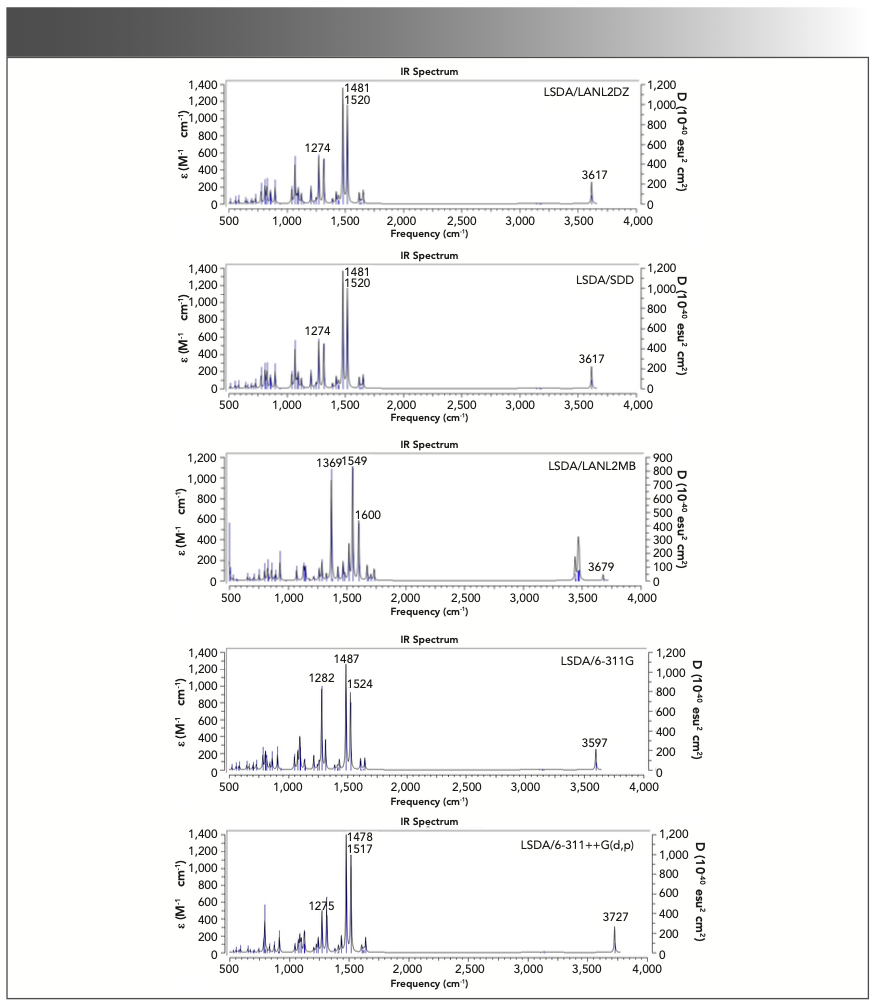
Figure 8 shows the calculated vibrational spectra of triclosan using LSDA at various basis sets. Most of the phenols produced OH stretching vibration mode in the region of 3390 ± 70 cm−1 after a chlorine atom attached to phenol OH (hydroxyl group) (32). In the case of triclosan, the broad IR band observed at 3311 cm−1 is assigned to n(O-H) (hydroxyl group). The calculated vibrational frequencies with LAN-L2DZ, SDD, LANL2MB, 6-311G, and 6-311++G(d,p) were 3617, 3617, 3679, 3597, and 3727 cm-1, respectively. With the application of WLS, the values were 3368, 3368, 3244, 3332, and 3375 cm−1, respectively. The theoretical frequencies calculated by the LSDA/6-311G level matched better with the observed value. For the combination band of C-H in-plane bending and C-C stretching that appeared at 1505 cm-1, the calculated values with LANL2DZ, SDD, LAN-L2MB, 6-311G, and 6-311++G(d,p) were 1511, 1511, 1510, 1506, and 1508 cm−1 (scaled), respectively. In addition, the mean absolute deviations were 11.42, 11.50, 17.58, 8.07, and 12.43 cm−1 for LANL2DZ, SDD, LANL2MB, 6-311G, and 6-311++G(d,p), respectively. The LSDA/6-311G level gave the best performance for predicting the vibrational spectra of triclosan.
FIGURE 8: Theoretical frequencies (no scale) and IR intensities calculated with the LSDA method using LANL2DZ, SDD, LANL2MB, 6-311G, and 6-311++G(d,p) basis sets for triclosan. Note the abscissa (x-axis) is in wavenumbers (cm-1).
Conclusion
In this study, the performances of different DFT methods, including B3LYP, LSDA, PBEPBE, CAM-B3LYP, and M06-2X, with various basis sets for predicting the geometrical and vibrational parameters of triclosan were compared and investigated. Overall, the M06-2X/6-311++G(d,p) level showed optimal performance in predicting the geometric bond lengths and bond angles of triclosan. Furthermore, a comparison between the observed vibrational frequencies and calculated values revealed that LSDA/6-311G was the best theory level to simulate the vibrational spectra of triclosan. This study provided a basis for the investigation of the environmental migration characteristics and toxicological effects of triclosan.
Acknowledgments
This work was supported by the National Natural Science Foundation of China (Grant No. 31900274) and the Science and Technology Program of Wenzhou (S20180013, S20180005).
References
(1) A.B. Dann, and A. Hontela, Appl. Toxicol. 31(4), 285–311 (2011).
(2) M. Adolfsson-Erici, M. Pettersson, J. Parkkonen, and J. Sturve, J. Chemosphere 46, 1485–1489 (2002).
(3) J.L. Pinckney, L. Thompson, and S. Hylton, Mar. Pollut. Bull. 119(1), 162–168 (2017).
(4) A.B. Dann, and A. Hontela, J. Appl. Toxicol. 31(4), 285–311 (2011).
(5) S. Hassen, H. Chebbi, M.F. Zid, and Y. Arfaoui, J. Mol. Struct. 1167, 1–10 (2018).
(6) S.M. Iconomopoulou and G.A. Voyiatzis, J. Contr. Rel. 103, 451–464 (2005).
(7) A.A. Connor, G.A. Chasse, D.H. Setiadi, and I.G. Csizmadia, J. Mol. Struc. 666, 581–586 (2003).
(8) H. Özişik, S.H. Bayari, and S. Sağlam, C. Amer. Inst. Physics 1203, 1227–1232 (2010).
(9) J.N. Latosińska, M.A. Tomczak, and J. Kasprzak, Chem. Phys. Lett. 462(4–6), 284–288 (2009).
(10) M.J. Frisch, G.W. Trucks, H.B. Schlegel, G.E. Scuseria, M.A. Robb, J.R. Cheeseman, G. Scalmani, et al, Gaussian 09W software (Gaussian, Inc., Wallingford, CT, 2009).
(11) A.I. Ramos, S.S. Braga, and F.A. Almeida Paz, J. Acta. Cryst. 65(8), 404–405 (2009).
(12) A.L. Magalhães, and A.S. Soares Pinto, J. Theor. Chem. Acc. 110, 70–78 (2003).
(13) H. Yoshida, A. Ehara, and H. Matsuura, Chem. Phys. Lett. 325(4), 477–483 (2000).
(14) H. Yoshida, K. Takeda, J. Okamura, A. Ehara, and H. Matsuura, Phys. Chem. A 106(14), 3580–3586 (2002).
(15) S.F. Sousa and P.A. Fernandes, Phys. Chem. A 111(42), 10439–10452 (2007).
(16) J.P. Perdew, J.A. Chevary, S.H. Vosko, K.A. Jackson, M.R. Pederson, D.J. Singh, and C. Fiolhais, Phys. Rev. B 46(11), 6671–6687 (1992).
(17) A.D. Becke, Chem. Phys. 84(8), 4524–4529 (1986).
(18) D.C. Langreth and M.J. Mehl, Phys. Rev. B 28(4), 1809–1834 (1983).
(19) S. Kurth, J.P. Perdew, and P. Blaha, Int. J. Quantum Chem. 75(4–5), 889–909 (1999).
(20) K. Helios, R. Wysokiński, A. Pietraszko, and D. Michalska, Vib. Spectrosc. 55(2), 207–215 (2011).
(21) J.D. Gu, J. Wang, and J. Leszczynski, Chem. Phys. Lett. 512(1–3), 108–112 (2011).
(22) U. Yadava, M. Singh, and M. Roychoudhury, Comput. Theor. Chem. 977(1–3), 134–139 (2011).
(23) E.F. Jorge, Z.A. de Oliveira, and P. Thiago Silva, Int. J. Quantum Chem. 116(1), 21–26 (2016).
(24) A.D. Becke, Pys. Rev. A. 38(6), 3098 (1988).
(25) Y. Tawada, T. Tsuneda, S. Yanagisawa, T. Yanai, and K. Hirao, J. Chem. Phys. 120, 8425–8433 (2004).
(26) T. Yanai, D. Tew, and N. Handy, Chem. Phys. Lett. 393(1), 51–57 (2004).
(27) Y. Zhao, N.E. Schultz, and D.G. Truhlar, Chem. Phys. 123(16), 161103 (2005).
(28) Y. Zhao and D.G. Truhlar, J. Theor. Chem. Acc. 120, 215–241 (2008).
(29) A.P. Scott and L.J. Radom, Chem. Phys. 100, 16502–16513 (1996).
(30) M.L. Palafox, Int. J. Quantum Chem. 77, 661–684 (2000).
(31) J. Baker, A. Andrsej, and P. Pulay, J. Phys. Chem. A 102, 1412–1424 (1998).
(32) N.B. Colthup, L.H. Daly, and S.E. Wiberley, J. Chem. Soc. 87(5), 1155–1156 (1990).
Xiaoliang Ji is with the College of Life and Environmental Science at Wenzhou University, in Wenzhou, China. Ji is also with the school of Public Health and Management at Wenzhou Medical University, in Wenzhou, China. Yue Yang is with the College of Life and Environmental Science at Wenzhou University, in Wenzhou, China. Yang is also with the Key Laboratory of Water Environment and Marine Biological Resources Protection of Zhejiang Province, in Wenzhou, China. Direct correspondence to Yue Yang at 20180209@wzu.edu.cn ●

The Future of Neurodegenerative Disease Research and the Role of IR Imaging
May 21st 2025In the final part of this three-part interview, Ayanjeet Ghosh of the University of Alabama and Rohit Bhargava of the University of Illinois Urbana-Champaign talk about the key performance metrics they used to evaluate their model, and what the future of neurodegenerative disease research looks like.
Describing Their Two-Step Neural Model: An Interview with Ayanjeet Ghosh and Rohit Bhargava
May 20th 2025In the second part of this three-part interview, Ayanjeet Ghosh of the University of Alabama and Rohit Bhargava of the University of Illinois Urbana-Champaign discuss how machine learning (ML) is used in data analysis and go into more detail about the model they developed in their study.
AI and Infrared Light Team Up to Advance Soil Carbon Monitoring
May 19th 2025A team of international researchers has developed a faster, more accurate method to analyze soil carbon fractions using mid-infrared spectroscopy and deep learning. Their approach preserves the chemical balance of soil organic carbon components, paving the way for improved climate models and sustainable land management.

.png&w=3840&q=75)

.png&w=3840&q=75)


.png&w=3840&q=75)


.png&w=3840&q=75)


