Detecting Explosives by Portable Raman Analyzers: A Comparison of 785-, 976-, 1064-, and 1550-nm (Retina-Safe) Laser Excitation
A portable Raman analyzer with laser excitation at 1550 nm provides "eye-safe" explosives detection.
Portable Raman analyzers have great potential for identifying explosive materials associated with improvised explosive devices. However, most commercial analyzers employ 785-nm lasers that can generate fluorescence interference, limiting identification capabilities, and possibly cause permanent eye damage because of the use of high powers and open laser beams. Here we compare the Raman spectra obtained for TNT and RDX using 785-, 976-, 1064-, and 1550-nm lasers. The latter is of special interest, as it falls within the retina-safe spectral range.
Close to 50% of all United States casualties in Afghanistan and Iraq are due to improvised explosive devices (IEDs)(1,2). The United States Army has been investigating the use of portable Raman analyzers to potentially identify such devices, as well as the raw materials used to make them. The choice of Raman spectroscopy is primarily due to its ability to identify virtually any chemical based on its unique spectrum, and the fact that the sample can be measured noncontact without preparation using a point-and-shoot probe. The choice of excitation wavelength plays a critical role in obtaining quality spectra. Nearly all portable Raman analyzers employ 785-nm laser excitation, which can generate fluorescence in samples and diminish, even eliminate, identification (3,4). Of specific concern are TNT, a secondary explosive often used in IEDs, and RDX, a primary explosive and major component in C4 and Semtex, both of which exhibit fluoresce in some samples. Furthermore, highly colored glass containers may also generate fluorescence interference. Longer wavelength lasers, such as 1064 nm, can be used to avoid fluorescence (5), but with a concomitant loss of sensitivity, due to the fact that the Raman signal intensity decreases as the wavelength increases to the fourth power (that is, the υ4 dependence of Raman scattering) (6).
In addition to fluorescence interference and sensitivity, eye safety is also a concern, especially since the end-users are not likely to have extensive experience using high powered lasers (for example, 500 mW). Laser wavelengths at 785 and 1064 nm are transmitted through the cornea and focused on the retina, increasing the power density by several orders of magnitude, and even a few milliwatts of power can cause permanent eye damage (7). Furthermore, all of the current commercial portable Raman analyzers use laser powers exceeding the maximum permissible exposure (MPE) limit of 1–5 mW stated by the American National Standards Institute (ANSI) (7), necessitating the use of sample enclosures or laser glasses by all personnel in the vicinity of the measurement.
In an effort to address this latter concern, we have developed a portable Raman spectrometer that employs 1550-nm laser excitation. This wavelength falls within the 1400–2000 nm "eye-safe" range (preferably referred to as retina-safe [7]), so-called because the least amount of damage to the eye occurs in this spectral region (8). In contrast to wavelengths below 1400 nm, the retina-safe wavelengths are not focused by the eye, but are absorbed by the cornea, aqueous and vitreous humor (Figure 1). The cornea can handle a 10-s exposure to 1 W/cm2 of a 1550-nm continuous wave laser for 50% of a population before thermal damage (9). Furthermore, the cornea can repair itself in several days. For the retina-safe region ANSI sets the MPE at one tenth this value, 100 mW/cm2 (7).
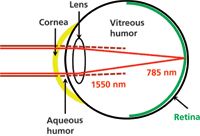
Figure 1: Illustration of the human eye showing the focus of visible radiation on the retina and absorption of 1550 nm radiation by the cornea, aqueous, and vitreous humor. Damage to the retina is permanent, while damage to the cornea is temporary, but should still be avoided.
To our knowledge there has been only one Raman spectroscopy publication using a retina-safe laser (10). This is primarily due the υ4 dependence of Raman scattering. For example, a Raman vibrational mode at 1000 cm-1 will be 21.5 times as intense at 785 nm compared to 1550 nm. In addition, the spectral response of quality detectors is limited to a 0–2000 cm-1 Raman range at this excitation wavelength. Here, the trade-offs in obtaining Raman spectra for TNT and RDX using 785-, 960-, 1064-, and 1550-nm excitation are presented in the context of eye safety.
Experimental
Approximately 0.1 mg each of 2,4,6-trinitrotoluene (TNT) and 1,3,5-trinitro-1,3,5-triazacyclohexane (RDX) were obtained from the United States Army. In all cases the samples, TNT as grains and RDX as a powder, were placed into 2-mL glass vials, which were in turn placed in the Fourier-transform (FT) Raman spectrometer sample compartments for measurements. All four FT-Raman spectrometers used to perform all measurements were designed and built by Real-Time Analyzers (Middletown, Connecticut). The interferometers for all four spectrometers were identical in design and optical components (11,12). A 300-mW 785-nm laser (Process Instruments, Salt Lake City, Utah) was used with a silicon avalanche photodiode detector (PerkinElmer, Stanford, Connecticut), while a 1-W 976-nm laser (in house design), and 1064- and 1550-nm lasers (Keopsys, Lannion, France) were all used with InGaAs detectors (Judson, Montgomeryville, Pennsylvania). The fiber-optics and sample probe optical designs were identical for all systems, except for the Raman line filter used to remove spurious radiation (for example, silicon Raman scattering) and the long pass Raman edge filter used to remove the laser Rayleigh scattering (Semrock, Rochester, New York and Omega Optical, Brattleboro, Vermont). These filters were matched to the appropriate laser wavelength. The probes were mounted under light tight covers to ensure eye safety and eliminate ambient light interference.
Results
The eye safety of the four systems is defined first. According to ANSI the following laser power upper limits must be met to qualify as Class 1 and be considered eye-safe (7): 0.56 mW for 785, ~1 mW for 976, 1.9 mW for 1064 nm, and 9.6 mW for 1550 nm. Of course, virtually all laboratory Raman spectrometers employ enclosures to eliminate potential exposure to the eye, and thereby qualify as Class 1. However, the fiber-optic probes of the systems used in this study could also be handheld without a cover (as they are in many commercial portable Raman analyzers), in which case they would all be Class 3 for laser powers between 10 and 500 mW, and must be considered potentially harmful requiring the use of laser goggles. For open-beam designs, such as handheld probes, ANSI defines a nominal ocular hazard distance (NOHD) for a laser emitting from a focusing lens (7):

where fo is the lens focal length (here the probe lens, 18 mm), bo is the laser beam diameter at the lens (5.4 mm, based on the laser fiber-optic collimator), Φ is the laser power (300 mW for 785 nm and 500 mW for the other three wavelengths) and MPE is the maximum permissible exposure limit for a given wavelength calculated using ANSI tables (Table I). The eye-safe distance is the NOHD plus the lens focal length. Notice that the eye-safe distance is quite far at nearly 2.5 ft for 785-nm laser excitation, compared to only 4 in. for 1550 nm. This suggests that for the former all personnel in the vicinity of an open-beam portable analyzer should be wearing laser safety glasses, whereas only the operator needs safety glasses for the latter. Needless to say, no portable Raman analyzer using an open-beam probe is truly eye-safe, and in the case of the 1550-nm system, damage to the cornea can occur if a person's eye is within the 4-in. distance. It is also worth noting that the MPE for skin is similarly 100 mW/cm2, and the heat of the laser can be readily felt! Finally, only the 785-nm beam is visible to the unaided eye, while the other wavelengths are invisible, offsetting some of the improved safety associated with the longer wavelengths.

Table I: Maximum permissible exposures and nominal ocular hazard distances for the listed excitation wavelengths using 500 mW
The ability to measure the Raman spectra of TNT and RDX is discussed in order of increasing laser excitation wavelength. As previously stated, a number of explosives fluoresce when excited by 785-nm laser excitation (4), which is true for these two explosives. The extent of the fluorescence interference is often dependent on the purity and age of the samples, and in the case of TNT, the fluorescence contribution is less for newly purified TNT than that shown in Figure 2a, but more for older, real-world samples. It is also worth noting that the responsivity of the Si detector drops considerably at about 1950 nm, corresponding to a 2500 cm-1 Raman shift using 785-nm excitation, and consequently the CH vibrational modes are barely discernable. Even though the υ4 dependence of Raman scattering coupled with the increased responsivity for Si versus InGaAs detectors favors this laser wavelength, the primary TNT peaks are only modestly discernable above the fluorescence. Nevertheless, it should be stated that the quality of the spectrum (signal-to-noise ratio, S/N) is quite good for a 10-s acquisition time using 300 mW of laser power. But it must be kept in mind that variations in the amount of fluorescence can challenge even the best spectral search and match software used to identify an unknown. In general the same results are obtained for RDX using 785-nm excitation (Figure 2b); the spectrum contains a substantial amount of fluorescence, but the primary peaks are discernable, and a high quality spectrum is obtained in a short time with modest laser power.
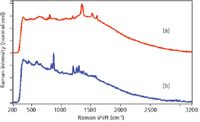
Figure 2: Raman spectra of (a) TNT and (b) RDX measured using 785-nm laser excitation (normalized intensity scale). Conditions: 300 mW, 10 s acquisition time, and 8 cm-1 resolution.
Although the Raman spectra of both explosives do not contain fluorescence using 976-nm laser excitation, a second interferent appears. Two broad features several hundred wavenumbers wide and centered at 500 and 900 cm-1 are attributed to luminescence generated in the glass sample vials (Figure 3). Although the primary RDX peaks are clearly identifiable for these explosives, other explosives (for example, ammonium perchlorate [4]) that only contain unique Raman peaks in this low wavenumber spectral range may be difficult to identify. Additional tradeoffs occur using this excitation wavelength. Because an InGaAs detector is used, the entire spectrum is available for unknown identification using spectral matching, but the overall sensitivity has dropped significantly, and the same quality spectra obtained using 785-nm excitation requires a 1-min acquisition time and 500 mW of laser power.
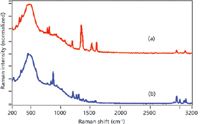
Figure 3: Raman spectra of (a) TNT and (b) RDX measured using 976-nm laser excitation (normalized intensity scale). Conditions: 500 mW, 1-min acquisition time, and 8 cm-1 resolution.
No fluorescence is observed in the Raman spectra of either explosive using 1064-nm excitation (Figure 4). The lack of any spectral interference coupled with the availability of the entire spectrum and a reasonable S/N, even for a 10-s acquisition time, allows for highly successful identification of unknown chemicals using spectral search and match software, as well as discrimination against similar chemicals.
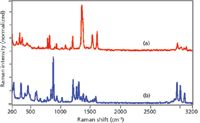
Figure 4: Raman spectra of (a) TNT and (b) RDX measured using 1064-nm laser excitation (normalized intensity scale). Conditions: 500 mW, 10-s acquisition time, and 8 cm-1 resolution.
Excitation using 1550 nm also does not generate fluorescence or glass interference in the Raman spectra for either explosive, but the spectral quality is severely compromised even using 500 mW of laser power and 10-min acquisition times (Figure 5). This is not surprising, since the υ4 dependence of Raman scattering predicts the dominant modes for TNT and RDX, the NO3 symmetric stretch for TNT at 1360 cm-1 and the C-N-C ring stretch for RDX at 885 cm-1, respectively, to be 16% and 18% of their respective intensities using 1550-nm laser excitation compared to 1064-nm excitation. However, the measured peak intensities are only half this intensity. This is attributed to less efficient optics used in the 1550-nm system, and in particular the fiber-optics coupled to the probe (12). The spectral noise is also higher even after the long acquisition time. This is attributed to a higher noise equivalent power for the extended range InGaAs detector. This excitation wavelength also limits the available spectral range, as the responsivity for this detector approaches zero at 2200 nm, which corresponds to a 1900 cm-1 Raman shift, and consequently the CH stretching region is not detected.
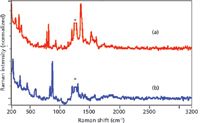
Figure 5: Raman spectra of (a) TNT and (b) RDX measured using 1550-nm laser excitation (normalized intensity scale). Conditions: 500 mW, 10-min acquisition time, and 8 cm-1 resolution. (* indicates laser artifact.)
Conclusion
Here we compared the Raman spectra obtained using 785-, 976-, 1064-, and 1550-nm laser excitation for two important explosives, TNT and RDX. The data suggest that 1064-nm excitation provides the best quality spectra for identifying explosives: no interference, full spectrum, and reasonable S/N in 10 s. We also demonstrated that Raman spectra for these two explosives could be obtained using a 1550-nm laser emitting in the retina-safe region. The primary advantage for performing measurements using this wavelength laser is added eye safety since only temporary damage to the cornea is expected versus permanent damage to the retina at the shorter wavelengths. Another advantage is that the chance of fluorescence interference is extremely remote. However, using this wavelength has several disadvantages. First, the signal intensities are 5–10 times less compared to 1064-nm laser excitation due to the υ4 dependence of Raman scattering and losses in the optics. Second, there is increased noise associated with the extended range InGaAs detector. Third, the spectral region is limited by the InGaAs detector response to below ~2000 cm-1. In spite of these deficiencies, identification of explosives may be possible if high laser powers and long acquisition times are acceptable.
Acknowledgments
The authors are grateful for funding from the United States Army and the United Kingdom Ministry of Defence.
References
(1) C. Wilson, Congress. Res Ser., RS 22330 (2007).
(2) W. Pincus, Washington Post, September 25, 2010.
(3) I.R. Lewis, N.W. Daniel, Jr., N.C. Chaffin, P.R. Griffiths, and M.W. Tungol, Spectrochem. Acta, A 51, 1985 (1995).
(4) R.L. Green, M.D. Hargreaves, and C.D. Brown, Homeland Security supplement to Spectroscopy 25(4), 14 (2010).
(5) I.R. Lewis, N.W. Daniel, Jr., and P.R. Griffiths, Appl. Spectrosc. 51, 1854 (1997).
(6) D.B. Chase and J.F. Rabolt, Eds. Fourier Transform Raman Spectroscopy (Academic Press, San Diego, California, 1994).
(7) American National Standards Institute, ANSI Z 136.1 -2007, Laser Institute of America, Orlando, FL (2007).
(8) J.R. Thornton, Laser Focus 5, 38 (1969).
(9) J.L. Lambert, C.C. Pelletier, and M. Borchert, J. Biomed. Opt. 10, 031110-1 (2005).
(10) K.A. Lynn, G. McNay, D.A. Eustace, N.C. Shand, and W.E. Smith, Analyst 10.1039/c0an00096e (2010).
(11) W. Smith, and S. Farquharson, SPIE 6377, 63770E (2006).
(12) C. Brouillette, H. Huang, W. Smith, and S. Farquharson, Appl. Spec., submitted Jan 2011.
Michael Donahue, Hermes Huang, Carl Brouillette, Wayne Smith, and Stuart Farquharson are with Real-Time Analyzers, Inc., Middletown, Connecticut.

AI-Powered SERS Spectroscopy Breakthrough Boosts Safety of Medicinal Food Products
April 16th 2025A new deep learning-enhanced spectroscopic platform—SERSome—developed by researchers in China and Finland, identifies medicinal and edible homologs (MEHs) with 98% accuracy. This innovation could revolutionize safety and quality control in the growing MEH market.
New Raman Spectroscopy Method Enhances Real-Time Monitoring Across Fermentation Processes
April 15th 2025Researchers at Delft University of Technology have developed a novel method using single compound spectra to enhance the transferability and accuracy of Raman spectroscopy models for real-time fermentation monitoring.
Nanometer-Scale Studies Using Tip Enhanced Raman Spectroscopy
February 8th 2013Volker Deckert, the winner of the 2013 Charles Mann Award, is advancing the use of tip enhanced Raman spectroscopy (TERS) to push the lateral resolution of vibrational spectroscopy well below the Abbe limit, to achieve single-molecule sensitivity. Because the tip can be moved with sub-nanometer precision, structural information with unmatched spatial resolution can be achieved without the need of specific labels.