Detection of Melamine and Other Harmful Food Contaminants Using Gold Nanoparticles, Surface-Enhanced Raman Scattering, and Raster Orbital Scanning
Special Issues
Melamine is a dangerous substance when it is used to increase the apparent protein content of food. In this article, the use of novel gold nanoparticles for surface-enhanced Raman spectroscopy (SERS) measurements with raster orbital scanning sampling is described for the detection of melamine and other food contaminants.
Melamine is a dangerous substance when it is used to increase the apparent protein content of food. In this article, the use of novel gold nanoparticles for surface-enhanced Raman spectroscopy (SERS) measurements with raster orbital scanning sampling is described for the detection of melamine and other food contaminants. Although silver nanoparticles are often used for melamine SERS measurements, gold nanoparticles are more stable with less stringent requirements for storage and handling. Gold SERS substrates can also be used for the detection of other harmful food additives and adulterants, including antifungal dyes, antibiotics, and pesticides.
Food safety is a global concern that has spawned rigorous guidelines and numerous regulatory agencies to protect consumers from both harm and fraud (1). Widespread illness and even death have resulted from the adulteration of food with compounds like melamine, which are added to ensure substandard foods meet dietary guidelines. Trace contaminants and residues from pesticides and antifungal agents used in the growth, processing, and storage of food products have been shown to be toxic to humans with impacts ranging from digestive problems to death. Counterfeit food products deceive consumers, risking their health while emptying their wallets. It is these ongoing deceptive and dangerous practices and the widespread illness and economic impact they have caused that have driven the establishment of strict food safety regulations and the need for careful food inspection.
Consumers rely on government scrutiny and oversight for protection from dangerous food additives and contaminants. The use of melamine and its derivative, cyanuric acid, have invited scrutiny and inspired tighter regulation of fungicides, pesticides, and antibiotics used for crop protection. The antifungal agents crystal violet and malachite green are inexpensive and effective against fungal and parasite infections in fish, but are not approved for use in aquaculture because of their mutagenic impact on humans. The fungicide thiram is used to protect crops from deterioration both before and after harvest, but has high enough toxicity that it requires protective clothing for handling. The broad-spectrum antibiotic chloramphenicol is banned for food use and is tightly regulated to avoid toxicity and the potential for the creation of antibiotic-resistant bacteria. These compounds and many others have documented health and safety concerns requiring regulation and inspection of food products.
With the potential for serious health and economic effects, there is a need for a rapid, low cost, and sensitive technique to detect and identify harmful food contaminants. Although there are a variety of methods and techniques now available for the identification and quantification of these potentially harmful compounds, these techniques (high performance liquid chromatography–mass spectrometry [HPLC–MS], gas chromatography–mass spectrometry [GC–MS], and ion-mobility spectrometry [IMS]) are often expensive, time- and labor-intensive measurements requiring significant sample preparation and highly trained personnel to administer. For a viable, commercial application, a method is needed that requires little to no sample preparation, is applicable to a range of food contaminants, and can provide fast, accurate identification and quantification. Surface-enhanced Raman spectroscopy (SERS) meets these requirements and is a good option for the detection of food contaminants and additives.
Raman spectroscopy is a high-resolution, vibrational spectroscopic technique in which each molecule produces a unique spectral "fingerprint" that can be used to identify and differentiate it from other sample components. Recent advances in lasers, detectors, and optical filter technologies have lowered costs and enabled considerable downsizing of Raman instrumentation such that the technology is more accessible and field deployment is now feasible. As a detection technology, Raman spectroscopy (2) has gained increasing interest because the Raman band frequencies relate to chemical bonding in the compound to be identified. This chemical specificity gives detection by Raman spectroscopy a distinct advantage. Different compounds have unique Raman fingerprints that can be used to identify them.
The major drawback of Raman spectroscopy is the low cross-section (2) of the spontaneous Raman scattering, which affects the detection of substances at trace level. This small scattering cross-section results in lower Raman signals and makes detection and identification difficult for compounds like food contaminants and additives that are present at low concentrations. In 1977, a technique to overcome this limitation was demonstrated when the compound of interest was placed on a roughened noble-metal substrate. The result was a significant enhancement in the magnitude of the Raman scattering signal (3). This process is known as surface-enhanced Raman scattering (4,5).
The enhanced sensitivity achievable with SERS makes it a viable option for the detection of food contaminants often present at trace levels. SERS is a variation of conventional Raman spectroscopy whereby analytes are adsorbed onto a noble metal (typically gold or silver) covered surface before analysis. Through a combination of chemical and electromagnetic effects, the Raman signal intensity is significantly "enhanced" when measured from SERS substrates fabricated from these noble metals. In very specific cases, detection at the single-molecule level has even been demonstrated (6,7). The combination of signal enhancement and chemical specificity make SERS a good candidate for the sensitive and selective identification of compounds including harmful food contaminants and additives (8,9).
Since the early days of SERS, gold (Au) and silver (Ag) have been widely used as SERS substrates because of their strong SERS activity (10). The use of these metals has advanced with the development of nanoscience and nanotechnology, which give researchers the ability to control the shape, size, and composition of silver and gold nanoparticles. As a result, silver and gold are the most widely used SERS substrates. Theoretical calculations indicate that the Raman enhancement of a single gold nanoparticle is about 103 –104 with enhancement for a single silver nanoparticle as high as 106 –107 (11).
In this paper, we describe the novel combination of gold substrates and raster orbital scanning (ROS) for the detection of melamine and other harmful food additives and contaminants. Data illustrating the increased stability of the gold substrates relative to silver substrates are shown along with the enhancement in signal achieved with ROS sampling versus traditional Raman sampling. The broad applicability of the gold SERS substrates is also shown for several other food contaminants.
Although melamine is typically detected using silver SERS substrates with 532-nm laser excitation, we used gold substrates with 785-nm laser excitation for our measurements. Although melamine binds well to silver, one of the limitations of the silver substrates is a shorter lifetime, requiring modified atmospheric packing of the substrates and special storage and handling conditions (12,13). Gold, on the other hand, ages much more slowly with better stability than silver (14,15). This increased stability and longer lifetime are why we used gold substrates even though melamine binds better to silver. Gold also has the added benefit of working with a broader range of harmful food additives and contaminants.
When the more stable gold SERS substrates are combined with an ROS Raman sampling technique, the result is a rapid, sensitive method for detecting several regulated or banned food additives and contaminants. ROS combines the resolution and power achieved with a tightly focused laser spot with the sensitivity of sampling over a large sample area. By rastering the laser spot over a large sample area, there is a higher probability of measuring spectra from SERS hotspots (localized regions of Raman signal enhancement) dispersed on the substrate. This results in higher sensitivity than with traditional Raman sampling where the laser is focused on a single location on the substrate. This is especially important with SERS substrates, in which the density and coverage of nanoparticles on the substrate can vary from location to location. Not only does ROS overcome this challenge of working with SERS substrates, it also provides a lower average laser power at the substrate and reduces the possibility for substrate or sample damage during exposure to the tightly focused laser.
Experimental
Silver and gold nanoparticles were inkjet printed on cellulose substrates. For substrate aging studies, melamine was tested on the day of printing and up to one week after printing. Measurements were made by drop casting 12 µL of the compounds suspended in various solvents to the printed SERS substrates mounted on standard glass microscope slides.
The substrates were interrogated with either an IDRaman reader integrated Raman system from Ocean Optics with 785-nm laser excitation and ROS sampling (IDRaman reader) or with a modular Raman system from Ocean Optics comprising a QE Pro spectrometer configured for 785-nm Raman measurements (QE Pro Raman), a 785-nm laser for excitation (LASER-785), and a Raman probe for detection (RIP-RPB-785). Typical acquisition parameters were three scans to average and a 1-s integration time. Data were acquired using OceanView software (Ocean Optics).
In all the plots presented, the spectra were adjusted for an appropriate baseline to enable comparison of peak height values. A Raman-inactive area of the spectrum was determined for each analyte, and the average value across that region was subtracted from the rest of the spectrum. This achieves a baseline correction that accounts for the noise seen in the raw spectrum. The spectra reported are raw spectra that have been baseline corrected.
The observed shifts in the assigned peaks for the analytes could result from a variety of factors. It is known that differences in solvents and, more importantly, physical features in SERS substrates will cause the observed peaks to change. These changes explain any variation in peak assignment when compared to reference literature.
Results and Discussion
Impact of Substrate Aging
To demonstrate the impact of substrate aging on the SERS detection of melamine, silver and gold nanoparticles were inkjet printed on cellulose substrates. Melamine at 1 × 10⁻² M concentration in water was drop casted to the substrates and Raman spectra were measured on the day of printing and 24 h after printing.
The Raman spectra measured with the modular Raman system using traditional Raman sampling for melamine on a silver substrate are shown in Figure 1. Note the characteristic peak for melamine near 700 cm-1 in the spectrum measured just after the substrate was printed (day 0). Deterioration of the silver substrate is observed by the loss of this peak in the Raman spectrum measured 24 h after the substrate was printed (day 1). The silver substrate degraded significantly within 24 h of printing, resulting in an inability to detect melamine with this aged substrate.
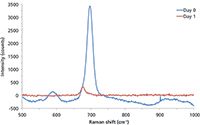
Figure 1: Aging of inkjet-printed silver SERS substrates 24 h after printing: Raman spectra for 1 Ã 10-2 M melamine in water measured using traditional Raman sampling.
When a gold substrate is used to measure the same melamine solution, the improvement in stability is dramatic. As shown in Figure 2, the characteristic melamine peak is still observed one week after the gold substrate was printed. Additional studies (data not shown) have demonstrated even longer stability with measurements made with gold substrates more than 60 days after printing. This increased stability makes gold substrates easier to work with than silver substrates and more suitable for use in a commercial application.
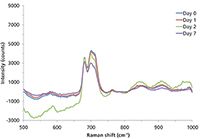
Figure 2: Improved substrate stability with inkjet-printed gold SERS substrates one week after printing: Raman spectra for 1 Ã 10-2 M melamine in water measured using traditional Raman sampling.
The improvement in the SERS measurements for melamine is even better when the excellent stability of the gold substrates is combined with the ROS sampling technique. When the relative intensity of the Raman peaks for melamine in Figure 2 is compared to the relative intensity of the melamine peaks in Figure 3, the signal measured with ROS sampling (Figure 3) is almost two times the relative intensity of the signal measured with traditional Raman sampling (Figure 2). This increase in Raman intensity measured using ROS sampling clearly demonstrates the dramatic improvement in sensitivity achieved with ROS when a larger area of the SERS substrate is sampled. By sampling a larger surface area, more Raman hotspots are measured leading to improved sensitivity and the possibility to detect even lower concentrations of melamine or other food contaminants and additives.
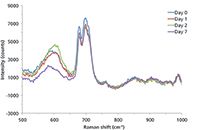
Figure 3: Improvement in Raman signal with ROS sampling of inkjet-printed gold SERS substrates: Raman spectra for 1 Ã 10-2 M melamine in water measured using ROS sampling.
Detection of Other Compounds of Food Safety Concern
As demonstrated in Figures 4–7, in addition to their stability, another advantage of gold substrates is that they can be used for the detection and discrimination of a wide range of potentially harmful food contaminants and additives. The Raman spectrum for the fungicide thiram is shown in Figure 4. The sample was prepared by drop casting a solution containing 1 × 10⁻³ M thiram in acetone to the gold substrate. This toxic fungicide is used to prevent crop damage before and after crop harvest. The toxicity of this fungicide is high enough that it requires protective clothing for handling. As shown in Figure 4, gold SERS substrates and ROS sampling has sufficient sensitivity to detect relatively low levels of this toxic fungicide.
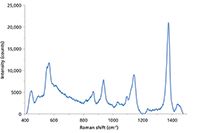
Figure 4: The fungicide thiram on gold SERS: Raman spectrum for 1 Ã 10-3 M thiram in acetone measured using ROS sampling.
Chloramphenicol is a broad-spectrum antibiotic used in aquaculture. It has been banned for food use and is tightly regulated to avoid toxicity and the potential for the creation of antibiotic-resistant bacteria. As shown in Figure 5, SERS with a gold substrate and ROS sampling enables detection of 1 × 10⁻³ M concentrations in ethanol of this banned food contaminant.
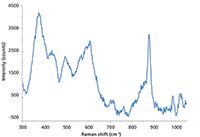
Figure 5: The antibiotic chloramphenicol on gold SERS: Raman spectrum for 1 Ã 10-3 M chloramphenicol in ethanol measured using ROS sampling.
In Figures 6 and 7, Raman spectra for the fungicides crystal violet and malachite green are shown. These fungicides are also banned for use in aquaculture because of their toxicity. These antifungal agents are low cost and very effective against fungal and parasite infections in fish, but they are not approved for use in aquaculture because of their potential for mutagenic impact on humans. A comparison of these spectra demonstrates not only the sensitivity of the technique, but also the specificity of Raman analysis. Each fungicide has a distinct spectral fingerprint allowing for discrimination and identification. As shown in Figures 6 and 7, both fungicides are easily detected at 1 × 10⁻⁴ M concentrations in ethanol with SERS using gold substrates and ROS sampling.
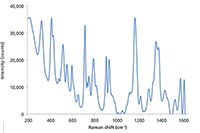
Figure 6: The fungicide crystal violet on gold SERS: Raman spectrum for 1 Ã 10-4 M crystal violet in ethanol measured using ROS sampling.
Conclusion
Food safety is a global concern. Outbreaks and even death have driven the search for improved technologies to detect very low levels of food contaminants. The tremendous signal enhancement associated with SERS, combined with ROS sampling of highly stable gold substrates, make SERS a good candidate for the detection of trace levels of food additives and contaminants. With recent advances in handheld Raman instrumentation including the availability of handheld devices with ROS sampling, SERS is a viable option for the fast, low cost, and sensitive detection of these dangerous compounds outside the laboratory setting.
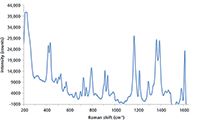
Figure 7: The fungicide malachite green on gold SERS: Raman spectrum for 1 Ã 10-4 M malachite green in ethanol measured using ROS sampling.
Yvette Mattley, PhD, Maja Sourdaine, Derek Guenther, Cleo Harvey, and Adrian Guckian, PhD, are with Ocean Optics in Dunedin, Florida. Direct correspondence to: Yvette.Mattley@OceanOptics.com
References
(1) K.R. Matthews, in Practical Food Safety: Contemporary Issues and Future Directions, R. Bhat and V. Gomez-Lopez, Eds. (John Wiley and Sons, Hoboken, New Jersey, 2014), pp. 1–9.
(2) D.J. Gardiner, in Practical Raman Spectroscopy, D.J. Gardiner and P. R. Graves, Eds. (Springer-Verlag, Berlin, Germany 1989), pp. 1–12.
(3) D.L. Jeanmarie and R.P. Van Duyne, J. Electroanal. Chem. 84, 1–20 (1977).
(4) M. Fleischmann, P.J. Hendra, and A.J. McQuillan, Chem. Phys. Lett. 26(2), 163–166 (1974).
(5) R.A. Alvarez-Puebla, D.S. Dos Santos Jr., and R.F. Aroca, Analyst 129, 1251–1256 (2004).
(6) W.E. Doering and S.M. Nie, J. Phys. Chem. B 106, 311–317 (2002).
(7) K. Kneipp and H. Kneipp, Appl. Spectrosc. 60(12), 322A–334A (2006).
(8) A.P. Craig, A.S. Franca, and J. Irudayaraj, Ann. Rev. Food Sci. Technol. 4, 369–380 (2013).
(9) J. Zheng and L. He, Comp. Rev. Food Sci. Food Safety 13, 317–329 (2014).
(10) J.A. Creighton, C.G. Blatchford, and M.G. Albrecht, J. Chem. Soc. Faraday Trans. 75, 790–798 (1979).
(11) D.S. Wang, H. Chew, and M. Kerker, Appl. Opt. 19, 2256–2257 (1980).
(12) N.L. Rosi and C.A. Mirkin, Chem. Rev. 105, 1547–1562 (2005).
(13) M.D. McMahon, R. Lopez, H.M. Meyer, III, L.C.R.F. Feldman, and J.R. Haglund, Appl. Phys. B 80, 915–921 (2005).
(14) P. Gao and M.J. Weaver, J. Phys. Chem. 89, 5040–5046 (1985).
(15) P. Gao, D. Gosztola, L.W.H. Leung, and M.J. Weaver, J. Electroanal. Chem. 233, 211–222 (1987).

AI-Powered SERS Spectroscopy Breakthrough Boosts Safety of Medicinal Food Products
April 16th 2025A new deep learning-enhanced spectroscopic platform—SERSome—developed by researchers in China and Finland, identifies medicinal and edible homologs (MEHs) with 98% accuracy. This innovation could revolutionize safety and quality control in the growing MEH market.
New Raman Spectroscopy Method Enhances Real-Time Monitoring Across Fermentation Processes
April 15th 2025Researchers at Delft University of Technology have developed a novel method using single compound spectra to enhance the transferability and accuracy of Raman spectroscopy models for real-time fermentation monitoring.
Nanometer-Scale Studies Using Tip Enhanced Raman Spectroscopy
February 8th 2013Volker Deckert, the winner of the 2013 Charles Mann Award, is advancing the use of tip enhanced Raman spectroscopy (TERS) to push the lateral resolution of vibrational spectroscopy well below the Abbe limit, to achieve single-molecule sensitivity. Because the tip can be moved with sub-nanometer precision, structural information with unmatched spatial resolution can be achieved without the need of specific labels.