Geographical Traceability of Millet by Mid-Infrared Spectroscopy and Feature Extraction
To identify the geographical origin of millet accurately, 36 samples of Guangling millet, Qinzhouhuang millet, Liuseng millet, Qiananhuang millet, and 33 samples of Yuzhou millet were collected. Mid-infrared (mid-IR) spectra of all the samples were obtained. Denoising, standard normal variate (SNV), multiplicative scatter correction (MSC), and normalization were carried out to preprocess the data. Principal component analysis (PCA) was used to reduce the dimension of the data, combined with support vector machine (SVM), and the geographical origin of the five kinds of millet was identified. The recognition accuracy of the training set (99.2%) and the prediction set (98.3%) were highest when using the first 12 principal components, indicating that the established mid-IR spectroscopic identification model was feasible and effective. PCA, window analysis, hierarchical clustering analysis, and SVM were combined to extract the feature information of mid-IR spectra of millet from five producing areas. Five wavenumbers, 1026, 1053, 1685, 1715, and 1744 cm-1, were found to be with small correlation, and the recognition accuracy of the training set and the prediction set based on these five features were 95.8% and 100.0%, respectively. The feature extraction method established here could be used to improve the prediction efficiency of the identification model and provide data support for the analysis of differential components.
Millet is the husked seed of foxtail millet, belonging to Setaria of Gramineae (1). Millet is drought-resistant and widely grown in North China, accounting for 80% of the world’s total output (2). Millet is rich in nutrients, such as carbohydrate, fat and fatty acids, proteins, amino acids, vitamins, minerals, and so on (3,4). It can not only be used as a staple food, but also to make wine and maltose. Meanwhile, it also has the effect of invigorating the spleen, nourishing the stomach, and helping with sleep (5,6). The quality of millet is closely related to its geographical origin (7). There are many famous millet products in China, among which Jin millet from Mamiao Town, Jinxiang County, Jining City, Shandong Province, Qinzhouhuang millet from Qinzhou County, Shanxi Province, Longshan millet from Zhangqiu County, Jinan City, Shandong Province, and Taohua millet from Yuxian County, Hebei Province are the four famous millet varieties in China. Because of their good color, nice taste and excellent quality, they are deeply loved by consumers. Due to the low yield and high price of high-quality millet, some manufacturers sell fake product to earn fabulous profits. Fake products not only damage the interests of consumers and some enterprises, but also increase the difficulty of food safety management. Therefore, there is an urgent need for technology meant to identify the geographical origin of millet.
The research of food origin traceability technology mainly explores the specific indicators of food from different regions (8), including isotope fingerprint technology (9,10), mineral element fingerprint technology (11,12), and organic component fingerprint technology (13,14), among others. Traditional methods for millet identification mainly rely on human senses, which have shortcomings like strong subjectivity and inconsistent standards. Modern analytical technologies, including hyperspectral (15), Raman spectroscopy (16), and near-infrared (NIR) spectroscopy (17), are used to identify the origin of millet. Among them, NIR spectroscopy has the characteristics of fast-detection, simple-operation, high-efficiency, and non-destructive testing. The near-infrared spectrum mainly contains the information of hydrogen-containing groups, including C-H, O-H, S-H, N-H, and more. It also shows the information of other groups, such as C=C and C=O. The rich information of the spectrum enables NIR spectroscopy to measure the chemical composition and analyze the physical properties (18). As a result, NIR spectroscopy is widely used in the field of millet origin tracing.
Since fundamental frequency absorption bands of most organic and inorganic substances exist in the mid-infrared (mid-IR) region, the mid-IR region is widely used to study the structure of substances (19). Compared with the NIR spectrum, the spectral bands in the mid-IR spectrum are generally sharper, with better resolution and higher band values. The upgraded mid-IR spectrometers on the market are not required to prepare samples in advance, which saves a lot of test time. Therefore, mid-IR spectroscopy is an ideal means of rapid detection technology. Due to differences in the growing environment of crops, their chemical composition and structures are different, which can be revealed through the mid-IR spectra (20). Currently, the research of mid-IR spectroscopy in some areas, such as the tissue structure and quality evaluation of millet, has achieved great results (21,22), but there are few studies about mid-IR spectroscopy on the identification of millet’s origin. Zhao et al. have studied the structures of five kinds of millet using mid-IR spectroscopy, and found that the corresponding synchronous two-dimensional correlation mid-IR spectra have some differences, which can identify the five kinds of millet (23). However, the amount of each kind of millet in this study is so small, and quality fluctuations between samples are not taken into consideration, so the identification accuracy of this method for large samples is unknown.
Therefore, this work intends to use 177 millet samples from five main producing origins as the research object. Mid-IR spectroscopy combined with chemometrics are applied to establish a model for discrimination of millet’s origin. In addition, the characteristic information to distinguish the five kinds of millet will be mined.
Materials
Five kinds of millet collected were all japonica millet, which were Yuzhou millet (YZ) in Yuxian County, Hebei Province, Qinzhouhuang millet (QZH) in Qinxian County, Shanxi Province, Qiananhuang millet (QAH) in Qianan County, Jilin Province, Guangling millet (GL) in Guangling County, Shanxi Province, and Liuseng millet (LS) in Aohan County, Chifeng City, Inner Mongolia. The millet was planted in 2019. To ensure the representativeness of samples, samples of YZ, QZH, QAH, GL and LS were collected at 33, 36, 36, 36, and 36 sites in their growing areas, respectively. Approximately 1 kg of millet was collected at each sampling site.
Instruments and Equipment
A NA-JCB rice milling machine was purchased from Ningbo Kemai Instrument Co., Ltd. A JYS-M01 grinding machine was purchased from Joyoung Co., Ltd. A Nicolet IS-10 Fourier transform infrared spectrometer was produced by Thermo Fisher Scientific. A JA1003 electronic analytical balance was made in Shanghai Lichen Instrument Technology Co., Ltd.
Methods
Sample Preparation
The millet was dried, threshed, selected, and milled. Each millet was milled three times. 100 g of processed millet was added into the grinder and pulverized for 1.5 min. The resulting millet powder was stored in a freezer. Samples should be balanced to room temperature in a dryer before use.
Spectrum Collection
The parameters for the mid-IR spectrum acquisition were as follows. The spectrometer operated from 525 to 4000 cm-1 with an increment of 0.4821 cm-1, and each sample was scanned 32 times. An appropriate amount of millet flour was covered on the testing window and was subsequently compacted for testing. All the samples were analyzed in triplicate. The final data obtained for each sample was the average of the triplicates. The total test time for a sample was about 2.5 min.
Data Analysis
To remove interfering and irrelevant information from the original spectral data, some preprocess should be done before data analysis. Mid-IR spectra were firstly denoised by wden denoising function (24). The wden (X, TPTR, SORH, SCAL, N, ‘wname’) function transformed the input signal X into the denoised signal. After optimization, the best parameters of the function were TPTR = ’rigrsure’, SORH = ’s’, SCAL = ’MLN‘, N = 5, ‘wname’ = ’sym5’. Secondly, both the standard normal variate (SNV) (25) and multiplicative scatter correction (MSC) function (26) were used to eliminate the influence of scattering on the spectra, and the map/min/max function (27) was used to normalize the data. Thirdly, the scientists identified the geographical origin of millet based on the combination of principal component analysis (PCA) (28) and support vector machine (SVM) (29). Two-thirds of the data for each kind of millet were selected as the training set, and one-thirds of the data was selected as the prediction set. The training set was used to construct the model, and the prediction set was used to evaluate the model. The radial basis function (RBF) (30) was used in SVM modeling. Parameters Gamma and C were optimized by grid-search method. The recognition accuracy was used to evaluate the model. Finally, the combined methods of PCA, window analysis (31) and hierarchical clustering analysis (HCA) (32,33) were used to extract the features of the mid-IR spectra. All data preprocessing and model construction were based on Matlab 2019b.
Results and Discussion
Spectrum Analysis
Taking one mid-IR spectrum of each kind of millet as examples, the spectra were pretreated by denoising, SNV, MSC, and normalization, as shown in Figure 1. The information of functional groups represented by some bands was shown in reference (34). In general, the spectra of the five kinds of millet were highly similar. The strong absorption bands were mainly located at 758, 859, 928, 997, 1077, 1149, 1240, 1338, 1419, 1537, 1645, 1744, 2855, 2925, and 3287 cm-1. The transmittance of YZ located in the region of 525–600 cm-1 was stronger than those of other millet, suggesting that YZ had less absorption in this region. The spectrum of QAH in the region of 2750–3000 cm-1 was slightly different from those of other millet. According to reference (34), millet from different origins differed in the content of protein, fat, and carbohydrates.


Figure 1: Mid-IR spectra of five kinds of millet after data preprocessing.

Principal Component Analysis of Mid-IR Spectra
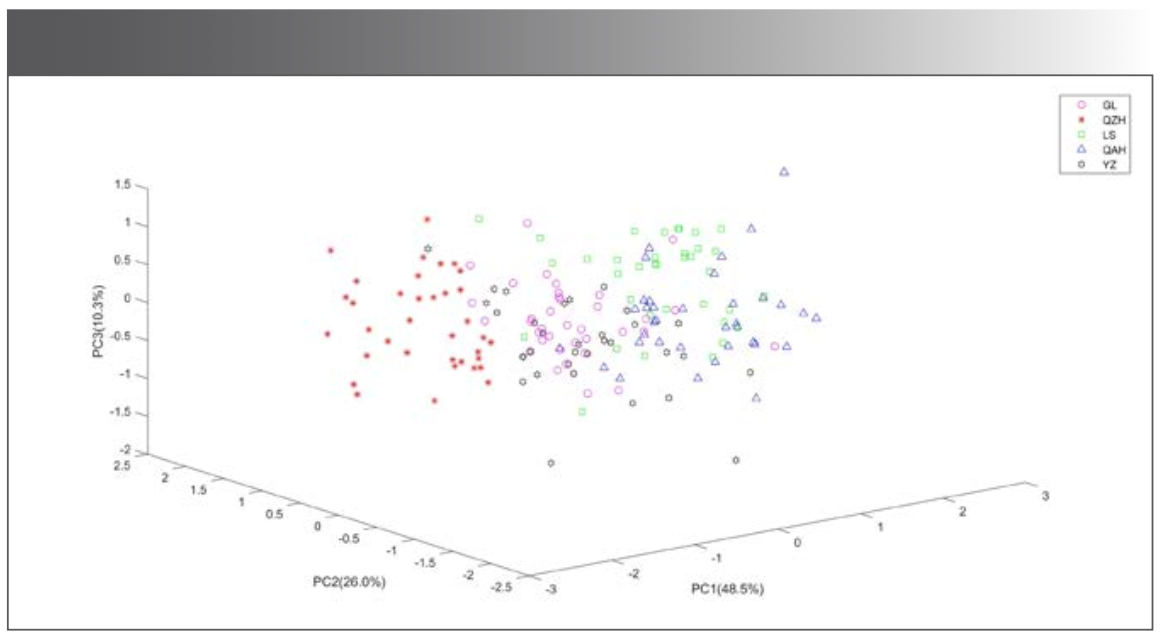
The transmittance values corresponding to each wavenumber in the spectra were taken as variables. The data of 177 mid-IR spectra of the five kinds of millet were listed as matrix X (177 × 7209). 177 was the number of samples, and 7209 was the number of variables. Since the number of variables was much larger than the number of samples, it was easy to cause the over-fitting problem. Taking into account the relevant variables that could influence the efficiency of the model, the principal component analysis (PCA) can extract the main information of the data, so PCA of matrix X was carried out before modeling, as shown in Figure 2. The accumulated contribution rate of the first 3 principal components (PCs) was 84.9%, while that of the first 12 PCs was 98.3%. The distribution of the five kinds of millet in the space composed by the first 3 PCs was shown in Figure 3. QZH could be well-distinguished from other millet. The sample clusters of GL and YZ overlapped seriously. Some of the LS and QAH samples mixed together. The millet could not be identified accurately by PCA.


Figure 2: The contribution rate and accumulated contribution rate of the PCs.
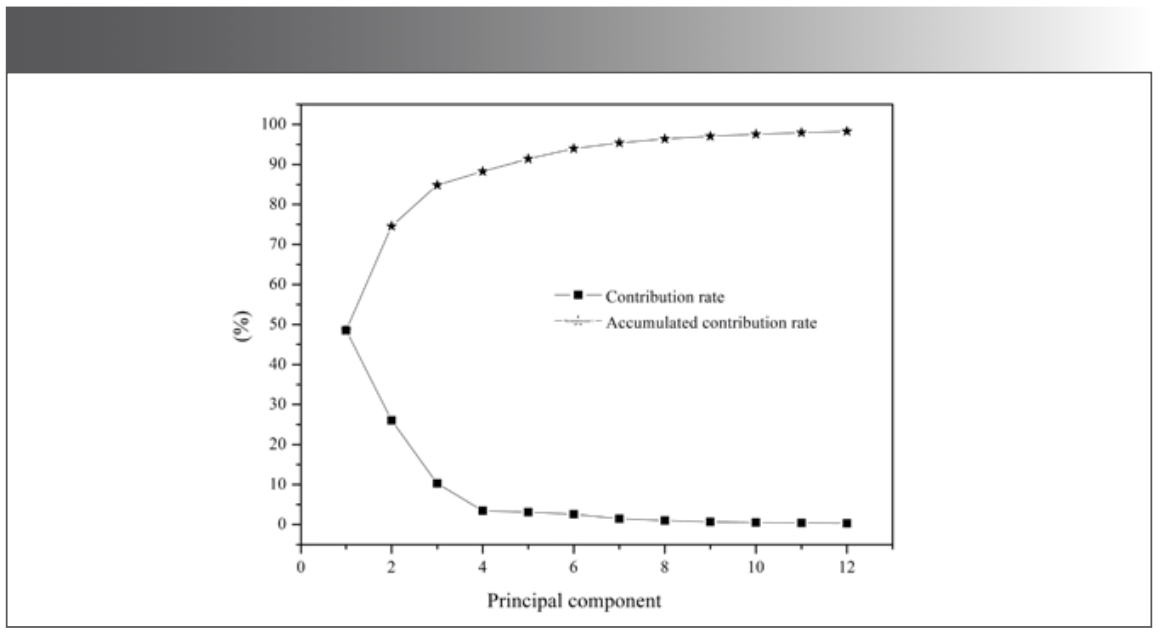


Figure 3: The distribution of millet samples in the space composed by the first 3 PCs.
Discrimination of Millet According to Geographical Origin
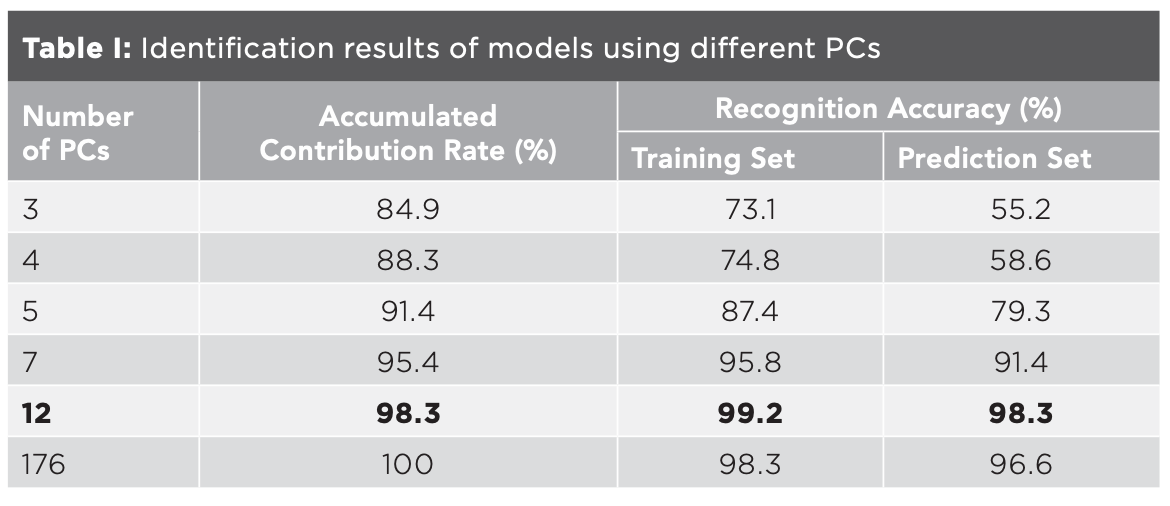
PCA was carried out on matrix X, and different PCs with accumulated contribution rates of 85%, 88%, 90%, 95%, 98%, and 100% were used to build the identification model, respectively. Taking the first 12 PCs as an example, the data corresponding to the first 12 PCs were taken as the independent variables, and the classification of origin was taken as the dependent variable. Thus, matrix Y (177×12) and matrix Z (177×1) were formed. Two-thirds of the samples were taken as the training set, one-thirds of the samples as the prediction set, and SVM was used to judge the category of the samples. The results were shown in Table I. The recognition accuracy of the prediction set of the model built by the first 3 PCs was only 55.2%, which was consistent with the results in Figure 3. With the increase of the number of PCs, the recognition accuracy increased. When the number of PCs was 12, the recognition accuracy of prediction set was the highest at 98.3%. The accuracy of the model using 176 PCs was lower than the model using 12 PCs, indicating that some useless data would interfere with the model. Since the accumulated contribution rate of the first 12 PCs had reached 98%, these 12 PCs could basically represent the information of the whole data, and the model established by the 12 PCs was the optimal model for identifying the geographical origin of millet. In this model, one sample of LS was mistaken for GL. As shown in Figure 3, some LS samples were scattered in the cluster of GL samples, which were easy to be misjudged.


Feature Extraction Analysis
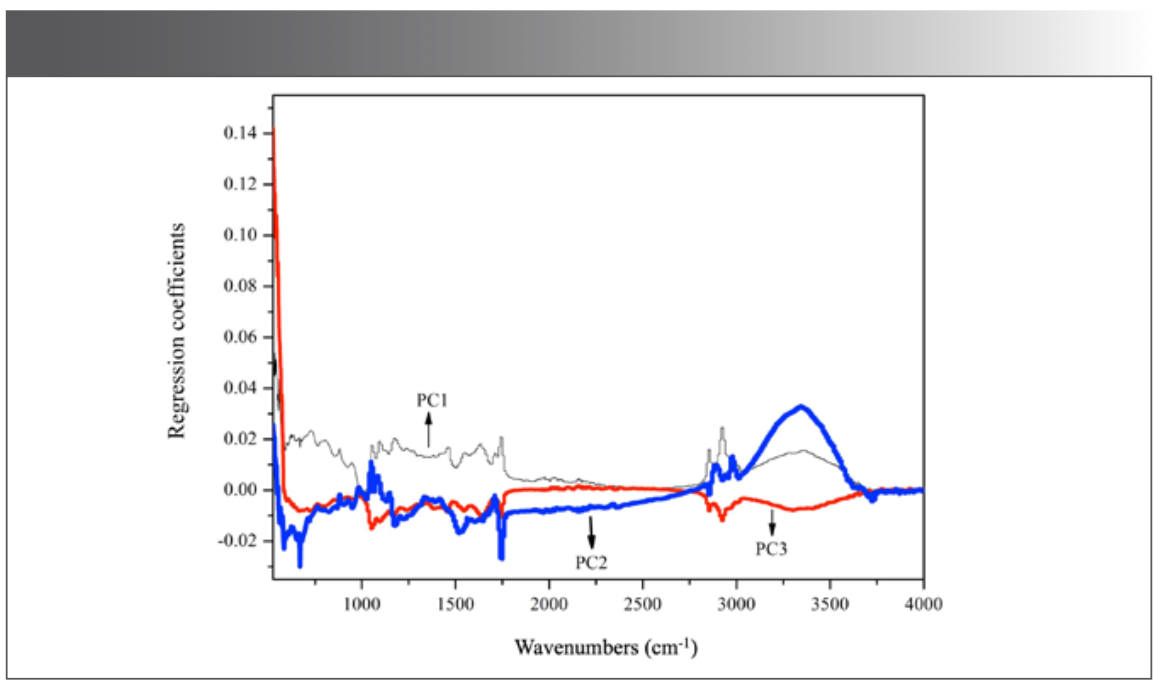
PCA, window analysis, and HCA were used sequentially to extract the characteristic information of different kinds of millet. Through PCA, 176 PCs were obtained, representing the whole information of 177 mid-IR spectra. The main characteristic bands of the five geographical origins of millet were obtained according to the loadings of top three PCs (Figure 4). Taking the loading of PC1 as the main reference index and considering the loadings of PC2 and PC3, it could be concluded that the information in the regions of 525–1778 cm-1 and 2820–3687 cm-1 contributed significantly to the identification. However, the characteristic bands were complex, and the feature dimension was still large, so it was difficult to find the key information just through PCA.

.")
Figure 4: Loading plot of top 3 principal components (PCs).
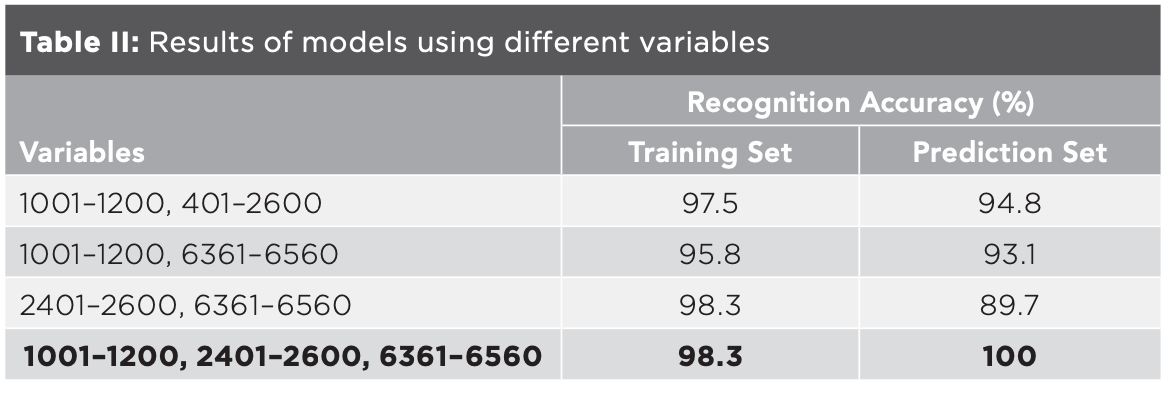
To excavate the characteristic data on the basis of PCA, window analysis method was performed to establish the classification model using the local data of mid-IR spectra. The bands located at 525–1778 and 2820–3687 cm-1 corresponded to the variable regions of 1–2600 and 4761–6560 of the data matrix. The bands were divided into 22 windows with a variable interval of 200, and the results of the models established with each window were computed. The recognition accuracy of training set and prediction set in six windows, with variable ranges of 1001–1200, 1801–2000, 2001–2200, 2201–2400, 2401–2600, and 6361–6560, were all above 80.0%. Considering the continuity and integrity of the bands, the variable ranges of 1801–2000, 2001–2200, 2201–2400 and 2401–2600 were combined into 1801–2600. The recognition accuracy of the training set and the prediction set were 98.3% and 89.7%, respectively, using the combined variables which were similar with those of 2401–2600, suggesting that the variable ranges of 1801–2000, 2001–2200 and 2201–2400 made little contributions to the identification model and could be discarded.
Combinations of variables ranging from 1001–1200, 2401–2600, and 6361–6560 were used to establish the classification models (Table II). The model had the highest recognition accuracy when using all the three variables and the results were similar to those in Table I, indicating that variables of 1001–1200, 2401–2600 and 6361–6560 contributed the most to the classification model, and could be used as characteristic variables to distinguish the five kinds of millet. Compared with the results of PCA, window analysis further reduced the range of characteristic bands, making the characteristic bands increasingly clearer.


Furthermore, variables of 1001–1200, 2401–2600, 6361–6560 were divided into six windows with the variable interval of 100, the correlation between variables at each window was explored by HCA, and the irrelevant variables were screened. Euclidean distance, standardized Euclidean distance (seuclidean distance), city block distance, and cosine distance were used, respectively, to calculate the similarities between wavenumbers. Average, single, and complete distance were used as linkage methods to create the clustering tree, respectively, and the cophenetic correlation coefficients (C) under various methods were calculated. The results showed that the value of C of most windows were the largest when using cosine distance as the distance measurement method and average distance as the clustering tree creating method, and the cluster trees created by these methods were the best. It could be seen from the cluster trees that the continuous wavenumbers were often adjacent to each other. The adjacent wavenumbers in mid-IR spectrum represented the vibration of the same covalent bond in molecules with different transition energy levels. When the sample was confirmed, the covalent bonds and their contents were fixed, and the wavenumbers and absorption intensities were fixed. That is, some wavenumbers were relevant. After screening, variables of 1041, 1096, 2408, 2469, and 2530, had small correlation. When using the data of these five variables to build the identification model, the recognition accuracy of the training set and the prediction set were 95.8% and 100%, respectively. Therefore, the screened variables were the characteristic variables to distinguish millet from different geographical origins. The corresponding wavenumbers were 1026, 1053, 1685, 1715, and 1744 cm-1. Experiments showed that the proposed feature extraction method could accurately extract features from massive data, greatly reduce the dimension of data, and effectively improve the efficiency of the model when dealing with large samples. A wavenumber of 1744 cm-1 was assigned to the stretching vibration of C=O bond in saturated aliphatic ester. The results of this study combined with metabolomic analysis can be used to analyze the different composition in complex mixtures so that the identification of millet can reach to the micromolecular level.
Conclusion
In this paper, five kinds of millet were taken as examples to explore the feasibility of mid-IR technology on identifying their geographical origins and to explore the characteristic information that affected the accuracy of the identification model. Firstly, millet flour was prepared by milling and grinding. Secondly, the mid-IR spectra of each millet flour sample were collected and processed by denoising, SNV, MSC, and normalization. Finally, PCA was combined with SVM and used to establish the identification model. When using the first 12 PCs, the recognition accuracy of the training set and the prediction set were 99.2% and 98.3%. The mid-IR spectroscopy method explored in this paper provides more accurate and effective data for the construction of millet origin traceability model. The proposed data preprocessing method and origin identification model had potential application value. Meanwhile, to clarify the characteristic information of the mid-IR spectra of millet from different producing areas, methods of PCA, window analysis, HCA, and SVM were combined to extract the features. The transmittance values corresponding to wavenumbers of 1026, 1053, 1685, 1715, and 1744 cm-1 were used to build the identification model. The recognition accuracy of the training set and the prediction set were 95.8% and 100%. Experiments showed that the proposed feature extraction method could accurately extract feature from massive data, greatly reduce the dimension of data, and effectively improve the efficiency of the model when dealing with large samples. In addition, the results of this study, when combined with metabolomic analysis, can be used to analyze the different compositions in complex mixtures so that the identification of millet can reach to the micromolecular level.
Conflicts of Interest
The authors have no conflicts of interest.
Acknowledgements
This research was financially supported by the Natural Science Foundation of Jiangsu Province [grant number BK20180816], the Natural Science Research of Jiangsu Higher Education Institutions of China [grant number 17KJD550001], and the National Natural Science Foundation of China [grant number 21908109].
References
- Obidiegwu, O. N.; Obidiegwu, J. E.; Parzies, H. Development of SSR for Foxtail Millet (Setaria Italica (L.) P. Beauv.) and Its Utility in Genetic Discrimination of a Core Set. Genes Genom. 2013, 35 (5), 609–615. DOI: 10.1007/sl3258-013-0110-8
- An, C. B.; Dong, W. M.; Li, H.; et al. Variability of the Stable Carbon Isotope Ratio in Modern and Archaeological Millets: Evidence from Northern China. J. Archaeol. Sci. 2015, 53, 316–322. DOI: 10.1016/j.jas.2014.11.001
- Lightfoot, E.; Przelomska, N.; Craven, M.; et al. Intraspecific Carbon and Nitrogen Isotopic Variability in Foxtail Millet (Setaria Italica). Rapid Commun. Mass Spectrom. 2016, 30, 1475–1487. DOI: 10.1002/rcm.7583
- Nakarani, U. M.; Singh, D.; Suthar, K. P.; et al. Nutritional and Phytochemical Profiling of Nutracereal Finger Millet (Eleusine Coracana L.) Genotypes. Food Chem. 2021, 341, 128271. DOI: 10.1016/j.foodchem.2020.128271
- Pathak, P.; Srivastava, S.; Grover, S. Development of Food Products Based on Millets, Legumes and Fenugreek Seeds and Their Suitability in the Diabetic Diet. Int. J. Food Sci. Nutr. 2000, 51 (5), 409–414. DOI: 10.1080/096374800427019
- Shobana, S.; Malleshi, N. G. Preparation and Functional Properties of Decorticated Finger Millet (Eleusine Coracana). J. Food Eng. 2007, 79 (2), 529–538. DOI: 10.1016/j.jfoodeng.2006.01.076
- Wiedemair, V.; Mair, D.; Held, C.; Huck, C. W. Investigations into the Use of Handheld Near-infrared Spectrometer and Novel Semi-automated Data Analysis for the Determination of Protein Content in Different Cultivars of Panicum Miliaceum L. Talanta 2019, 205, 120115. DOI: 10.1016/j.talanta.2019.120115
- Sun, M; Kang, X.; Wang, T.; et al. Genotypic Diversity of Quality Traits in Chinese Foxtail Millet (Setaria Italica L.) and the Establishment of a Quality Evaluation System. Food Chem. 2021, 353, 129421. DOI: 10.1016/j.foodchem.2021.129421
- Ariyama, K.; Shinozaki, M.; Kawasaki, A. Determination of the Geographic Origin of Rice by Chemometrics with Strontium and Lead Isotope Ratios and Multielement Concentrations. J. Agric. Food Chem. 2012, 60 (7), 1628–1634. DOI: 10.1021/jf204296p
- Lagad, R. A.; Singh, S. K.; Rai, V. K. Rare Earth Elements and 87Sr/86Sr Isotopic Characterization of Indian Basmati Rice as Potential Tool for Its Geographical Authenticity. Food Chem. 2017, 217, 254–265. DOI: 10.1016/j.foodchem.2016.08.094
- Gang, L.; Nunes, L.; Wang, Y.; et al. Profiling the Ionome of Rice and Its Use in Discriminating Geographical Origins at the Regional Scale, China. J. Environ. Sci. 2012, 25 (1), 144–154. DOI: 10.1016/S1001-0742(12)60007-2
- Promchan, J.; Günther, D.; Siripinyanond, A.; Shiowatana. J. Elemental Imaging and Classifying Rice Grains by Using Laser Ablation Inductively Coupled Plasma Mass Spectrometry and Linear Discriminant Analysis. J. Cereal Sci. 2016, 71, 198–203. DOI: 10.1016/j.jcs.2016.08.017
- Lim, D. K.; Mo, C.; Lee, D.; et al. Non-destructive Profiling of Volatile Organic Compounds Using HS-SPME/GC-MS and Its Application for the Geographical Discrimination of White Rice. J. Food Drug Anal. 2018, 26 (1), 260–267. DOI: 10.1016/j.jfda.2017.04.005
- Yang, D. S.; Lee, K. S.; Kays, S. J. Characterization and Discrimination of Premium-Quality, Waxy, and Black-Pigmented Rice Based on Odor-active Compounds. J. Sci. Food Agric. 2010, 90 (15), 2595–2601. DOI: 10.1002/jsfa.4126
- Wang, X.; Li, Z.; Zheng, D.; Wang, W. Nondestructive Identification of Millet Varieties Using Hyperspectral Imaging Technology. J. Appl. Spectrosc. 2020, 87 (1), 54–61. DOI: 10.1007/s10812-020-00962-y
- Zhang, S.; Lu, Q.; Wang, T.; Liu, J.; Li, X. Raman Spectroscopy for the Identification of Millet Varieties and Producing Areas and Correlation Study of Chemical Composition. The 20th National Light Scattering Conference, Suzhou, 2019.
- Qian, L.; Song, X.; Lei, Y.; et al. Rapid Detection of Millet Origin by Near Infrared Diffuse Reflectance Spectroscopy. The Food Industry 2018, 39 (6), 257–261.
- Yang, X. S.; Wang, L. L.; Zhou, X. R.; et al. Determination of Protein, Fat, Starch, and Amino Acids in Foxtail Millet [Setaria Italica (L.) Beauv.] by Fourier Transform Near-infrared Reflectance Spectroscopy. Food Sci. Biotechnol. 2013, 22 (6), 1495–1500.
- Kaur, H.; Gill, B. S. Changes in Physicochemical, Nutritional Characteristics and ATR-FTIR Molecular Interactions of Cereal Grains During Germination. J. Food Sci. Technol. 2020, 58, 2313–2324. DOI: 10.1007/s13197-020-04742-6
- Cozzolino, D. An Overview of the Use of Infrared Spectroscopy and Chemometrics in Authenticity and Traceability of Cereals. Food Res. Int. 2014, 60, 262–265. DOI: 10.1016/j.foodres.2013.08.034
- Gan, J. H.; Xu, C. H.; Zhu, H. Z.; Fang, M.; Sun, S. Q. Analysis and Discrimination of Ten Different Sponges by Multi-step Infrared Spectroscopy. Chinese Chem. Lett. 2015, 26 (2), 215–220. DOI: 10.1016/j.cclet.2015.01.012
- Warren, F. J.; Butterworth, P. J.; Ellis, P. R. The Surface Structure of a Complex Substrate Revealed by Enzyme Kinetics and Freundlich Constants for α-amylase Interaction with the Surface of Starch. BBA-Gen. Subjects 2013, 1830 (4), 3095–3101. DOI: 10.1016/j.bbagen.2012.12.028
- Zhao, X. Y.; Zhang, B.; Li, Q.; et al. Research on Quality Millet by the Three-step MIR Spectroscopy. Science and Technology of Cereals, Oils and Foods 2021, 29 (2), 81–87.
- Sha, M.; Zhang, D.; Zhang, Z. Y.; et al. Improving Raman Spectroscopic Identification of Rice Varieties by Feature Extraction. J. Raman Spectrosc. 2020, 51 (4), 702–710. DOI: 10.1002/jrs.5828
- Barnes, R. J.; Dhanoa, M.S.; Lister, S.J. Correction to the Description of Standard Normal Variate (SNV) and De-Trend (DT) Transformations in Practical Spectroscopy with Applications in Food and Beverage Analysis—2nd Edition. J. Near Infrared Spec. 1993, 1 (3), 185–186. DOI: 10.1255/jnirs.21
- Tomas, I.; Tormod, N. The Effect of Multiplicative Scatter Correction (MSC) and Linearity Improvement in NIR Spectroscopy. Appl. Spectrosc. 1988, 42, 1273–1284. DOI: 10.1366/0003702884429869
- Naji, H. A. H.; Xue, Q. J.; Zheng, K.; Lyu N. C. Investigating the Significant Individual Historical Factors of Driving Risk Using Hierarchical Clustering Analysis and Quasi-poisson Regression Model. Sensors 2020, 20 (8), 2331. DOI: 10.3390/s20082331
- Huo, Y. Q.; Kamal, G. M.; Wang, J.; et al. 1H NMR-based Metabolomics for Discrimination of Rice from Different Geographical Origins of China. J. Cereal Sci. 2017, 76, 243–252. DOI: 10.1016/j.jcs.2017.07.002
- Li, Y. P.; Li, F. C.; Yang, X. H.; et al. Quantitative Analysis of Glycated Albumin in Serum Based on ATR-FTIR Spectrum Combined with SiPLS and SVM. Spectrochim. Acta A 2018, 201, 249–257. DOI: 10.1016/j.saa.2018.05.022
- Balabin, R. M.; Smirnov, S. V. Melamine Detection by Mid- and Near-Infrared (MIR/NIR) Spectroscopy: A Quick and Sensitive Method for Dairy Products Analysis Including Liquid Milk, Infant Formula, and Milk Powder. Talanta 2011, 85, 562–568. DOI: 10.1016/j.talanta.2011.04.026
- Cai, W. S.; Li, Y. K.; Shao, X. G. A Variable Selection Method Based on Uninformative Variable Elimination for Multivariate Calibration of Near-infrared Spectra. Chemometr. Intell. Lab. 2008, 90, 188–194. DOI: 10.1016/j.chemolab.2007.10.001
- Farrelly, C. M.; Schwartz, S. J.; Amodeo, A. L.; et al. The Analysis of Bridging Constructs with Hierarchical Clustering Methods: An Application to Identity. J. Res. Pers. 2017, 70, 93–106. DOI: 10.1016/j.jrp.2017.06.005
- Johnson, S.C. Hierarchial Clustering Schemes. Psychometrika 1967, 3, 241–254. DOI: 10.1007/BF02289588
- Wang, X. L.; Liu, G.; Zhao, X. X.; Ou, Q. H.; Hao, J. M. Study of Millet by Fourier Transform Infrared Spectroscopy. The Journal of Light Scattering 2014, 26 (4), 406–410.
Min Sha, Yitao Chen, Xinyi Wang, Sufang Zhou, Yunsong Liu, and Yaoxinyu Yang are with the School of Management Science and Engineering at Nanjing University of Finance and Economics, in Nanjing, China. Ding Zhang is with the School of Chemical Engineering at Nanjing University of Science and Technology, in Nanjing, China. Direct correspondence to Min Sha at shaminjingjing@163.com


Rapid Analysis of Logging Wellhead Gases Based on Fourier Transform Infrared Spectroscopy
Fourier transform infrared (FT-IR) spectroscopy was used in this paper to rapidly analyze seven light alkanes (methane, ethane, propane, n-butane, i-butane, n-pentane, and i-pentane) in wellhead gases.

Short Tutorial: Complex-Valued Chemometrics for Composition Analysis
June 16th 2025In this tutorial, Thomas G. Mayerhöfer and Jürgen Popp introduce complex-valued chemometrics as a more physically grounded alternative to traditional intensity-based spectroscopy measurement methods. By incorporating both the real and imaginary parts of the complex refractive index of a sample, this approach preserves phase information and improves linearity with sample analyte concentration. The result is more robust and interpretable multivariate models, especially in systems affected by nonlinear effects or strong solvent and analyte interactions.

