Inorganics I: Introduction
Despite what some people think, inorganics do have mid-infrared spectra. In this column, we will prove this and discuss what inorganic compounds are and describe the general characteristics of their infrared spectra.
As I have mentioned in previous columns, in addition to writing this column for the esteemed journal Spectroscopy, I have been teaching infrared spectral interpretation courses online and in-person for more than 30 years. In that time, I have taught thousands of scientists about infrared spectral interpretation. I have also written a book on the subject (1).
On occasion when I teach about the infrared spectra of inorganics, some students have objected to the topic saying, “Inorganics do not have infrared spectra.” As this and succeeding columns will prove, that assertion is false.
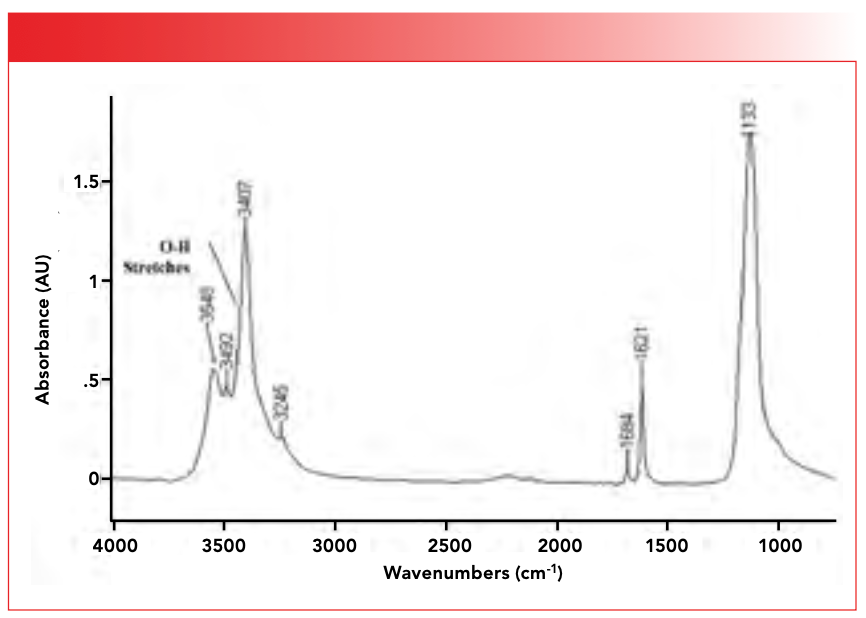
Inorganics do have infrared spectra, as seen in Figure 1, where I present to you the mid-infrared spectrum of calcium sulfate dihydrate (CaSO4•2H2O), otherwise known as gypsum, a decidedly inorganic compound. In fact, the field of the infrared spectroscopy of inorganic compounds is so rich that an entire book has been written on the subject (2).
FIGURE 1: The infrared spectrum of the inorganic compound calcium sulfate dihydrate (gypsum), CaSO4•2H2O.

What are Inorganics?
Before we go any further, we need to define what exactly is meant by the phrase inorganic compound. Back in the Jurassic era when I was a graduate student at Dartmouth, I had the pleasure of meeting Nobel Prize winning chemist Roald Hoffmann, PhD. I am happy to say that, as of this writing, Hoffmann is still with us, and has lived a fascinating life that is worth reading about (3). I had the privilege of manning the slide projector for him, which shows you how long ago this was. An interesting point that Hoffmann made was that chemistry is full of “fuzzy concepts” such as acids, bases, and chemical bonds. This is true as I recall as an undergraduate being taught seven different definitions of what an acid is, and at least five different ways of thinking about chemical bonds. This lack of exactness can drive some people, including physicists and engineers, crazy. However, his point that there are 10 million chemical compounds known to man, and yet a handful of simple but useful fuzzy chemical concepts can explain most of the properties of this vast array of molecules—a small miracle in and of itself.
The ideas of what are organic and inorganic compounds certainly have some fuzziness around them. One could say that organic compounds have carbon and inorganic compounds have no carbon. However, calcium carbonate (CaCO3) from its properties is clearly an inorganic substance, and yet it has carbon in it. Another definition is that organics contain C-H bonds, and inorganics do not. Yet the polymer polytetrafluoroethylene, C2F2, has no C-H bonds, and yet is certainly organic. Rather than resolve this debate, for our purposes the compounds whose infrared spectra we will study will have three properties:
- No C-H bonds;
- Consist of a positively charged metal atom ion, the cation, and a negatively charged ion, the anion;
- Engage in ionic bonding.
Characteristics of Inorganic Infrared Spectra
Recall (4) that the peak positions in infrared spectra are given by the following equation.

Where W equals peak wavenumber position in cm-1; c equals the speed of light; K equals force constant of a vibrating chemical bond; and MR equals reduced mass of a vibrating chemical bond. Reduced mass, MR, is given by equation 2.

Where MR equals reduced mass; M1 equals the mass of atom 1 in a vibrating chemical bond, and M2 equals the mass of atom 2 in a vibrating chemical bond.
Note that, in equation 1, MR is in the denominator, which means as the mass of the atoms in a vibrating chemical bond goes up, the peak position in wavenumber goes down.
Above I stated that inorganics contain metal cations. A consultation of any Periodic Table of the Chemical Elements (which I will not bother to reproduce here), shows that most metal atoms weigh more than the non-metal elements found in organics such as C, H, N, and O. This means that, in general, the stretching and bending vibrations of chemical bonds containing metal atoms will tend to fall at lower wavenumber than the peaks from non-metal containing chemical bonds. A very loose rule of thumb is that organics tend to absorb infrared light above 400 cm-1, and inorganics tent to absorb infrared light below 400 cm-1 (please spare me the emails pointing out the exceptions, this is yet another example of a fuzzy chemical concept).
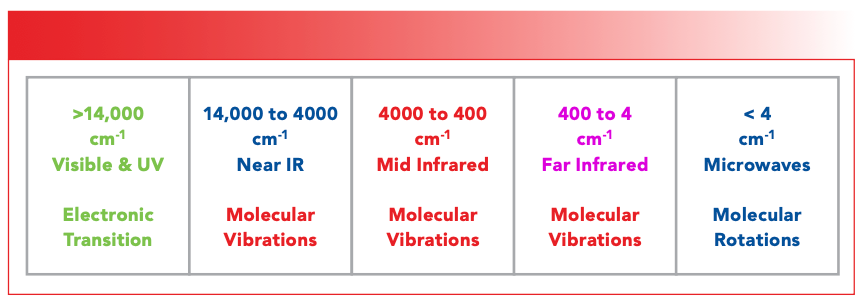
Figure 2 shows my definition of the wavenumber regions for several different types of electromagnetic radiation. Note that the mid-infrared is defined as being from 4000 to 400 cm-1. All the spectra we have looked at in this course have been mid-infrared spectra. Note that from 400 to 4 cm-1 we have what is called the far infrared. To recast the rule of thumb from above, organics tend to absorb above 400 cm-1, and inorganics tend to absorb below 400 cm-1. In fact, the low wavenumber 400 cm-1 cutoff in the definition of the mid-infrared results from the fact that most Fourier transform infrared (FT-IR) devices use beam splitters containing KBr windows that begin to absorb around 400 cm-1.
FIGURE 2: A portion of the electromagnetic spectrum, pointing out the wavenumber regions of some types of electromagnetic radiation.

As it turns out, many peaks involving metal atom stretching and bending peaks fall in the far infrared, beyond where most FT-IRs work (although one can purchase FT-IRs that work in the far infrared, but they can be expensive). So where does this leave us in terms of interpreting the mid-infrared spectra of inorganics?
The most diagnostically useful mid-infrared peaks of inorganics are typically from the stretching and bending vibrations of polyatomic anions—that is, negatively charged ions that contain more than one atom. Classic examples of polyatomic anions include sulfates (SO4), carbonates (CO3), and nitrates (NO2).
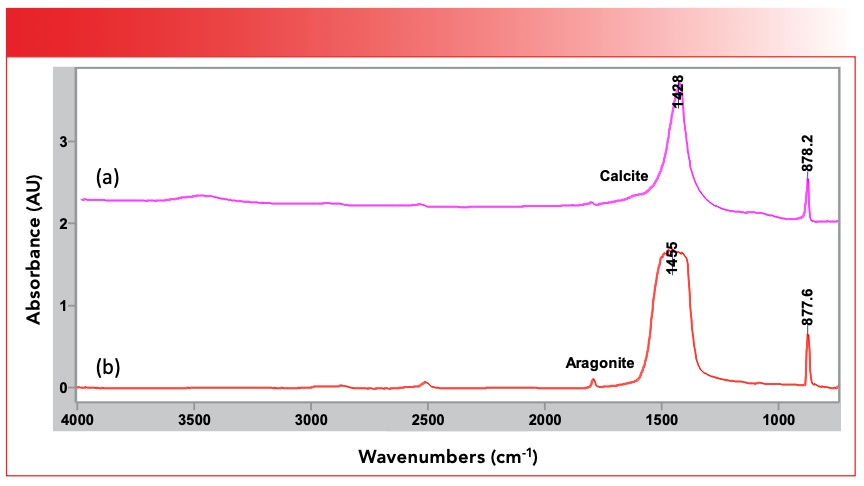
Another interesting fact about inorganics that affects their spectra is that they are often found in crystalline form. That is when they solidify their molecules arrange themselves in such a manner that there is long range order. This can complicate the interpretation of inorganic spectra because different crystalline forms of the same molecule give different infrared spectra (this is true of crystalline organics as well). This is because, amongst other things, infrared spectra are sensitive to the geometry of the packing of nearest neighbor molecules. For example, calcium carbonate (CaCO3) comes in two different crystalline forms, calcite which is trigonal, and aragonite which is rhombohedral. Figure 3 shows that their infrared spectra clearly are different.
FIGURE 3: The infrared spectra of two different crystalline forms of CaCO3, (a) calcite, which is trigonal, and (b) aragonite, which is rhombohedral. Note that the carbon-oxygen stretching peaks are different in the two spectra, falling at 1428 and 1455 respectively.

Note in the spectrum of calcite at top that it has a peak at 1428 cm-1 (all peak positions going forward will be in cm-1 even if not noted), and at bottom aragonite has a peak at 1455. These peaks are from the carbon–oxygen stretching vibrations of the CO3 group, but more on that later. As we will see going forward, many of the peaks of inorganic molecules seen in the mid-infrared are the stretching and bending peaks of polyatomic anions. Note that in the three inorganic spectra we have seen above there are no C-H stretching peaks in the vicinity of 3000. This is because to the best of my knowledge there are no inorganic molecules which contain C-H bonds.
Recall (4) that the intensity of infrared peaks is determined by Beer’s Law, which is seen in equation 3.

Where A equals absorbance; ε equals absorptivity; l equals the wavelength; and c equals the concentration. We found that the absorptivity depends upon the change in dipole moment with respect to distance during a vibration as given by equation 4.

Where ε equals absorptivity; dμ equals the change in dipole moment during a vibration; and dx equals the change in bond length during a vibration.
Equation 4 means that, for functional groups with large dipole moments, their infrared peaks will often be strong. Note that in the spectra of gypsum, calcite, and aragonite seen above there are big peaks in the 1500 to 1000 range. Big peaks like these, often at lower wavenumber, are a characteristic of inorganic spectra because of the large dμ/dx values of their vibrations.
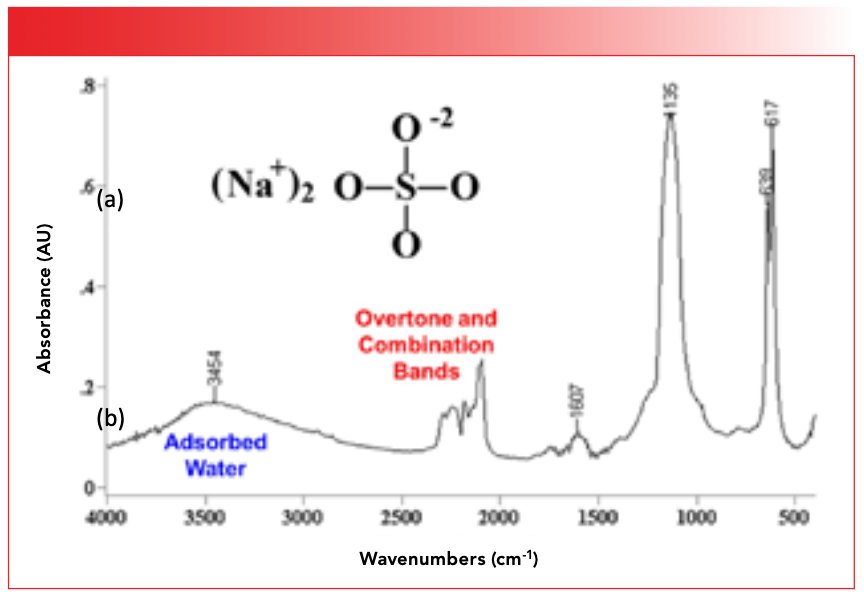
Also recall in a previous column (5) that in addition to the fundamental bands that dominate mid-infrared spectra, we can sometimes see what are called overtone and combination bands. We discussed (5) that in general these peaks are 10x to 100x weaker than fundamental bands because dμ/dx for these vibrations is usually small. Often times, these bands do not appear in spectra or appear weakly. Most inorganics exhibit ionic bonding because the electronegativity difference between the metal atom and the oxygen or halogen atoms to which they are often bonded is large. This means dμ/dx for the fundamental vibrations of these groups is large, and hence dμ/dx for their overtone and combination vibrations is unusually large. This means overtone and combination features often times show up with good intensity in inorganic spectra, whereas they usually do not in the spectra of organic molecules. Figure 4 shows a group of overtone and combination bands in the spectrum of sodium sulfate.
FIGURE 4: The infrared spectrum of sodium sulfate. Note the overtone and combination bands, and the peak from the O-H stretch of adsorbed water at 3454.

Note that the heights of these bands are a significant fraction of the height of the biggest bands in the spectrum. Again, this is unusual for overtone and combination bands.
Lastly, water is present in many forms in inorganic spectra. Adsorbed water may be the most common form of water in inorganics, and perhaps the most common contaminant. This is because many inorganics are highly polar and are hence hygroscopic, which means they absorb water from the atmosphere. Figure 4 shows the infrared spectrum of the inorganic molecule sodium sulfate (Na2SO4). Note the broad peak from the O-H stretch of adsorbed water at 3454. The presence of a broad envelope near this position is a good sign that adsorbed water is present in a sample.
Another form water can take in inorganic compounds is as a water of hydration. These water molecules crystallize along with inorganic molecules and end up occupying sites within the crystalline lattice. Gypsum, whose infrared spectrum is seen in Figure 1, contains two waters of hydration hence its name calcium sulfate dihydrate, and the funny way we write its chemical formula, CaSO4•2H2O, is because the •2H2O denotes the two waters of hydration. All the peaks in the spectrum of gypsum above 1500 are from the O-H stretching and bending peaks of the waters of hydration. Lastly, water can be found in inorganic lattices chemically bonded to metal ions.
Conclusions
The definition of what comprises an inorganic molecule is fuzzy, but for our purposes they are molecules that do not contain C-H bonds, contain a positively charged metal cation and negatively charged anion, and engage in ionic bonding. Inorganic spectra have a number of unique characteristics including a lack of C-H stretching vibrations, intense peaks at low wavenumber, overtone and combination bands with significant intensity, and water in many forms including adsorbed water and waters of hydration, all of which contribute to the richness of inorganic spectra.
References
(1) Smith, B. C. Infrared Spectral Interpretation: A Systematic Approach; CRC Press, 1999.
(2) Nyquist R.; Kagel, R. Handbook of Infrared and Raman Spectra of Inorganic Compounds and Organic Salts; Elsevier, 1971.
(3) Roald Hoffmann - Wikipedia https://en.wikipedia.org/wiki/Roald_Hoffmann (accessed 2023-11-03).
(4) Smith, B. C. Why Spectral Interpretation Needs To Be Taught. Spectroscopy 2015, 30 (1), 16–23. https://www.spectroscopyonline.com/view/ir-spectral-interpretation-workshop (accessed 2023-11-03).
(5) Smith, B. C. The Benzene Fingers, Part I: Overtone and Combination Bands. Spectroscopy 2016, 31 (7), 30–34. https://www.spectroscopyonline.com/view/benzene-fingers-part-i-overtone-and-combination-bands (accessed 2023-11-03).
Brian C. Smith, PhD, is the founder and CEO of Big Sur Scientific, a maker of portable mid-infrared cannabis analyzers. He has over 30 years experience as an industrial infrared spectroscopist, has published numerous peer-reviewed papers, and has written three books on spectroscopy. As a trainer, he has helped thousands of people around the world improve their infrared analyses. In addition to writing for Spectroscopy, Dr. Smith writes a regular column for its sister publication Cannabis Science and Technology and sits on its editorial board. He earned his PhD in physical chemistry from Dartmouth College. He can be reached at: SpectroscopyEdit@MMHGroup.com ●

AI Shakes Up Spectroscopy as New Tools Reveal the Secret Life of Molecules
April 14th 2025A leading-edge review led by researchers at Oak Ridge National Laboratory and MIT explores how artificial intelligence is revolutionizing the study of molecular vibrations and phonon dynamics. From infrared and Raman spectroscopy to neutron and X-ray scattering, AI is transforming how scientists interpret vibrational spectra and predict material behaviors.
Real-Time Battery Health Tracking Using Fiber-Optic Sensors
April 9th 2025A new study by researchers from Palo Alto Research Center (PARC, a Xerox Company) and LG Chem Power presents a novel method for real-time battery monitoring using embedded fiber-optic sensors. This approach enhances state-of-charge (SOC) and state-of-health (SOH) estimations, potentially improving the efficiency and lifespan of lithium-ion batteries in electric vehicles (xEVs).
New Study Provides Insights into Chiral Smectic Phases
March 31st 2025Researchers from the Institute of Nuclear Physics Polish Academy of Sciences have unveiled new insights into the molecular arrangement of the 7HH6 compound’s smectic phases using X-ray diffraction (XRD) and infrared (IR) spectroscopy.
