Measurement of Water in Ethanol Using Encoded Photometric NIR Spectroscopy
For ethanol to be usable as a fuel, water must be removed in the distillation process. This article reviews an experiment conducted to test the capability of an EP-IR spectrometer to quantify the percentage volume of water in ethanol.

This article will review an experiment conducted to test the capability of an EP-IR spectrometer to quantify the percentage volume of water in ethanol. Ethanol is a popular biofuel that is often used as an effective alternative to fossil fuels such as gasoline or diesel. For the ethanol to be usable as a fuel, water must be removed in the distillation process. The results of the experiment confirm the ability of EP-NIR spectroscopy, together with an extended-range transmission Direct Immersion Probe (DIP), to predict low-level moisture content in ethanol samples accurately and effectively, particularly when ethanol concentrations are 90% or greater.
The limited quantity of available oil and the ever-increasing petroleum costs, pollution concerns, and political pressure to decrease reliance on foreign fuel stocks all have stimulated a growing interest in biofuels, which can offer significant environmental and long-term economic advantages. The interest is worldwide, especially in countries that have no domestic petroleum reservoirs. The U.S. accounts for about 90% of biofuel production using enzymes, while there are currently seven EU countries producing biofuels, including Germany, Spain, and the UK. In Sweden, all 95-octane gasoline contains 5% biofuel. China accounts for around 5% of global biofuel production (1).
In August 2005, the U.S. government signed the Energy Policy Act (2) into law. The comprehensive energy legislation introduced a nationwide Renewable Fuels Standard (RFS) (3) aiming to double the use of ethanol and biodiesel by 2012. Under the RFS, a small percentage of the U.S. fuel supply is provided by renewable, domestic fuels including ethanol and biodiesel, ideally resulting in reduced consumer fuel prices, increased energy security, and growth in rural parts of the country. Furthermore, the increased use of renewable fuels is set to expand U.S. fuel supplies while easing the overburdened refining industry. Whereas no new oil refineries have been built in the U.S. since 1976, nearly 100 ethanol production facilities have been built during this time, adding critical volume to the gasoline market (4).
Ethanol
Ethanol is a popular biofuel used as an effective alternative to fossil fuels such as gasoline or diesel. It can be combined with gasoline in any concentration up to pure ethanol (E100). Ethanol with at most 1% water can be blended with gasoline in varying quantities to reduce consumption of petroleum fuels, thereby reducing air pollution. In fact, the use of ethanol can lead to a net reduction in the release of carbon dioxide into the atmosphere. Ethanol is also biodegradable, and therefore relatively harmless to the environment if spilled.
Current interest in ethanol lies in production derived from the starch or sugar in a wide variety of crops (bio-ethanol). More than 90% of the ethanol produced in the U.S. comes from corn (5). The basic steps for production of ethanol from corn include refining into starch, liquification and saccharification (hydrolysis of starch into glucose), yeast fermentation, distillation, dehydration (required for blending with gasoline), and denaturing (optional).
For the ethanol to be usable as a fuel, water must be removed in the distillation process. The purity achieved is limited to 95–96% due to the formation of a low-boiling water–ethanol azeotrope, but this concentration of 96% w/w (93% v/v) ethanol and 4% w/w (7% v/v) water is appropriate for the mixture to be used as a fuel (6). This requirement creates the need for an efficient technology capable of determining the percentage of water contained in ethanol. Near-infrared (NIR) spectroscopy techniques are well suited for measuring many liquid constituents in the presence of others quickly and accurately.
Traditional NIR Methods
Nondispersive IR
Nondispersive IR is the simplest, oldest, and least expensive NIR technology, using one or several optical band pass filters to monitor areas of the NIR spectrum. Because of its limited cost and proven ruggedness, this technique is perfectly suitable when individual chemical absorption bands of interest can be isolated in the spectrum. In cases in which there is spectral overlap of chemical bands, the method's reliability can suffer from false positives or inaccuracies unless a very large calibration set is utilized to monitor the very subtle differences in each bandpass portion of the spectrum. Moreover, nondispersive IR instruments usually are configured to suit a particular application, thus lacking the flexibility to potentially perform other analyses with the same filter set, except when the filters chosen cover the exact region needed for the different applications.
Dispersive NIR
This technique provides a full spectrum rather than several optical band pass filter areas of the spectrum, meaning that chemometric modeling is enhanced greatly and one instrument typically is suitable for multiple applications. There are two types of dispersive NIR instruments, scanning grating with a single point detector or a fixed grating, and detector array. In the first case, reproducibility can cause problems in the presence of vibrations or due to mechanical reproducibility of the moving grating itself. This can lead to minor artifacts in the spectra, which can then generate inaccuracies when applying sophisticated quantitative methods that are very sensitive to peak shifts or changes in the band shapes. In the case of diode array instruments, the detectors can be costly if the information-rich portion of the NIR spectrum is to be incorporated. Additionally, producing arrays that have consistent performance from array to array and element to element can be a challenge.
Fourier-transform NIR
This method achieves excellent resolution. When operating in nonvibrational environments, Fourier transform–NIR (FT-NIR) instruments are capable of providing excellent reproducibility of spectra. FT-NIR is fast and employs co-addition for reduction of noise. FT-NIR instruments work very well in a laboratory environment. However, in a process environment, temperature fluctuations and vibrations related to machinery can affect the performance of the FT-NIR interferometer adversely.
Encoded Photometric NIR
Encoded photometric-NIR (EP-NIR) spectroscopy has emerged as a more flexible and rugged approach than nondispersive IR, dispersive NIR, and FT-NIR. EP-NIR spectroscopy relies upon a simple yet process-rugged and efficient photometric design whereby the incoming near-infrared beam from a sample is imaged onto a diffraction grating-based spectrograph (Figure 1). The dispersed radiation from the grating is then imaged across an aperture onto the surface of an encoder disk, which is spinning at 6000 rpm (100 Hz), providing fast real-time detection. The encoder disk has a series of reflective tracks, which are spatially located within the dispersed grating image to correspond to the wavelengths and wavelength regions used for the analysis. Each track has a pattern that produces a reflected beam with a unique sinusoidal modulation for each individual wavelength. The reflected beams are brought to an image on a single detector, which generates a signal that forms an interferogram type of signal. The intensity contribution for each wavelength component is obtained by applying a Fourier transform to the interferogram.
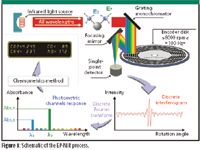
Figure 1: Schematic of the EP-NIR process.
EP-NIR spectrometers are designed to encode analytical information in the same way as interferometers but without the environmentally sensitive components of interferometers. EP-NIR covers a wide spectral range of 1375–2750 nm, whereas traditional NIR systems typically stop at 2100 nm. This capability makes EP-NIR suitable for a wide range of applications, including protein purification and separation, protein and fat analysis, petrochemicals, and alcohols and starch. EP-NIR facilitates fast scanning operation, being capable of simultaneously measuring multiple gas components in the parts-per-billion to parts-per-million range at an impressive rate of 100 scans/s, resulting in high sample throughput, realtime quality control monitoring, and a high degree of sensitivity through spectral averaging. Furthermore, the units do not utilize any hygroscopic optical components or internal lasers.
In addition, EP-NIR instrumentation is military certified for vibration insensitive operation under Military 202G Method 204D. A high-frequency vibration resistance test was performed to determine the effect of vibration on component parts of the analyzer in sweeping frequency ranges of 0.5–30 Hz. The units demonstrated no degradation in electrical or photometric performance during or after the test. Moreover, the photometric performance was tested further by collecting spectra, as these vibrations were applied to the analyzer. During this test, the EP-NIR analyzer retained photometric performance and met RMS signal-to-noise specifications greater than 50,000:1.
Experimental
An EP-NIR analyzer (Aspectrics, Pleasanton, California) covering the 1375–2750 nm range was coupled to an external halogen NIR source and an extended-range 2-mm pathlength process transmission multimode fiber probe (600 μm polyimide) to test the spectrometer's ability to quantify the percentage volume of water in ethanol. All spectra were collected using real-time spectroscopy software (RTSS, Aspectrics).
Denatured (rendered toxic with methanol) corn-based ethanol samples diluted with distilled water to concentrations ranging from 0.2% to 10.0% were used for this experiment. The precision of the reference method was approximated at 0.06 mL for a 10-mL pipette (relative error of 1.2%), resulting in a precision of the reference method of 2.4% relative. A total of 15 calibration standards and 16 independent validation standards were prepared by volumetric pipetting (Table I). The independent validation standards included water concentrations that were not covered in the learning set to test not only the accuracy but also the instrumental response linearity in validation.

Table I: Calibration/validation results
The data collection parameter was 60-s time integration. Calibration and validation samples were analyzed in five and four replicates, respectively, collecting a new background between each assay. Absorbance spectra from single-beam intensity spectra were calculated using open-beam configuration as a background. To quantitate the moisture content of unknown samples, a multivariate principal component regression (PCR) quantitative model was developed from the NIR spectra of all samples. The resulting PCR quantitative model was characterized by an R2 greater than 0.9970 for both the calibration and validation data sets as well as a root mean of standard error of calibration (RMSEC) of 0.07% and root mean of standard error of prediction (RMSEP) of 0.14%. These values were consistent with the precision of the sample blending volumetric method.
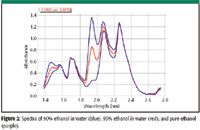
Figure 2: Spectra of 90% ethanol in water (blue), 95% ethanol in water (red), and pure ethanol (purple).
Results and Discussion
Spectral ranges of 1.375–1.548 μm and 1.743–2.273 μm (Figure 2) were selected for the development of the chemometrics methods. Two outliers were removed from the validation set because their spectra were clearly different from the spectra of the other repeat analysis of the same samples.
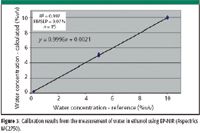
Figure 3: Calibration results from the measurement of water in ethanol using EP-NIR (Aspectrics MC2750).
Individual assays quantitative results are reported in Table I and are illustrated in Figures 3 and 4. Strong correlations between concentrations can be seen in the spectral range of 1.4–1.55 μm and 1.85–2.00 μm characteristic of water and in the C–OH region between 2.00 and 2.2 μm. The precision of the calibration can be ascertained through the RMSEP of the validation set, which was 0.14% v/v. Considering the maximum concentration for water (10% v/v), this value is consistent with the precision of the reference method (1.2% relative). A majority of this deviation originates from the 8.0% sample, which suggests a pipetting error during sample preparation.
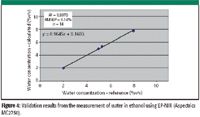
Figure 4: Validation results from the measurement of water in ethanol using EP-NIR (Aspectrics MC2750).
Summary
The inadequate quantity of petroleum, the constant increase in prices of fossil fuels, and the significant contribution of transport to emissions of greenhouse gases (21%) represent increasingly urgent challenges for the transport sector and for national economies. Thus, they trigger research into renewable energy sources as an alternative to oil.
Ethanol is a well-known biofuel used as an alternative to fossil fuels. The use of ethanol can lead to a net reduction in the release of carbon dioxide to the atmosphere, while the fact that it is biodegradable ensures that it is relatively harmless to the environment in the event it is spilled. For the ethanol to be usable as a fuel, water must be removed in the distillation process.
An experiment was performed to test the capability of EP-NIR spectroscopy to quantify the percentage volume of water in ethanol. The results from this experiment confirm the ability of EP-NIR spectroscopy, together with an extended range transmission direct immersion probe, to accurately and effectively predict low-level moisture content in ethanol samples, particularly when ethanol concentrations are 90% or greater. Furthermore, the experiment highlighted that the accuracy of the study is highly dependent upon the precision of the reference method (volumetric).
John Beauchaine and Jenni Briggs are with Aspectrics, Pleasanton, California.
References
(1) http://www.novozymes.com/NR/rdonlyres/AD1ECE47-B320-412E-A613-7B42972B8234/0/The_Zymes_gb206.pdf
(2) http://www.doi.gov/iepa/EnergyPolicyActof2005.pdf
(3) http://www.ethanol.org/rfs.html
(4) http://www.ethanolrfa.org/resource/standard/
(5) http://en.wikipedia.org/wiki/Ethanol_fuel
(6) http://en.wikipedia.org/wiki/Ethanol_fuel

NIR Spectroscopy Explored as Sustainable Approach to Detecting Bovine Mastitis
April 23rd 2025A new study published in Applied Food Research demonstrates that near-infrared spectroscopy (NIRS) can effectively detect subclinical bovine mastitis in milk, offering a fast, non-invasive method to guide targeted antibiotic treatment and support sustainable dairy practices.
New AI Strategy for Mycotoxin Detection in Cereal Grains
April 21st 2025Researchers from Jiangsu University and Zhejiang University of Water Resources and Electric Power have developed a transfer learning approach that significantly enhances the accuracy and adaptability of NIR spectroscopy models for detecting mycotoxins in cereals.
Karl Norris: A Pioneer in Optical Measurements and Near-Infrared Spectroscopy, Part II
April 21st 2025In this two-part "Icons of Spectroscopy" column, executive editor Jerome Workman Jr. details how Karl H. Norris has impacted the analysis of food, agricultural products, and pharmaceuticals over six decades. His pioneering work in optical analysis methods including his development and refinement of near-infrared spectroscopy, has transformed analysis technology. In this Part II article of a two-part series, we summarize Norris’ foundational publications in NIR, his patents, achievements, and legacy.