Model for Retrieving Leaf Chlorophyll Using the Wavelet Analysis Algorithm with the Prospect Radiative Transfer Model and Vis-NIR Spectra
We proposed a new retrieving model (named CAB1) for estimating the chlorophyll content at leaf level using the Prospect radiative transfer (RT) model. CAB1 is built based on multiband information derived from the radiative transfer model. Specifically, a continuous wavelet analysis algorithm was used to find the wavelet coefficients for those spectral characteristics that can highlight the chlorophyll content. Then, the simulated data sets generated by the Prospect model were used to evaluate the sensitivity of CAB1 in chlorophyll and its stability to other biochemical components (leaf structural parameters, water, carotenoids, brown pigment, and dry matter). Finally, CAB1 was verified using the Lopex93 and Angers experimental spectral data sets. Quantitative and qualitative results revealed that the retrieving model was not only more accurate than the traditional spectral index (the highest R2 of the inversion value and the measured value is 0.9), but also more stable.
Chlorophyll is the dominant factor affecting vegetation photosynthesis, and it is closely related to other biochemical parameters such as protein, nitrogen, lignin, and water (1). The chlorophyll content in a crop can be used to indicate the photosynthetic capacity, growth cycles, and degrees of stress (such as disease, insect pests, and heavy metal stress) (2,3). Traditional biochemical methods for measuring the chlorophyll content (such as spectrophotometry, in which samples must be pretreated in the laboratory) are destructive to the vegetation as well as time-consuming and laborious; thus, spectral reflectance is an attractive alternative (4,5).
During the past few decades, many studies have proposed the spectral indices required to estimate chlorophyll contents. By using one of the existing spectral indices or the sensitive bands of chlorophyll, a single or multivariate analysis model can be established. Several studies have successfully estimated the chlorophyll content in vegetation using visible ratios (6), vis-NIR ratios (7–9), red-edge reflectance ratio indices (10,11), and spectral and derivative red-edge indices (12). Yan used the Prospect model to test the applicability of four types of spectral indices, such as visible ratios (eight kinds), vis-NIR ratios (eight kinds), red-edge reflectance ratio indices (six kinds), and derivative red-edge indices (six kinds), to test chlorophyll content extraction. She found that some spectral indices, such as normalized difference vegetation index (NDVI) and the modified chlorophyll absorption in reflectance index (MCARI), are not suitable for retrieving chlorophyll based on the reflectance spectra. Rather, it was necessary to carefully select a spectral index for a specific application (13,14). Using a spectral index to evaluate the chlorophyll content of vegetation is simple and flexible, but there are obvious limitations. One limitation is that the spectral index method does not consider the radiative transfer (RT) mechanism of light in the leaf, which leads to a lack of definite physical meaning (15). The other limitation is that spectral index models are generally adapted to specific databases and are difficult to generalize to other databases.
Therefore, researchers began to consider optical models with geometric meanings, including the radiative transfer performance of light in vegetation, and the effects of vegetation biochemistry on light. The process of light reflection and absorption in vegetation and the interaction process were mathematically described to retrieve the biochemical components of the vegetation. Optical models, such as the Prospect (16), Liberty (17), and Leafmod (18) models, are not limited to the time, location, and other factors, and they are robust to noise. Yan noted that the reflection and absorption spectra simulated using the Prospect model are nearly the same as those of the measured spectra. Jiang used the Prospect model to simulate spectral data of different spectral scales (different bandwidths (5–65 nm)) and analyzed the validity and sensitivity when applied to the estimation of the chlorophyll content (19). Wang used the Prospect model to simulate the spectra of leaves with different biochemical characteristics, and analyzed the influence of different mathematical combinations of the NDVI spectral index on the elimination of interference factors. The spectral index of the dual NDVI ratio vegetation index was established to estimate the carotenoid content in leaves (20). Zhang used the Prospect model to construct a lookup table from which the chlorophyll content of eucalyptus leaves could be retrieved. The spectral data determined using a statistical method, an estimation model linking the chlorophyll, and carotenoid content with spectral characteristic parameters of eucalyptus leaves, were established (21).
The aim of this study was to construct a new spectral index for estimating chlorophyll content at the leaf level with physical implications, robustness, and universality. First, the relationship between the chlorophyll content and the spectral characteristics of vegetation based on the transmission mechanism of the Prospect optical model was analyzed to construct a new specific band. The “Experimental Materials and Methods” section introduces the experimental materials and methods, and describes the establishment of a new inversion model for chlorophyll content with continuous wavelet transform (CWT). The “Results” section reviews the experimental results, which describe the new inversion model validation of comparison with other vegetation indices. The “Discussion” section focuses on the advantages and disadvantages of new spectral index. Finally, the “Conclusion” section summarizes the findings of the study.
Experimental Materials and Methods
Prospect Leaf Model Simulated Dataset
The Prospect model, among the most mature RT models, has few required parameters and easy inversion. It can simulate the optical properties of vegetation leaves from 400 nm to 2500 nm (22). The Prospect model is a simple “flat model.” The leaf is composed of N-plate layers and N-1 air layers. In Prospect-5 (23), the total spectral absorption coefficient (k) of each leaf plate layer is a function of leaf structural parameters (N), chlorophyll content (Cab), water content (Cw), carotenoids (Car), brown pigment (Cbrown), and dry matter (Cm). Therefore, the absorption (A) of a leaf plate layer can be approximately expressed as a function of the leaf structural parameter (N) and a single plate layer absorption coefficient (k) (24,25).

where Ke is the refractive index of the basic whitening layer; kab is the corresponding absorption coefficient spectrum of the leaf chlorophyll; kcar is the corresponding absorption coefficient spectrum of the leaf carotenoid; kbrown is the corresponding absorption coefficient spectrum of the leaf brown pigment; kw is the corresponding absorption coefficient spectrum of the leaf water; and km is the corresponding absorption coefficient spectrum of the leaf dry matter.
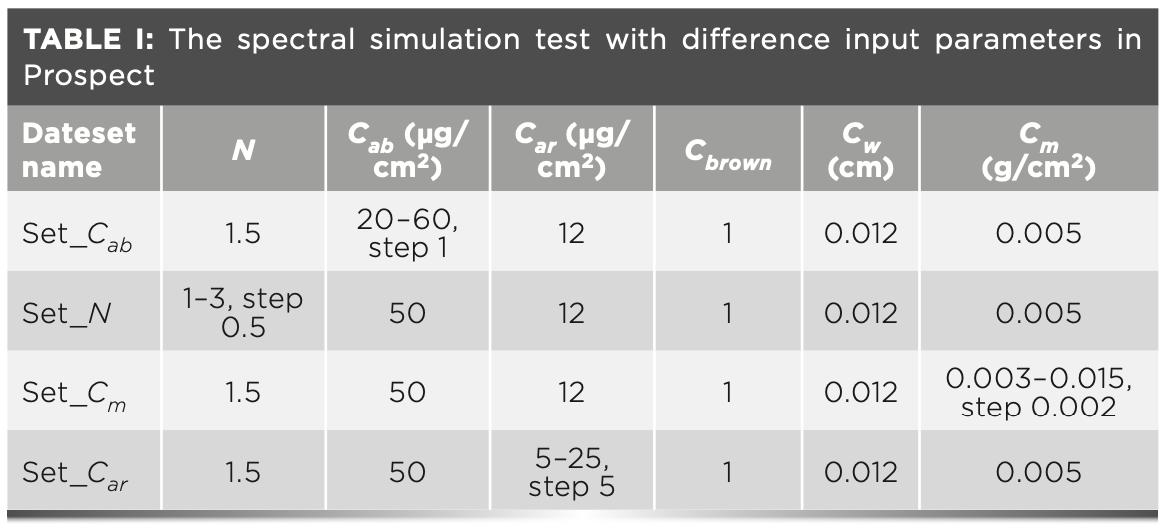
Ke, kab, kcar, kbrown, km, and kw were measured and fixed (23). Thus, the Prospect model had six input parameters, including the leaf structure (N), content of chlorophyll a+b (Cab), carotenoids (Car), brown pigment (Cbrown), equivalent water thickness (Cw), and dry matter content (Cm). Its output parameters were the reflectivity and spectral transmittance of the leaf ranging from 400 to 2500 nm, and the sampling interval was 1 nm.
According to different experimental purposes, the input parameters of the Prospect model are set, and the simulated data set with different biochemical components can be simulated. Four simulation data used in this paper, named Set_Cab, Set_N, Set_Cm, and Set_Car, are shown in Table I.
The sensitivity index, SI, is used for accuracy evaluation (equation 2) (26).

where VI is the calculated values of the spectral indices and |VI| is the absolute value. The smaller the SI, the smaller the influence of the component on the spectral index.
Lopex93 and Angers Measured Data Set
The Lopex93 database was established by the Joint Research Center (JRC) in 1993 (27). Approximately 70 leaf samples representations of more than 50 species were obtained. The database contains 62 samples of spectral data and chlorophyll content data, including 13 monocotyledons and 49 dicotyledons. Spectra were collected over the 400–2500 nm region with a sampling interval of 1 nm. The database not only takes into account the differences of different species, but also the changes of biochemical composition in time. It fully comprises the diversity of biochemical composition content and inner types of leaves. The database cannot only provide a more effective test for spectral index, but also serve as an ideal data source for analyzing the correlation between chlorophyll content and spectral reflectance of mixed species. The Lopex93 data set can be accessed free online (http://opticleaf.ipgp.fr/index.php?page=database).
The Angers database was established at the National Institute for Agricultural Research (INRA) in Angers, France, in June 2003 (23). Approximately 276 leaf samples representations of more than 39 species were obtained. The directional-hemisphere reflectance spectra were measured using an ASD FieldSpec spectrometer with a spectral range of 400–2500 nm and a data interval of 1.4 nm. The biochemical parameters include leaf chlorophyll content, carotenoids, specific leaf weight (SLW), and water content. The Angers data set can also be accessed free online (http://opticleaf.ipgp.fr/index.php?page=database).
Wavelet Analysis Method
Wavelet transform is an effective mathematical tool used to decompose the original spectral signal into multiple scales (28,29). The continuous wavelet transform (CWT) tool can make the wavelet shift smoothly to different positions; thus, each scale component can be compared directly to the input spectral reflectance, and more useful spectral information can be captured (30). In this study, the CWT wavelet analysis method was used in the spectral analysis method. The CWT is defined as follows in equation 3 (31),

where Wf is the signal to be analyzed; Ψ is a chose wavelet basis function, such as biorthogonal (bior), daubechies (db), coiflets (coif), or symlets (sym) (32); Ψa,b (λ) is the prototype to generate child wavelets by adjusting the scale parameter a (the corresponding decomposition frequency or band range) and b the translation factor (corresponding to the band position); λ is the wavelength; and dλ is the spectral resolution.
In this study, the spectral reflectance signal was processed by continuous wavelet transform, where f(λ) is the spectral reflectance value or absorption coefficient spectrum of the leaf. Commonly used continuous wavelet decompositions are selected as Ψ; a is the spectrum scale of 100 nm, 150 nm, and 200 nm; b is the band position which should be selected by analysis; λ is the wavelength that can be cut down by analysis; and dλ = 1 nm. After the CWT wavelet analysis, the coefficients are obtained, which can be used for singularity detection or periodic analysis. When the signal is projected into the wavelet transform domain, it is advantageous to extract some useful features.
Reconstruction of a New Leaf Spectral Index
To construct the new spectral index for the chlorophyll content of leaves, the relationship between the reflectance and biochemical components of the vegetation is built first. As is known, the summation of the spectral reflectance of the leaf (R), transmittance (T), and absorption (A), were constantly one. The shape of the leaf reflectance and transmittance were found to be similar in the visible and near- infrared (NIR) radiation, and could be expressed approximately as follows (33):

where α is a constant.
The spectrum absorption rate, A, could be expressed as:

By combining equation 1 with equation 5, the formula of the leaf spectrum reflectance rate (R) could be obtained.

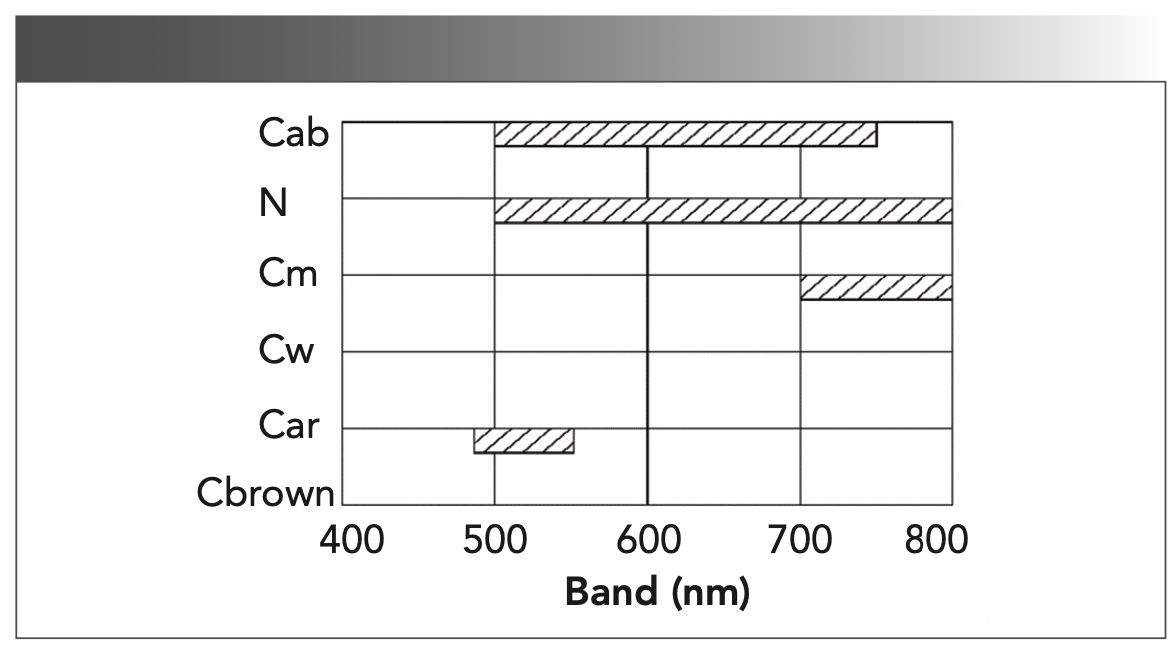
Different biochemical components have a different influence on the reflectance in the band 400–800 nm (the sensitive spectrum range of the chlorophyll). In the Prospect model, only one biochemical component was set with different ranges and the other input parameters were fixed to obtain many reflectance spectra, which were used to test the influence of the biochemical component on the reflectance. For example, to test the Cab in the band 400–800 nm influence on the reflectance in the Prospect model, Cab was set from 5 to 95 μg/cm2 (step size was 15 μg/cm2). The other input parameters were fixed (N = 1.5, Cw = 0.012 cm, Cm = 0.005g/cm, Car = 12 μg/cm2, and Cbrown = 1). Finally, seven reflectance spectra curves were obtained, which were used to find the band region where reflectance is changed with a different Cab. The test result is shown in Figure 1. The range of the influence for Cab was 500–750 nm, but the ranges of 400–500 nm and 750–800 nm were not an influence on the spectra. The range of influence for N was 500–800 nm, for Cm it was 700–800 nm, for Car it was 480–550 nm, but Cw and Cbrown did not change, and the content changes did not affect the spectral shape. We found that, in the range of 550–700 nm, the reflectance spectrum was affected only by chlorophyll Cab and N. Thus, to extract the main influence spectrum range of Cab and minimize the effect of the other components, the final sensitive band range of chlorophyll was determined to be from 550 to 700 nm. Then, equation 6 was further reduced as follows:

where b is a constant value, meaning Cm, Car, Cw, and Cbrown content changes do not affect the reflectance spectra.
FIGURE 1: The chlorophyll sensitive band areas (in nm) of different dataset contents. Abscissa is spectral band (nm) and ordinate is dataset spectra.
In mathematics, the result of CWT computation for constant value is 0. The calculated value of constant coefficients with CWT computation remains unchanged. Therefore, both sides of equation 7 are carried out with the CWT computation. At the same time, we can obtain equation 8

where the wavelet coefficients WR(a,b), Wke(a,b) and Wkab(a,b) are determined by scaling factor a, the specific band position b, and wavelet base function Ψ.
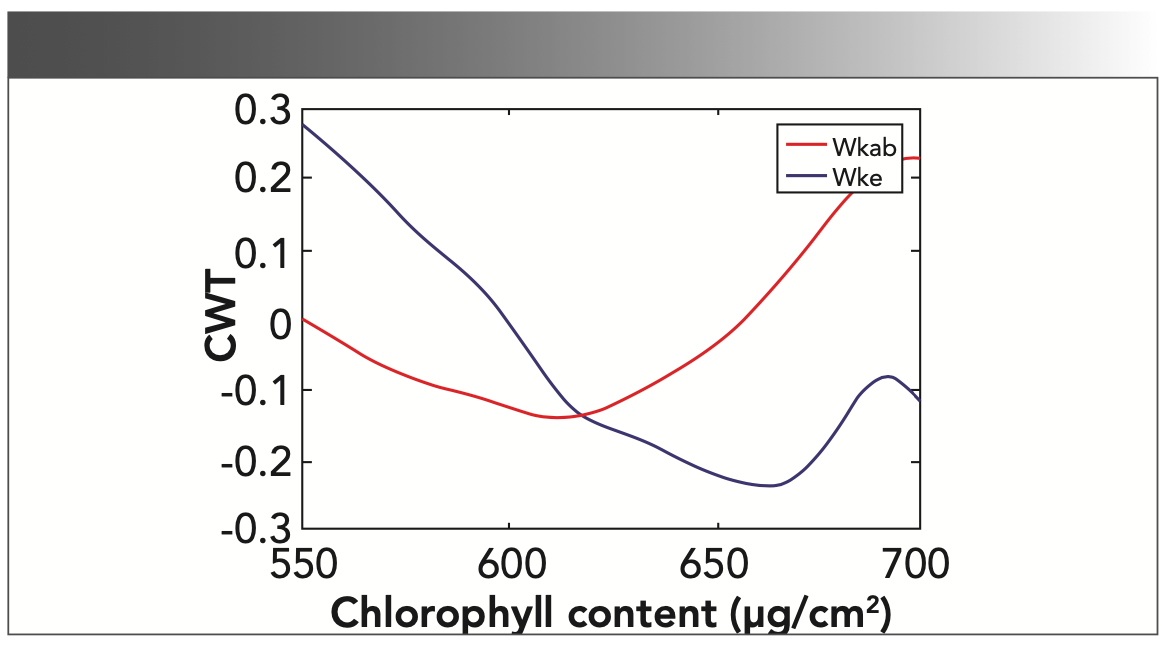
Finally, two factors were considered to determine the scale basis function and band position of the continuous wavelet decomposition in building the new spectral index. One factor was in the range of 550–700 nm, the CWT curve of the kab(a,b) should have a wave valley or wave peak at bands w1 and w2, where the chlorophyll absorption was sensitive. The other factor was that the CWT curve of Ke(a,b) should be approximately 0 at bands w1 and w2, eliminating or decreasing the influence of N on the reflectance spectrum. Through a large number of comparative experiments, in the selected band range from 550 to 700 nm, with a spectrum scale of 100 nm, 150 nm, and 200 nm, were conducted to Kab(a,b) and ke(a,b). We found that “bior1.1” with a spectrum scale of 150 nm can meet the two factors as shown in Figure 2. Thus, the wavelet base function Ψ was chosen as “bior1.1”, the wave spectrum scale, s, was 150 nm (a = 150 nm), the wave-peak w1 position was 699 nm, and the wave-valley w2 position was 613 nm (b = 699 nm and 613 nm).
FIGURE 2: The CWT curve Wkab (the blue line) and WKe (the red line) with spectrum scale a = 150 nm using wavelet function “bior1.1”.
At the wave-peak w1 and wave-valley w2, two formulas can be obtained using Formula 8.
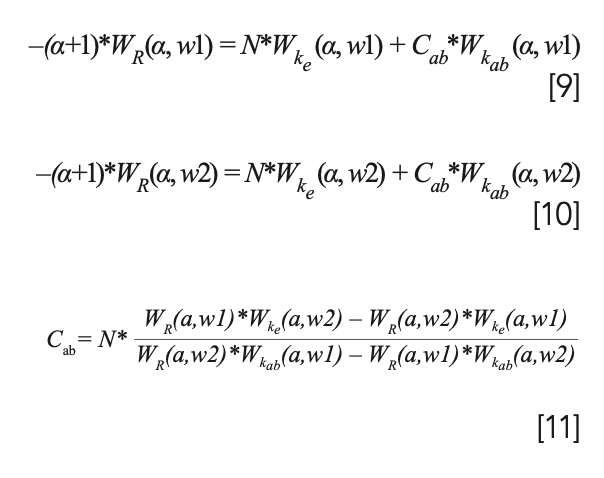
where w1 equals 699 nm, w2 equals 613 nm, a equals 150 nm, and the wavelet function is “rbio1.1”. According to Figure 2, we can obtain the wavelet coefficients Wkab and WKe as follows:

A new leaf chlorophyll content model, termed CAB1 with the wavelet function “rbio1.1,” was obtained as equation 12:

CAB1 is only affected by the parameter N. Then, for the same crop type during the same growth period, N was a fixed constant and CAB1 was only affected by the leaf spectrum reflectance rate.
The Spectral Indices Sensitive to Leaf Chlorophyll Contents
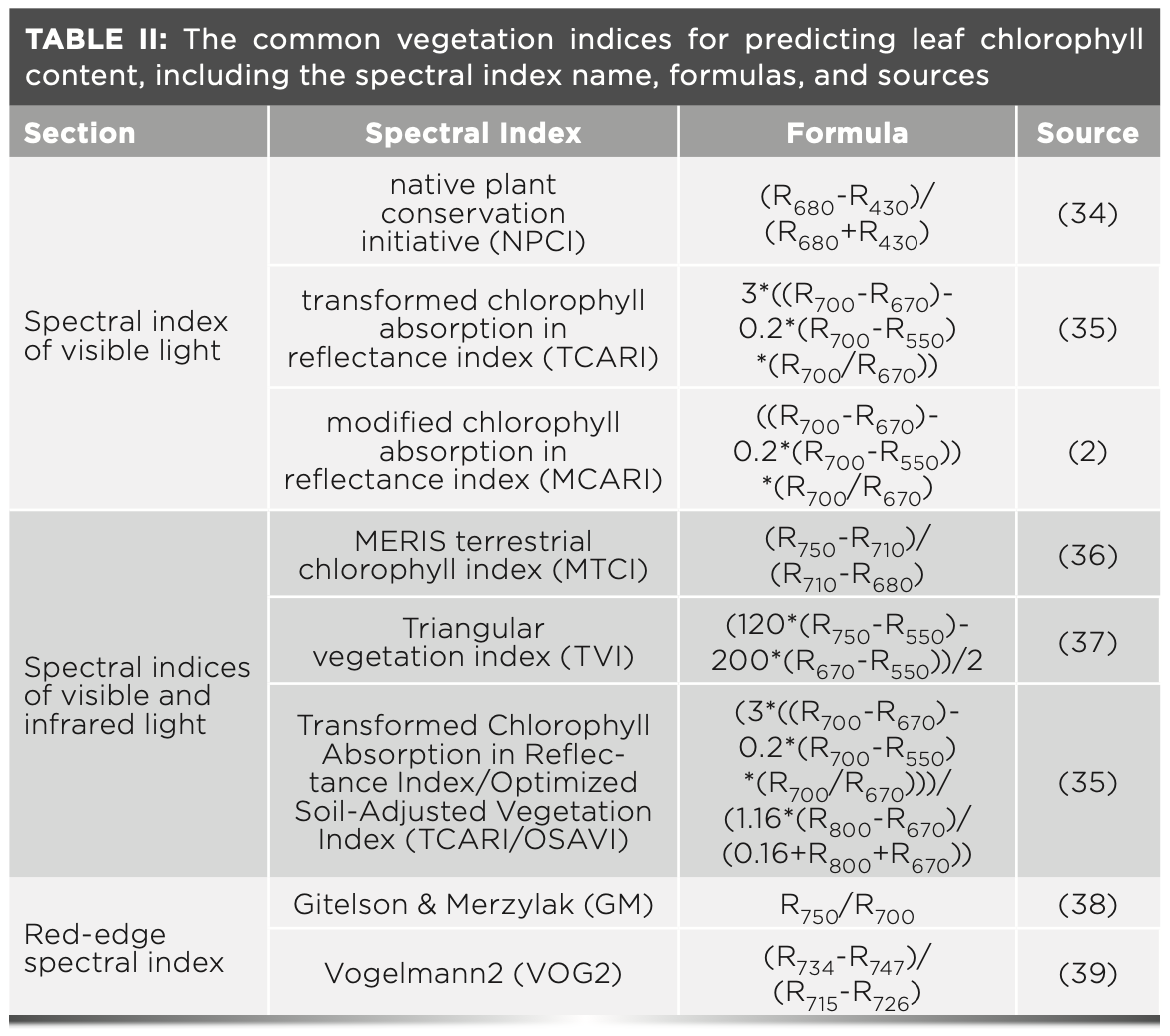
To test the established inversion model CAB1, eight commonly used spectral indices (Table II) sensitive to leaf chlorophyll contents were used for comparison, including the spectral index of visible light NPCI, TCARI, and MCARI; spectral indices of visible and infrared light MTCI, TVI, and TCARI/OSAVI; and red-edge spectral index GM and VOG2.
Results
Two aspects should be considered in the spectral index evaluation: The spectral index is sensitive to chlorophyll content, and it can resist the influence of other factors. First, the Prospect optical model was used to simulate the spectral curves with different chlorophyll content, and the advantages and disadvantages of each spectral index were analyzed. According to existing spectral indices (Table II), the band range was selected from 400 to 800 nm. According to the analysis in Figure 1, the influencing factors only included N, Cm, and Car. Finally, the Lopex93 and Angers real data were used to analyze the spectral index.
Spectral Indices Sensitivity for Leaf Chlorophyll Content Cab
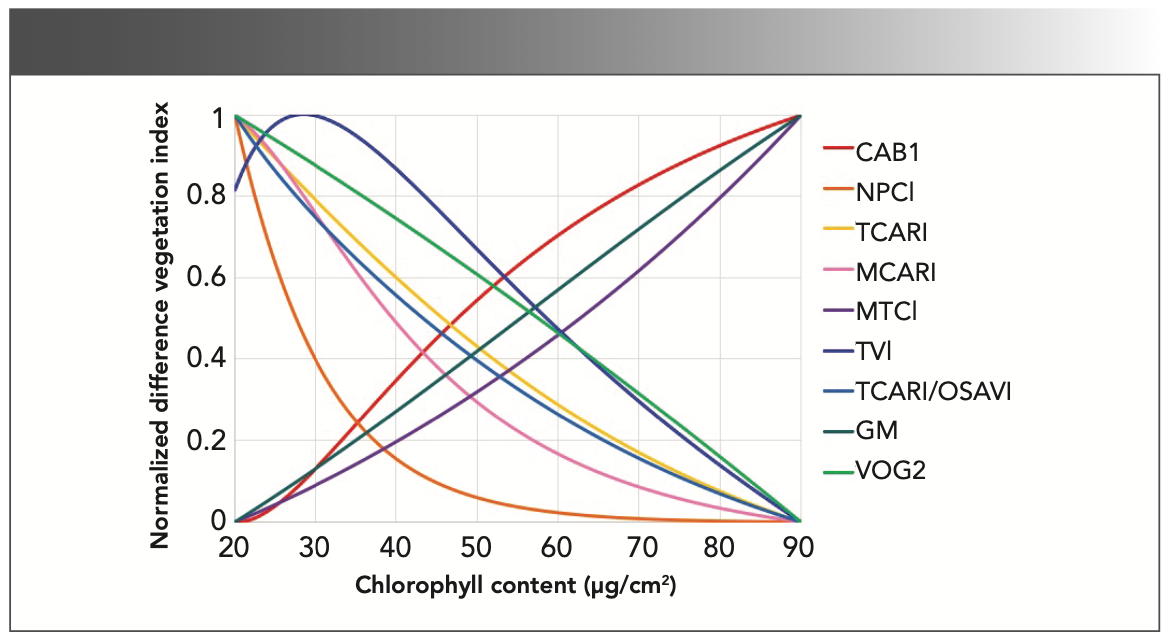
The data of Set_Car is used for spectral indices sensitivity for leaf chlorophyll content Cab. As shown in Figure 3, the values of CAB1, MTCI, and GM monotonously increase with the increase in chlorophyll content, and NPCI, TCARI, MCARI, TVI, TCARI/OSAVI, and VOG2 decrease. They have a good linear relationship with the chlorophyll content, and their R2 are greater than 0.9—except NPCI, R2 = 0.6371) (the first line of Table III)—indicating that these eight spectral indices have good sensitivity to different chlorophyll content. When the chlorophyll content was less than 30 μg/cm2, TVI exhibited an opposite monotonic feature compared to that when the content was greater than 30 μg/cm2, which indicates that when the Cab content is low (less than 30 μg/cm2), TVI is not suitable for retrieving leaf chlorophyll. Similarly, at a chlorophyll content of 40 μg/cm2, NPCI showed the opposite monotonic characteristics, and the curve gradually changed and usually became smooth, indicating that NPCI was easy to saturate.
FIGURE 3: Sensitivity analysis of hyperspectral vegetation indices on chlorophyll content.

Ability to Resist the Influences of Other Leaf Biochemical Components
The test result of Set_N is shown in Table III (the second line). The influence of N on the partial spectral index is large, such as NPCI, TCARI, MTCI, and TCARI/OSAVI. Under the same chlorophyll content, the MTCI value changed approximately 19 times when the N changed from 1 to 3, followed by NPCI, TCARI, and TCARI/OSAVI. The SI of VOG2, GM, and CAB1 are smaller, particularly the SI value of CAB1, which is only 34.87%.
The test result of Set_Cm is shown in Table III (the third line). The influence of Cm on the partial spectral index is small. Only the SI of TVI is over 10%. TCARI/OSAVI, NPCI, and CAB1 had the smallest SI values, particularly for CAB1, which had a SI value of only 0.56%.
The test result of Set_Car is shown in Table III (the fourth line). The influence of Car on the partial spectral index is very small. Only the SI of TCARI and TCARI/OSAVI are over 5%. The SI of CAB1, NPCI, MCARI, and TVI are approximately 2%, and the SIs of MTCI, GM, and VOG2 are all approximately 0%.
Spectral Index Verification with Lopex93 and Angers Data
Using the 190 Lopex93 reflectivity spectral data, the quadratic model of CAB1, TCARI, MTCI, and VOG2 were built. The 80 validation spectral data were used to verify the inversion chlorophyll content accuracy. For Angers data, 69 reflectivity spectral data were used to build the quadratic model of CAB1, TCARI, MTCI, and VOG2, and 60 validation spectral data were used as validation data. Because the structural parameter of the leaf N cannot be determined in the Lopex93 and Angers data, N is assumed to be the standard value, which is 2. The R2 and RMSE are used to evaluate their accuracy (Table IV). Validation results of chlorophyll estimations are done by the quadratic model of CAB1, TCARI, MTCI, and VOG2, which is shown in Figure 4.
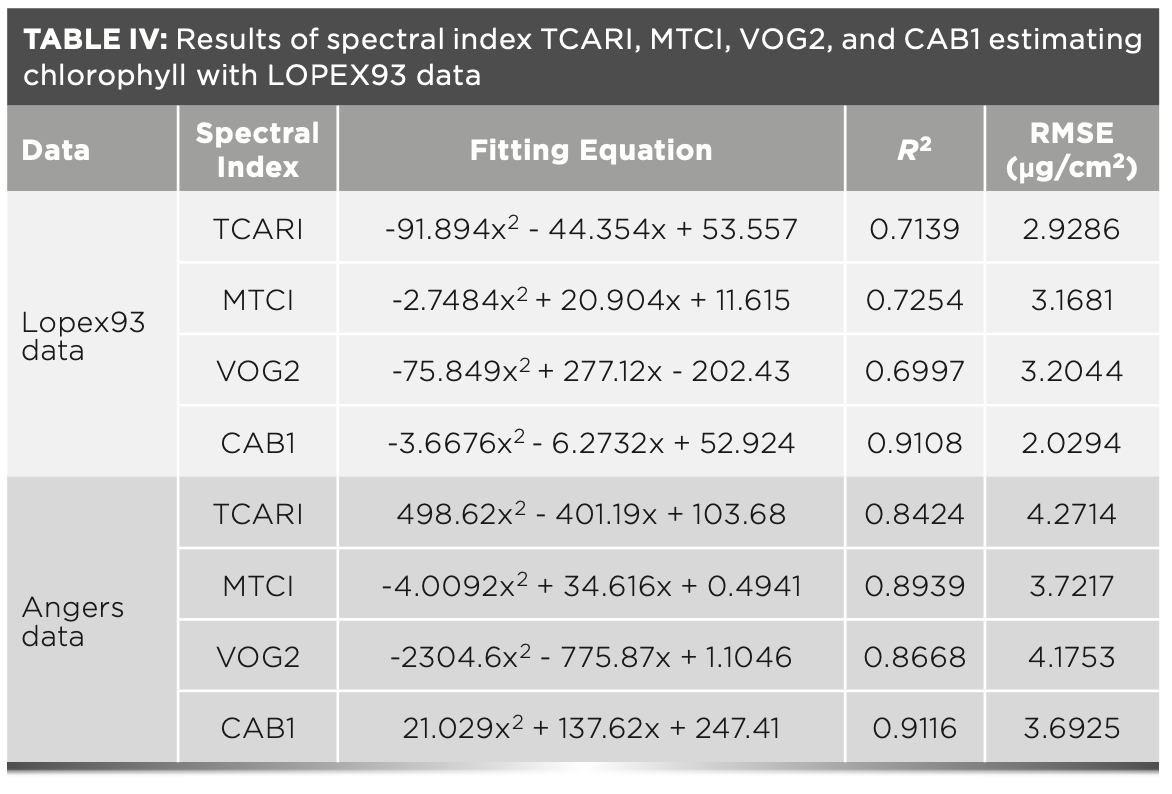
FIGURE 4: Validation results of chlorophyll estimation with Lopex93 data using various approaches: (a) TCARI, (b) MTCI, (c) VOG2, and (d) CAB1; and Angers data: (e) TCARI, (f) MTCI, (g) VOG2, and (h) CAB1.
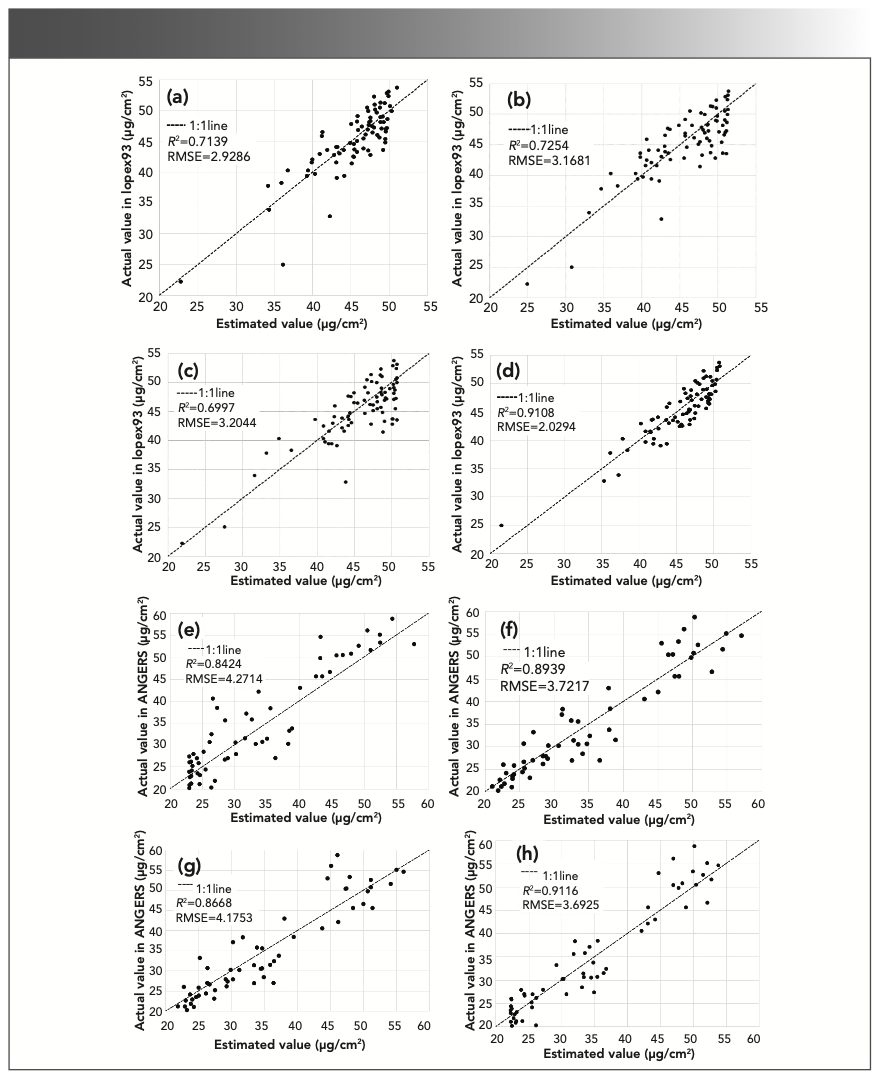
As shown in Table IV and Figure 4, the quadratic models of CAB1, TCARI, MTCI, and VOG2 with Lopex93 data have low RMSE (RMSE < 3.20). The R2 of MTCI is greater than 0.72, which is better than TCARI and VOG2. The R2 of CAB1 is 0.9108, and the RMSE values are smaller (RMSE = 2.0294). Compared with TCARI, MTCI, and VOG2, CAB1 is more accurate and robust.
The results of CAB1, TCARI, MTCI, and VOG2 estimating chlorophyll with Angers data are shown in Table IV and Figure 4. The quadratic models of CAB1, TCARI, MTCI, and VOG2 with Lopex93 data have high R2 (R2 > 0.84), which indicates that they have high accuracy for chlorophyll estimation. The R2 of MTCI is greater than 0.89, which is better than TCARI and VOG2. The R2 of CAB1 is 0.9116, and the RMSE values are smaller (RMSE = 3.6925). Compared with TCARI, MTCI, and VOG2, CAB1 is more accurate and robust.
From the analysis of two sets of data, it was found that the R2 of CAB1 was the highest, and the RMSE was the smallest among the four spectral indexes, indicating that CAB1 performs the best.
Discussion
The Performance of Wavelet Analysis Method with Prospect Model in the Reconstruction of Leaf Spectral Index
As shown in equation 8 using the spectral analysis method, the spectral reflectance is limited to 700–800 nm, and the inversion of chlorophyll content has only two important factors: N and Cab. By using continuous wavelet decomposition, the spectral energy can be decomposed to find the band position with the largest Cab effect and the smallest N effect, thus providing the possibility of constructing a new spectral index for chlorophyll inversion (Figure 2).
The Prospect model starts with spectral and vegetation components and has a strong theoretical basis. Therefore, the spectral index is constructed step-by-step based on the Prospect formula, which has sufficient theoretical basis. However, the results are still affected by N (equation 12). Although the experimental results show that the effect of N on CAB1 is relatively small, the accuracy of vegetation index would be further improved if the specific value of N can be obtained from the measured data. In addition, the model used in this experiment was Prospect-5, which does not separate chlorophyll from anthocyanin, resulting in a greater impact of Car, shown in Table III (the fourth line). With the refinement of the Prospect model, the accuracy of building a new vegetation index is expected to be further improved.
The Performance of the CAB1 Method in the Estimation of Leaf Parameters
From the Prospect simulation data, CAB1 is in the upper and middle reaches, shown in Table III. Through the aforementioned analysis, the spectral index on the sensitivity of chlorophyll content and ability to resist the influences of other components such as the structure of mesophyll, dry matter, and carotenoids, were summarized to estimate the effectiveness of assessing chlorophyll content. The comprehensive evaluation index (Ava) is defined as follows:

where R2 is the spectral sensitivity of the biochemical components, as represented by the index trend line fitting degree value R2 (Table III); 1 − SI% is the ability of spectral indices to resist other biochemical components (SI% are selected in Table III); P, Pi ... Pi+n are the influence weights for each biochemical component, which were set at 1. When the Ava of the spectral index is higher, the ability to resist the influence of other components is stronger, indicating that the spectral index comprehensive ability is stronger.
Table III shows that NPCI, TCARI/ OSAVI, and MCARI have the low Ava value and are not suitable for evaluating chlorophyll content in a vegetation leaf. MTCI and TVI comprehensive evaluations are medium, and they have a certain guiding role for the particular vegetation or a certain period of growth of vegetation but are not used for all vegetation. The Ava values of CAB1, GM, and VOG2 are higher (greater than 0.8), and the models are sensitive to chlorophyll content and are relatively stable. The CAB1 integrated capacity evaluations were equivalent to model sensitivity and stability optimum. CAB1 is based on the Prospect model, so using Prospect simulation data can explain the status quo of the vegetation index. Although CAB1 does perform relatively well based on the Lopex93 and Angers data validation, more measured data are needed for further validation.
Conclusions
This study generated a new spectral index, named CAB1, to estimate the chlorophyll content of a vegetation leaf. Based on the Prospect optical model, the continuous wavelet analysis method was used to establish the CAB1 model, in which the “rbio1.1” wavelet basis function with a scale of 150 nm, as well as reflectance spectra for 613 and 619 nm, were selected. The CAB1 model is derived from the Prospect model, so the CAB1 model has a strict physical meaning. The practical adaptability of some spectral indices, which are based on statistics, was the biggest disadvantage. CAB1 is not based on statistics, but instead on the theory of real light propagation, which is more adaptable.
A good chlorophyll vegetation index should be sensitive to chlorophyll while simultaneously not being sensitive to other factors. To verify the adaptability of CAB1, a comparison was made with eight commonly used spectral indices. According to the Prospect model, the data describing the relationship between the leaf spectrum and the content of each component were simulated. A comparison of the chlorophyll sensitivity and resistance to the mesophyll structure, dry matter, and carotenoid content of the CAB1 model and the common chlorophyll spectral indices was examined. MCARI was found to perform the worst (Ava = -3.7600). MCARI is very sensitive to the chlorophyll content but also to other components such that it is only suitable for retrieving the chlorophyll content of the same vegetation leaf within a single period. The VOG2, GM, and CAB1 models performed the best (Ava > 0.8) because they can retrieve the chlorophyll content of any vegetation leaf with high accuracy. To verify this conclusion, the actual data of Lopex93 and Angers were selected. CAB1 (proposed method), TCARI (spectral index of visible light), MTCI (spectral indices of visible and infrared light), and GM (red edge spectral index) were selected to retrieve the chlorophyll content of vegetation leaves using the Lopex93 and Angers data. Based on the actual data, MTCI, TCARI, and VOG2 were found to have moderate inversion accuracy (the maximal R2 is 0.8), which may be because of noise in the actual data. However, CAB1 offers a high level of accuracy (R2 > 0.9), which indicates the CAB1 model is not only more accurate than the other vegetation indexes, but is also very stable. Overall, CAB1 performed well in the leaf layer compared to the commonly used spectral indices NPCI, TCARI, and MCAI in visible regions, and CAB1 is comparable to the red edge spectral index GM and VOG2.
This research was based on the Prospect model simulation data. Because of the influence of the accuracy of the model, and given that the experimental data may be slightly different, the universality of the research results must be further verified. However, the results of this study provide some pointers for combining the physical model and the spectral index method.
Funding Information
This work was supported by the Joint Innovative Center for Safe and Effective Mining Technology and Equipment of Coal Resources, Shandong Province, and Scientific Research Foundation of Shandong University of Science and Technology under Grant [2014TDJH101]; Scientific and Technological Planning Projects of Colleges and Universities in Shandong Province under Grant [J18KA214]; and Funded by Beijing Key Laboratory of Urban Spatial Information Engineering [2019209].
Acknowledgment
We thank the SDUST Laboratory for the use of their equipment. The authors also thank the editor and anonymous referees for their insightful comments, which improved this paper.
References
(1) E. Boegh, H. Soegaard, and A. Thomsen, Remote Sens. Environ. 79(2–3), 329–343 (2002).
(2) C.S.T. Daughtry, C.L. Walthall, M.S. Kim et al., Remote Sens. Environ. 74(2), 229– 239 (2000).
(3) Z. Liangpei, Hyperspectral Remote Sensing (Wuhan University Press, Wuhan, China, 2011).
(4) S.T. Brantley, J.C. Zinnert, and D.R. Young, Remote Sens. Environ. 115(2), 514–523 (2011).
(5) E.R. Hunt, P.C. Doraiswamy, J.E. Mcmurtrey, et al., Int. J. Appl. Earth. Obs. 21(1), 103–112 (2013).
(6) B. Datt, Remote Sens. Environ. 66(2), 111–121 (1998).
(7) A.A. Gitelson, Y. Gritz, and M.N. Merzlyak, J. Plant Physiol. 160(3), 271–282 (2003).
(8) A.A. Gitelson, G.P. Keydan, and M.N. Merzlyak, Geophys. Res. Lett. 33(11), 431–433 (2006).
(9) D. Haboudane, J.R. Miller, N. Tremblay, et al., Remote Sens. Environ. 81(2–3), 416–426 (2002).
(10) G.A. Carter and B.A. Spiering, J. Environ. Qual. 31(5), 1424–1432 (2002).
(11) G.L. Maire, C. FranOis and E. Dufrêne, Remote Sens. Environ. 89(1), 1–28 (2004).
(12) J.R. Miller, E.W. Hare, and W.U., Int. J. Remote Sens. 11(10), 1755–1773 (1990).
(13) Y. Chun-Yan, N. Zheng, W. Ji-Hua, et al., J. Remote Sens. 9, 742–750 (2005).
(14) I. Baek, M. Kim, and B.K. Cho, et al., Applied Sciences 9(5), 1027–1038 (2019).
(15) J. Sun, Y. Shishou, J. Yang, et al., Remote Sens. Environ. 212, 1–7 (2018).
(16) S. Jacquemoud and F. Baret, Remote Sens. Environ. 34(2), 75–91 (1990).
(17) T.P. Dawson, Remote Sens. Environ. 65(1), 50–60 (1998).
(18) B.D. Ganapol, Remote Sens. Environ. 63(2), 182–193 (1998).
(19) H.L. Jiang, L.F. Zhang, H. Yang, et al., Spectrosc. Spect. Anal. 36(1), 169–176 (2016).
(20) H. Wang, R.H. Shi, P.D. Liu et al., Spectrosc. Spect. Anal. 36(7), 2189–2194 (2016).
(21) Y.H. Zhang, Acta Ecologica Sinica. 33, 876–887 (2013).
(22) W.A. Allen, J. Opt. Soc. Am. 63(6), 664–666 (1973).
(23) J.B. Feret, C. FranOis, G.P. Asner, et al., Remote Sens. Environ. 112(6), 3030–3043 (2011).
(24) L. Liu, B. Song, and S. Zhang, Remote Sens. 9(11), 1113–1137 (2017).
(25) S. Jacquemoud, S.L. Ustin, J. Verdebout, et al., Remote Sens. Environ. 56(3), 194–202 (1996).
(26) R. Shi, D. Zhuang, and Z. Niu, Chinese Journal of Ecology 25, 591–595 (2006).
(27) B. Hosgood and G. Andreoli, Leaf Optical Properties Experiment 93 (LOPEX93) (Publications office of the Joint Research Centre: European Commission/Institute for Remote Sensing Applications, 1994).
(28) S. Mallat, IEEE Transactions on Pattern Analysis & Machine Intelligence 11, 674–693 (1989).
(29) D. Chen, B. Hu, X. Shao, et al., Analyst 129(7), 664–669 (2004).
(30) Q. Liao, J. Wang, G. Yang, et al., J. Appl. Remote Sens. 7(1), 3575–3587 (2013).
(31) Y. Guo, Y. Zhou, and J. Tan, J. Thorac Bio. 370, 116–120 (2015).
(32) M.S. Bargh, Wavelet Transform and its Application in the Decomposition and Reconstruction of Signals (Eindhoven University of Technology, Eindhoven, The Netherlands, 1994).
(33) E.B. Knipling, Remote Sens. Environ. 1(3), 155–159 (1970).
(34) J. Peñuelas, J. A. Gamon, A. L. Fredeen et al., Remote Sens. Environ. 48(2), 135–146 (1994).
(35) F. Meggio, P.J. Zarco-Tejada, L.C. Núuez et al., Remote Sens. Environ. 114(9), 1968–1986 (2010).
(36) J. Dash and P.J. Curran, Int. J. Remote Sens. 25, 5403–5413 (2004).
(37) N. H. Broge and E. Leblanc, Remote Sens. Environ. 76(2), 156–172 (2001).
(38) A. Gitelson and M.N. Merzlyak, J. Plant Physiol. 143(3), 286–292 (1994).
(39) P.J. Zarco-Tejada, J.R. Miller, T.L. Noland, et al., IEEE Transactions on Geo. & Remote Sens. 39(7), 1491–1507 (2001).
Feifei Xie and Lin Sun are with the State Key Laboratory of Mining Disaster Prevention and Control at Shandong University of Science and Technology in Qingdao, China. Xie and Fengzhu Liu are with the Beijing Key Laboratory of Urban Spacial Information Engineering, in Beijing, China. Jie Wang is with Inner Mongolia University in Hohhot, China. Liu is also with the Beijing Institute of Surveying and Mapping, Beijing, China. Direct correspondence to: xff@sdust.edu.cn ●
NIR Spectroscopy Explored as Sustainable Approach to Detecting Bovine Mastitis
April 23rd 2025A new study published in Applied Food Research demonstrates that near-infrared spectroscopy (NIRS) can effectively detect subclinical bovine mastitis in milk, offering a fast, non-invasive method to guide targeted antibiotic treatment and support sustainable dairy practices.
New AI Strategy for Mycotoxin Detection in Cereal Grains
April 21st 2025Researchers from Jiangsu University and Zhejiang University of Water Resources and Electric Power have developed a transfer learning approach that significantly enhances the accuracy and adaptability of NIR spectroscopy models for detecting mycotoxins in cereals.
Karl Norris: A Pioneer in Optical Measurements and Near-Infrared Spectroscopy, Part II
April 21st 2025In this two-part "Icons of Spectroscopy" column, executive editor Jerome Workman Jr. details how Karl H. Norris has impacted the analysis of food, agricultural products, and pharmaceuticals over six decades. His pioneering work in optical analysis methods including his development and refinement of near-infrared spectroscopy, has transformed analysis technology. In this Part II article of a two-part series, we summarize Norris’ foundational publications in NIR, his patents, achievements, and legacy.