Multimodal Multiplex Raman Spectroscopy
In conventional designs for dispersive Raman spectrometers, there is a tradeoff between spectral resolution and light throughput. A new design approach using Multimodal Multiplex (MMS) technology provides approximately 12x the throughput of a conventional slit-based system with no compromise in spectral resolution. This translates into a signal-to-noise advantage of greater than 3.5x for equivalent measurement times. In addition, the wide area aperture is ideally suited to large sample spot illumination, which yields measurements that are more representative of the bulk of the sample being analyzed.

Over the last 10 years, advances in diode laser, optical filter, and array detector technologies have enabled a new generation of high-performance Raman spectrometers. In the past, these spectrometers employed either "pinhole" or slit entrance apertures coupled with reflective or transmissive gratings to disperse the emitted light. Detection is most often accomplished using either linear or two-dimensional (2-D) CCD array detectors. To achieve useful spectral resolution, the entrance aperture is usually fixed at 50–100 μm. This entrance aperture constraint results in compromises in optical designs and light collection efficiency. Recently, analytical spectrometers using multimodal multiplex spectroscopy (MMS) technology have been introduced. MMS spectrometers employ wide area, binary encoded apertures, and computational transforms to greatly improve sensitivity without compromising spectral resolution.
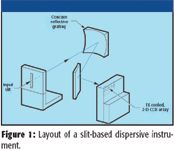
Figure 1
Traditional dispersive spectrometer designs use a fiber-based "pinhole" input or, more commonly, a vertical slit that is imaged on a 2-D CCD detector to increase sensitivity. A typical layout of a slit-based dispersive instrument is shown in Figure 1. The dispersive element produces a wavelength-dependent shift of the image of the input slit.
Because each spectral channel must correspond to a unique shift, the spectral width of a resolution element is directly proportional to the slit width. This relationship provides the challenge to spectroscopy in real world conditions. To achieve a reasonable spectral resolution, the input slit to the spectrometer must be narrow. However, because the light source is generally wide relative to the slit, only a small percentage of the total light can be properly focused into the spectrometer. The relationship between the slit image and the resulting spectrum is shown in Figure 2. If the sources of light are weak as well as diffuse — such as is the case in Raman measurements — then the detector can be so photon starved that no usable spectral measurement is possible. In these traditional designs, there is an inherent tradeoff between resolution and light throughput. While spectral resolution increases as slit width decreases, a narrow input slit greatly limits the light throughput and as a result greatly reduces the signal-to-noise ratio (S/N) of the measurement.
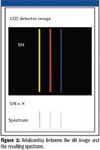
Figure 2
In contrast, an MMS-based spectrometer samples several thousand optical channels simultaneously through a coded aperture instead of a slit. Then proprietary mathematical algorithms are used to precisely reconstruct the spectral content of the source. The layout of a typical MMS spectrometer is shown in Figure 3. This example uses a dispersive grating geometry with a coded aperture in place of a traditional slit. Light enters the system through the coded aperture and is collimated onto the grating by a collimating mirror or lens.
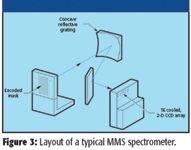
Figure 3
The grating spectrally disperses the light, which is then mapped onto a 2-D detector array such as a CCD. The dispersive element could be a reflective holographic grating or a transmissive volume phase hologram depending upon the spectral range and other system design parameters. The MMS Raman spectrometer uses a transmissive grating design. Using the MMS spectrometer, both resolution and throughput (etendue) can be maintained and optimized. The relationship between the encoded aperture and the resulting spectrum is shown in Figure 4. In the case of the MMS spectrometer, the three spectral features as shown in the slit-based example each form images of the wide area aperture at the detector.

Figure 4
High resolution with high sensitivity is achieved even though the mask images are overlapped — as is the case when there are closely spaced spectral features (Figure 5). The most dramatic MMS performance advantage is realized when making difficult measurements. These difficult measurements include measuring weak, scattering, and diffuse sources. These types of samples are particularly challenging for conventional sensors to measure because the light collection efficiency is extremely low and, thus, the measured spectral features are of low S/N or are not detected at all. MMS systems inherently alleviate these problems.
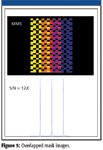
Figure 5
For a slit-based system to have an S/N that is equivalent to that of an MMS-based system, the slit would have to be very wide to admit comparable light. When the slit is wide, the ability to resolve closely spaced spectral features is compromised because the slit images overlap. In the example shown in Figure 6, the widened slit results in the inability to resolve the spectral features.
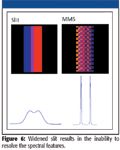
Figure 6
The matrix computations used in the MMS system deconvolve the information in the encoded wide area mask image, preserving the resolution while achieving a high S/N. Theory predicts the throughput of an MMS system to be about 800 times that of a fiber-based system and 12 times that of a slit system with equivalent resolution. To validate the theory, data were collected from a 785-nm Raman spectrometer using identical optical and electronic components with only changes to the input aperture. The results obtained from a toluene sample comparing pinhole, slit, and MMS approaches are shown in Figure 7. MMS-based spectrometers can cover any spectral range from the UV well into the near infrared, including emission measurements such as Raman and fluorescence. The MMS approach provides extreme sensitivity with uncompromised resolution and represents a paradigm shift in molecular spectroscopy.

Figure 7
In addition to providing higher sensitivity, the MMS wide area aperture approach also is suited ideally to large area sampling. Typical Raman spectrometers use an illumination spot size of around 100–150 μm. Many samples are not homogeneous over such a small area and, as a result, the measured spectrum might not be representative of the bulk of the sample. As an example, a surface-enhanced Raman substrate was measured using a conventional Raman spectrometer with a spot size of about 100 μm versus an MMS system with a sample spot size of 2 mm. A photomicrograph of the substrate is shown in Figure 8. A series of spectra were collected across the sample using 500-μm steps. The results obtained using the conventional spectrometers are shown on the left side of Figure 9. The spectral intensities show a wide variation as a result of the surface variations. The MMS spectrometer results are shown on the right side of the figure. The much larger illumination spot size results in more reproducible spectra. These results also demonstrate the improvement in S/N that results from using the MMS approach.
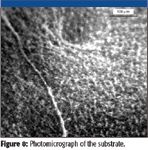
Figure 8
The large area sampling capability of the MMS Raman spectrometer is also advantageous when monitoring the composition of compressed powdered samples such as pharmaceutical tablets. Figure 10 shows the spectra of surface coated and uncoated acetaminophen tablets along with the difference spectra obtained by subtracting the spectrum of the uncoated tablet from that of the coated tablet and by subtracting the spectrum of one side of the coated tablet from the opposite side. The difference spectrum indicates that coating material exhibits Raman features at 638 and 518 cm-1, while the difference spectrum between the sides of the coated tablet indicates a small difference in the degree of coating coverage side-to-side. The relatively large sampling area, 400X larger than that measured by a typical Raman spectrometer using a 100-μm sample spot, assures that the measured spectra are representative of the entire surface.

Figure 9
The MMS-based Raman spectrometer provides approximately 12X the throughput of a conventional slit-based system with equivalent resolution. This translates into an S/N advantage of greater than 3.5X for equivalent measurement times. In addition, the wide area aperture is ideally suited to large sample spot illumination that yields measurements that are more representative of the bulk of the sample being analyzed. The MMS Raman system is available from Ocean Optics.

Figure 10
M. Fuller, P. Potuluri, and M. Sullivan are with Centice Corporation, Durham, North Carolina.

Nanometer-Scale Studies Using Tip Enhanced Raman Spectroscopy
February 8th 2013Volker Deckert, the winner of the 2013 Charles Mann Award, is advancing the use of tip enhanced Raman spectroscopy (TERS) to push the lateral resolution of vibrational spectroscopy well below the Abbe limit, to achieve single-molecule sensitivity. Because the tip can be moved with sub-nanometer precision, structural information with unmatched spatial resolution can be achieved without the need of specific labels.
Tomas Hirschfeld: Prolific Research Chemist, Mentor, Inventor, and Futurist
March 19th 2025In this "Icons of Spectroscopy" column, executive editor Jerome Workman Jr. details how Tomas B. Hirschfeld has made many significant contributions to vibrational spectroscopy and has inspired and mentored many leading scientists of the past several decades.