NIR Chemical Imaging for Counterfeit Pharmaceutical Products Analysis
NIR chemical imaging provides a rapid method for detecting and comparing suspected counterfeit pharmaceutical products with no sample preparation.

Counterfeit pharmaceutical products are a threat to global public health, patients, and the pharmaceutical industry. Consumers might be using a drug without the proper dosage or even without the proper ingredients, resulting in deterioration of their illness and potentially disability and death. Public health is threatened by the development of resistant strains of infectious agents. The industry is threatened by damage to its reputation resulting from the devastation caused by counterfeit versions of medicines, as well as the reduced sales when counterfeits replace legitimate product in the supply chain. Generally, counterfeit products are described as those containing the correct ingredients, but having been manipulated in an uncontrolled manner (for example, fake packaging), those containing the wrong active ingredients, and finally, those not containing any active ingredient at all. In all cases, the risk for the patient is important; although a product made with the correct ingredients might appear less harmful that one made with the wrong ingredients, its potency could be altered if the product has passed its expiration date, for example, or the dose level might be incorrect in a counterfeit product.
Currently, the most timely and practical way of identifying counterfeit medicines in the marketplace is the routine checking of packaging and use of covert markers and security features such as holograms. As soon as suspect counterfeit medicines have been sighted in the marketplace, they are further analyzed in the laboratory to confirm that they are counterfeit and to assess the potential harm that they might cause to patients.
Traditional methods of analysis for suspect counterfeit drug products include chromatographic assays for purity, potency, and content uniformity, and the laborious dissolution testing (which basically represent the QA/QC testing normally carried out on genuine drug products). A review of the analysis of counterfeit medicines by Olsen and colleagues (1) and Deisingh (2) showed a variety of analytical techniques being employed. There has been quite some interest in using near-infrared (NIR) spectroscopy (3–6). Recent work published by the USFDA (7) pointed to the additional information contained in NIR chemical images of tablets purchased on the Internet, and the potential value of this additional knowledge in qualifying both the potency and the quality of the formulation as a whole. The latter is generating increasing interest as a novel approach providing improved control of manufacturing of pharmaceutical products through a better understanding of the products themselves as a part of the Process Analytical Technology initiative (8) put forward a few years back by the USFDA.
In this work, we describe the use of NIR-chemical imaging (NIR-CI) using a focal plane array detector for the identification and characterization of counterfeit drug products. The analysis is performed solely using tablets of genuine origin as neither controls nor calibration procedures requiring prepared samples are necessary.
Materials and Methods
Drug Products
A total of 30 tablets of an antimalarial drug, all white, cylindrical, scored on one side, and embossed with the trade name on the other side, were investigated. Of these, 10 tablets were recognized as genuine tablets, obviously containing the right active pharmaceutical ingredient (API) (G); seven counterfeit tablets contained paracetamol (acetaminophen) as substitute API (P); and 13 counterfeit tablets contained another substitute API (A). The tablets were analyzed whole, without any sample preparation.
Some genuine tablets and tablets containing paracetamol as substitute API were imaged in the blister pack.
Instrumentation
A Spectral Dimensions NIR-CI2450 spectrometer (Malvern Instruments, Olney, Maryland) equipped with an InSb focal plane array detector (320 × 256 pixels) was used for this work. Image cubes of each tablet were acquired in the spectral range 1400–2400 nm at 10-nm steps and the field of view was set to 12.8 mm × 10.2 mm; this field of view encompasses approximately 80% of the area of the tablet and provides a pixel magnification of 40 μm. A set of tablets of unknown identity were positioned on a single sample slide and an image cube of the whole set was acquired at a magnification of 125 μm/pixel. All data were acquired in diffuse reflectance, a process by which the source radiation interacts with the surface of the sample, and the radiation diffusely reflected in the direction of the camera is measured. This sampling method is optimal for pharmaceutical products because samples can be analyzed intact and therefore are still available for testing with other methods. Dark and bright background image cubes were acquired at initiation followed by successive sample cubes. One image cube was acquired from each sample. Each image cube contained 81,920 full NIR spectra and required a collection time of approximately 3 min.
In another experiment, using the largest field of view available, 33 mm × 41 mm, corresponding to a resolution of 125 μm/pixel, a genuine blister strip and a counterfeit one were imaged side by side. This allowed two tablets of each blister to be in the field of view. Again, data collection time was approximately 3 min for the sample (dark and background cubes having been acquired previously).
All data were analyzed with ISys 4.0 software (Malvern Instruments). Sample data were converted to absorbance according to the following equation:
A = log 1/R
where A = absorbance and R = reflectance as obtained by processing the sample (S), dark (D), and background (B) image cubes as follows: R = (S - D)/(B - D).
Data Analysis
Principal component analysis (PCA) was selected for the first assessment of the image cubes (9). PCA is an unsupervised multivariate analysis method that compares spectra over the entire spectral range within a data cube and separates spectral features that explain the variance in the data regardless of its origin. The variance described by the first principal component, which is the largest, is removed from the data before the second principal component is calculated, and so on. Most often, the largest variance comes from physical differences, while the smallest variance is associated with noise. Each component in a PCA is represented by a loading vector and a score image. Loading vectors can be compared with individual spectra, which permits an identification of sample components (ingredients) contributing to each loading vector. The scores image then becomes a representation of the spatial distribution of the ingredients in the sample. The PCA was developed as follows: The spectra from all image cubes were mean centered and scaled to unit variance. A small number of spectra (2500) from each image were combined for a total data set containing 75,000 spectra. Principal component-loading vectors were calculated from this set and used to calculate principal component scores for each pixel in all sample image cubes.
A more directed approach, partial least squares (PLS), was used to investigate the formulation of the tablets in greater detail. PLS is a supervised multivariate analysis method that compares spectra over the entire spectral range within a data cube to extract successive linear combinations of the predictors that optimally explain both response and predictor variation. The predictors are training spectra gathered in a library, where a class contains multiple spectra (repeat measurements acquired at once in an image) from a single pure component. Spectra contained in the tested tablets were used to build the library, without any classification calibration standards being required. The advantage of this approach is to eliminate the need to gather separate libraries of pure components in instances where the actual ingredients used in the samples of interest are not available. The validity of using internal references is discussed further with the results.
For the large field of view experiment carried out on the tablets in the blister strip, PCA was applied to discriminate genuine from counterfeit tablets.
Results and Discussion
Tablet Identification
The analysis of the NIR chemical images was undertaken with only a priori knowledge of which tablets contained which (substitute) API. No reference spectra were available, so a PCA, a form of unsupervised data analysis, was undertaken. A four-component PCA was calculated. The first three score images show a contrast between the tablet types, while the fourth score image highlights a significant difference in the tablet located in column 1, row 4, from all other tablets. A difference is also seen for this tablet in the second principal component score image. Figure 1 shows the second principal component score images for all 30 tablets; the letter in each tablet indicates its known identity. Note that the tablet in row 5, column 2, had inadvertently been mislabeled as containing substitute API (A), but it actually contained the right API and was an authentic tablet, which PCA does classify it with.
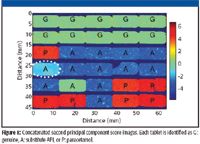
Figure 1.
The color in the score image is a good visual indicator of differences, but the statistical distribution of the scores at each pixel represented in a histogram plot provides a wealth of additional information. The histogram plot is possibly the most useful approach available in chemical imaging analysis and is often used in conjunction with image processing software.
In Figure 2, the histogram displays the score distribution of all pixels contained in the matrix of 30 tablets (gray histogram). Correlating each score "peak" with the spatial positions they arose from in the image reveals that each peak is actually an individual score distribution for a type of tablet. The mean of each distribution (each peak) corresponds to the mean score for the loading for this type of tablet. The standard deviation is a measure of the spread of the data about the mean. Narrow bands, such as the two tall distributions on the left, have a low standard deviation. In the analysis of a tablet, a high standard deviation often indicates heterogeneity, but it does not provide any indication about the prevalence of high or low values. Skew and kurtosis complement the information provided by the standard deviation.
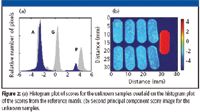
Figure 2.
The statistical characterization of the distribution is most valuable when all the pixels considered arise from one type of sample. In the present situation, the three types of tablets produce scores that differ significantly by their means. These can be used for comparison with scores obtained from unknown samples in order to predict which type of tablets they are. Figure 2a shows the histogram distributions of these scores for the unknown tablets superimposed on the histogram plots of the scores obtained for the whole matrix of 30 known samples and the corresponding scores images for PC 2 for the nine unknown tablets (Figure 2b). The histogram plot of the image of unknown samples displays a clear separation into two peaks with centers of mass closely related to those of the substitute API (A) (eight tablets) and substitute API paracetamol (P) tablet types (one tablet). None of the unknown samples displays scores corresponding to the score profile of genuine tablets (G), as seen in the histogram plot and the color image of the scores.
The unknown samples were analyzed using the large field of view (33 mm × 41 mm). To emphasize the benefits of large field of view analysis, a blister strip of genuine tablets was compared to a blister strip of counterfeit. It was possible to put the two blisters next to each other and image two tablets of each (Figure 3). Figure 3a shows the image of the tablets at 2045 nm, which is one of the characteristic bands of paracetamol in the NIR spectral range. The top two tablets, which are the suspect counterfeit (P), show clearly higher absorbance at 2045 nm, whereas the genuine tablets (G) exhibit little absorbance at that wavelength. The NIR spectra (Figure 3b) from the two types of tablets are clearly distinct, and the NIR spectrum from the counterfeit tablets (P) in the blister is virtually identical to a reference spectrum for paracetamol. PCA was carried out and again it shows a clear discrimination between genuine and counterfeit tablets (Figure 3c).
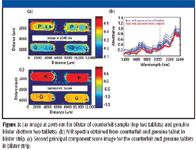
Figure 3.
In the set of 30 tablets imaged, one substitute API (A) tablet, obtaining different scores for PC2 and PC4, corresponds to the small peak between A and G in the histogram plot of the scores. While other principal component score images indicate that it is indeed a substitute API (A) tablet, it clearly has something that none of the other tablets possesses. A comparison of spectral features between loading vectors and spectra from a library of known components is an effective means to determine the origin of the variance in the samples described by the loading vectors. Figure 4 shows the fourth loading vector of the PCA and a reference spectrum of sucrose. The scores to the fourth loading vector isolate this tablet from all others, and comparison of spectral features seen in the loading vector and sucrose strongly indicate that this tablet contains more sucrose, probably in the coating because it is seen throughout the entire imaged area of the tablet.
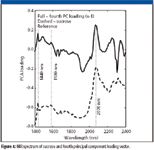
Figure 4.
Characterization of Various Counterfeit Tablets
The analysis so far was meant only to identify counterfeit tablets that looked the same but were made with different active pharmaceutical ingredients. This type of result could be obtained with a single point spectroscopic measurement and really does not take advantage of the two-dimensional spatial resolution of the imaging technique when performed one tablet at a time. Two approaches that make efficient use of the imaging approach can be considered: First, a number of tablets can be positioned in a larger field of view and imaged at once. In this configuration, used for the analysis of the group of unknown tablets described earlier and the analysis of tablets in the blister strip, the imaging camera provides the advantage of high-throughput analysis of a number of whole tablets. This is the best fit for the analysis of data described so far. The second approach is to match the magnification of the data acquisition to the expected size of the building blocks (that is, the chemical domains) in the tablet and acquire an individual image for each tablet. The image magnification used in this experiment (approximately 40 μm/pixel) fits this high magnification approach. As seen earlier, the single tablet images can be concatenated, or stitched together, and analyzed at once for a result that describes each tablet as a whole. However, the image contains a wealth of information about spatial chemical heterogeneity related to formulation and a variety of quality parameters that are untapped in this type of analysis.
Many samples contain both spatial and chemical heterogeneity, present either as a design element or a structural flaw. In either case, a thorough understanding of both the spatial and chemical heterogeneity is of great value in assessing product performance or product origin. Indeed, it is likely that tablets produced by different manufacturers might not display the same architecture as a consequence of some difference in the process, even if the starting ingredients were the same.
The architectural arrangement of components in a solid dosage form is accessed easily by NIR chemical imaging because the chemistry itself is used to generate contrast and the architecture is derived from image analysis of this contrast (10). Up to this point, image contrast was derived using PCA. When comparing principal component loadings with some known excipients for the tablets (performed in a manner similar to the analysis described for Figure 4), we concluded that the tablets contain one component (likely the API) that is distributed heterogeneously in distinct, rather large domains. The remainder (excipient bulk) of the tablets is either a single material or is quite homogenously blended. We could see subtle differences in the water and magnesium stearate content; however, these are relatively minor. In light of these findings, it is not unreasonable to approximate these samples as a two-component system (API, excipient) and develop a simple multivariate model, which will provide details about the construction of these samples.
In this study, "pure component" spectra were extracted from the sample images because no pure reference materials were available. We converted the data to the second derivative to highlight subtle spectral differences and eliminate baseline effects; in this form, the API and excipient spectra are distinguished easily at 2220 and 2250 nm, respectively, as seen in Figure 5a. A two-class library was created from the sample set in the following manner: First, a small (2500 spectra) clip from each of the 11 sample images was concatenated (27,500 spectra) and converted to a second derivative. Spectra from the 500 pixels showing the greatest intensity at 2220 nm were put into a class called API. Spectra from the 5000 pixels with the greatest intensity at 2250 nm were put into a class called excipient. Using this sampling technique, the library classes are presumed to contain a good array of "pure" spectra from the entire sample set. The two-class library was used to build a PLS model. The method is now directed by the library data to sort and quantify contributions of known spectral features in the sample data. The model was then applied to the full sample images after conversion to the second derivative to determine the score of the API class at each pixel in the image. Figure 5b shows a chemical image of the distribution of the active ingredient in a tablet. The resulting scores images can then be used to analyze and compare the distribution of this component among the different samples. This spatial unmixing approach is specific to imaging data. In a manner analogous to conventional photography, the interpretation of the data might reside in the arrangement of pixels and their associated tones. The information contained in the spatial dimensions of the data set can be employed to develop a primary method, one that does not rely on a calibration against parameters measured with a different technique. This is clearly a departure from the traditional use of NIR spectroscopic data. The development is simple for samples that contain spatially resolved pure chemical components. We can see from Figure 5b that the API is present in a continuous gradation of intermediate values; this is common in multicomponent systems because pixels very often contain mixture spectra. It is possible to further simplify the result by setting threshold values for the scores that are considered high enough for the pixel to be classified as overabundant in the particular component and hence, produce binary images from the score images. The resulting binary image is a representation of the spatial distribution of API based upon set parameters that must be applied to all images to produce comparable binary images.
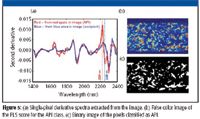
Figure 5.
The binary image can then be used to count, measure, and compare the domains individually, within one tablet or within groups of samples. Table I summarizes the number of domains, their size, size variation, and their relative proximity.
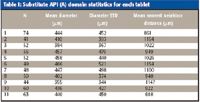
Table I: Substitute API (A) domain statitstics for each tablet
While the number of domains, mean size, and size variation often are related to blending, their proximity also can be affected by other physical effects (11). For example, one might find domains that are generally more distant from each other when the formulation includes a pregranulation step. Whether the differences arise from the sample ingredients or from the process is not of interest in the present study, and we simply make use of the availability of this information to attempt to segregate samples based upon their origin. Generally, the particle statistics analysis results suggest that the tablets fall into three groups. Tablets 1, 10, and 11 contain the largest numbers of domains and these domains are of similar (average) sizes. Tablets 4–7 present similar numbers of domains, which are generally at the larger end of the scale for the sample set. Finally, tablets 2, 3, 8, and 9 are characterized by smaller domain sizes. It is interesting to note that tablet 2 possesses a noticeably smaller number of domains than any other tablet, and tablet 9 indicates significantly smaller domains than the rest of this group. The domain characteristics seen in the latter group — smaller and less numerous domains "rich" in API — could be indicative of better blending than that achieved in the two other groups, or simply of a different dose of the ingredient. While this information is available in the same data sets used in this investigation, it is beyond the scope of this work to discuss content uniformity. Nevertheless, particle size and proximity characteristics clearly point to the possibility that these tablets came from three different sources or from a single source with poor control over the blending of its products.
The NIR-CI Advantage
The basic tool of the trade for spectroscopists, the spectrometer, imposes limitations in the analysis of manufactured products involving increasingly complex formulations and product engineering. As a result, it cannot respond to the need for a better understanding of the physical and spatial parameters impacting the performance or quality in process or of finished pharmaceutical products.
Access to the spatially resolved composition of the samples, be they blended mixtures or finished products, greatly increases the understanding of the product and ultimately parameters that can affect this performance. Of course, relevant information can only be accessed successfully when instrument characteristics, including a field of view and magnification, are appropriate for the problem at hand and the questions being asked. We have shown in this work that a low-magnification measurement was ideal for the authentication of tablets based upon the active ingredient and that a higher magnification could provide additional information that we associate with formulation and process differences, and ultimately to the origin of the counterfeit tablet. Selecting the appropriate magnification ensures both a relevant answer to a particular question and optimal use of analysis time as exemplified by the authentication of nine tablets at once using an image data set that only required 3 min of acquisition time. The samples that were used in this work are typical of many counterfeit pharmaceutical products that are encountered, in that an incorrect active ingredient is used. NIR-CI is equally applicable to the detection of products in which incorrect excipients have been used. Where a suspected counterfeit product contains the correct active ingredient, or low levels of active ingredient, together with common excipients that match a genuine product composition, alternative analytical techniques should be considered in addition to NIR-CI for determining the provenance of the product.
Janie Dubois, Joseph Schoppelrei, and E. Neil Lewis are with Malvern Instruments, Analytical Imaging, in Columbia, Maryland.
Jean-Claude Wolff and John K. Warrack are with GlaxoSmithKline, Medicines Research Centre, in Hertfordshire, UK.
References
(1) B.A. Olsen and D.E. Kiehl, Am. Pharm. Rev. 9, 115–118 (2006).
(2) K.A. Deisingh, Analyst 130, 271–279 (2005).
(3) B.A. Olsen, M.W. Borer, F.M. Perry, and R.A. Forbes, Pharm. Technology 26, 62–71 (2002).
(4) W.L. Yoon, Am. Pharm. Rev. 8, 115–118 (2005).
(5) M.J. Vredenbregt, L. Blok-Tip, R. Hoogerbrugge, D.M. Barends, and D. de Kaste, J. Pharm. Biomed. Anal. 40, 840–849 (2006).
(6) O.Y. Rodionava, L.P. Houmoller, A.L. Pomerantsev, P. Geladi, J. Burger, V.L. Dorofeyev, and A.P. Arzamatsev, Anal. Chim. Acta 549, 151–158 (2005).
(7) B.J. Westenberger, C.D. Ellison, A.S. Fussner, S. Jenney, R.E. Kolinski, T.G. Lipe, R.C. Lyon, T.W. Moore, L.K. Revelle, A.P. Smith, J.A. Spencer, K.D. Story, D.Y. Toler, A.M. Wokovich, and L.F. Buhse, Int. J. Pharm. 306, 56–70 (2005).
(8) http://www.fda.gov/cder/OPS/PAT.htm
(9) P. Geladi & H. Grahn, Eds., Multivariate Image Analysis, John Wiley and Sons, West Sussex, England, Chapters 6 and 7 (1997).
(10) E.N. Lewis, J.E. Carroll, and F.C. Clarke, NIR News 12(3), 16–18 (2001).
(11) F. Clarke, Vib. Spectrosc. 34, 25–35 (2003).
NIR Spectroscopy Explored as Sustainable Approach to Detecting Bovine Mastitis
April 23rd 2025A new study published in Applied Food Research demonstrates that near-infrared spectroscopy (NIRS) can effectively detect subclinical bovine mastitis in milk, offering a fast, non-invasive method to guide targeted antibiotic treatment and support sustainable dairy practices.
New AI Strategy for Mycotoxin Detection in Cereal Grains
April 21st 2025Researchers from Jiangsu University and Zhejiang University of Water Resources and Electric Power have developed a transfer learning approach that significantly enhances the accuracy and adaptability of NIR spectroscopy models for detecting mycotoxins in cereals.
Karl Norris: A Pioneer in Optical Measurements and Near-Infrared Spectroscopy, Part II
April 21st 2025In this two-part "Icons of Spectroscopy" column, executive editor Jerome Workman Jr. details how Karl H. Norris has impacted the analysis of food, agricultural products, and pharmaceuticals over six decades. His pioneering work in optical analysis methods including his development and refinement of near-infrared spectroscopy, has transformed analysis technology. In this Part II article of a two-part series, we summarize Norris’ foundational publications in NIR, his patents, achievements, and legacy.