A Novel Recognition of Three Kinds of Sibling Plant Using FT-IR with Continuous Wavelet Feature Extraction Combined with an Artificial Neural Network
Fourier-transform infrared (FT-IR) and horizontal attenuated total reflectance (HATR) techniques are used to obtain the FT-IR spectra of the yellow foxtail seed, the giant foxtail seed, and the green foxtail seed.

Fourier-transform infrared (FT-IR) and horizontal attenuated total reflectance (HATR) techniques are used to obtain the FT-IR spectra of the yellow foxtail seed (the seed from Setaria glauca (L. Beauv), the giant foxtail seed (the seed from Setaria faberii Herrum), and the green foxtail seed (the seed from Setaria viridis (L.) Beauv). The similar FT-IR features among these three types of seeds are extracted by using continuous wavelet transform (CWT). The decomposition levels 11, 13, and 15 are used to extract the feature vectors, which are used to train the artificial neural network (ANN). The trained neural network is used to classify the seeds. The seed samples are collected from different places around the country. With 180 testing samples, we could more effectively identify the sibling plants — yellow foxtail seed, giant foxtail seed, and green foxtail seed — by FT-IR with continuous wavelet feature extraction (CWFE) and ANN classification.
Phytotaxonomy is the oldest and the most synthetic branch of plant science. The classical plant classification is based upon the feature of the plant's exterior appearance and the interior dissection and is quite limited and artificial. Combining the classic method with a plant's spore-pollen, geographical distribution, and paleobiology simplifies further studies on the relationship of species identification and plant evolution.
In modern-day science, many different scientific disciplines interact, and new interdisciplinary fields are formed. A new field of study called phytochemistry systematics was created by the interaction of chemistry and botany. This new field provides a theoretical foundation for studying and exploiting a plant's systmetic development, utilizing the resource of plants, and seeking the industrial raw material (1). The chemistry classification for plants is based upon the difference between the chemical composition in the plant's secondary metabolism (such as saccharide, glucoside, flavonoid, plant alkaloid, terpene, volatile oil, and tannin) and macromolecule with biological information (such as DNA, RNA, and protein). Currently, the techniques of chromatography, spectroscopic methodology, and immunology are used in the chemistry classification.
Fourier-transform infrared (FT-IR) spectroscopy can provide all the information about compositional system materials. Different monoids of plants have different chemical composition and FT-IR spectra, so we can use FT-IR to classify different plants (2). But FT-IR analysis cannot be used in many areas where fast and accurate classification is needed. A current trend in instrument analysis is the use of chemometrics to achieve a fast and accurate complex systems analysis and classification (3–5).
Wavelet transform is a more effective signal processing method than the Fourier transform and plays an important role in signal analysis and feature extraction (6–8). In wavelet multiresolution analysis, wavelet decomposition coefficients of each level are different for the same characterization of the signal. So the wavelet decomposition coefficients can be considered to form the feature vector of the signal characteristics. Because only a few coefficients are needed to reflect on the absorption peaks of spectra, it is one of the more effective chemometrics analysis methods (4).
Artificial neural networks (ANNs) have high intelligence and are used widely. Their calculation is simple and the prediction is accurate for nonlinear issues (9–12). It is also one of the chemometrics methods to be used in classification or identification.
This article focuses on the classification of three sibling plants, the yellow foxtail seed, the giant foxtail seed, and the green foxtail seed. These three plants are difficult to distinguish by traditional phytotaxonomy. This study uses FT-IR and horizontal attenuated total reflectance (HATR) techniques. The feature vectors, which represent spectral characteristics of the FT-IR, are extracted by using continuous wavelet multiresolution analysis methods. An artificial neural network is used to classify the sibling plants.
Experimental
Materials
The yellow foxtail seed is the mature, dry seed of Setaria glauca (L.) Beauv that belongs to gramineae. The giant foxtail seed is the mature, dry seed of Setaria faberii Herrum that belongs to gramineae. The green foxtail seed is the mature, dry seed of Setaria viridis (L.) Beauv that belongs to gramineae. The samples were collected from Jinhua of Zhejiang, Jiujiang of Jiangxi, and Beibei of Chongqing in China in October 2006. All samples were ground to fine powder in agate mortars to 200 mesh respectively and were stored at the Department of Botany of Zhejiang Normal University in China.
Apparatus
A Nicolet (Madison, Wisconsin) NEXUS 670 FT-IR Spectrometer, equipped with a temperature-stabilized deuterated tryglycine sulfate (DGTS) detector and a single-bounce HATR accessory. The spectral range is 4000–650 cm–1 with a resolution of 2 cm–1 , and the cumulative scan number is 64.
Spectral Measurements
The FT-IR spectrum background was recorded before collecting the sample's FT-IR spectrum. Reference spectra were recorded by using a blank HATR germanium wafer. Single-beam spectra were obtained for all the samples, and the ratios of the spectra against the background spectra of air were used to present the spectra in absorbance units. The powder sample was put on the germanium wafer and then impacted using a pressure tower. FT-IR spectra were collected according to the instrument instructions. After each experiment, the HATR germanium wafer was washed thoroughly with distilled water and dried with nitrogen, and its spectra were examined to ensure that no residue from the previous experiment was retained on the germanium wafer surface. All spectra were baseline corrected. All experiments were repeated three times and the average spectra were used for further analysis.
Data Analysis
The FT-IR spectra of samples was measured. The absorption values from different wave bands based upon the characters of the absorption value were obtained by copying data method. MatLab software was used for wavelet transition analysis. Morlet wavelet, which possesses better exploration ability for signal singularity, acted as analysis wavelet and one-dimension continuous wavelet was done to different samples. A total of 17 layers of the samples character variable were picked up by selecting a decomposition level whose difference degree was the most obvious. Through a comparative analysis, three layers (11, 13, and 15) were selected to extract the eigenvector. The number of training samples and testing samples was 200 and 180, respectively. The selected character variables were used for back-propagation neural network (BPNN) training and identification.
Results and Discussion
FT-IR Analysis
Figure 1 shows the FT-IR spectra of yellow foxtail seed, giant foxtail, seed and green foxtail seed. From Figure 1, we notice that the yellow foxtail, giant foxtail, and green foxtail seeds belong to sibling plants. They contain similar chemical composition like hydroxy of cellulose (seed coat), starch and plant hormones β-sitosterol and their IR absorption is quite similar. There is hydroxyl stretching vibration absorption peak in 3300 cm–1 and different C-O bond stretching vibration absorption peak between 1030 and 1200 cm–1 . The FT-IR spectra of the same plant samples from different areas are slightly different due to the different growing environment. The FT-IR spectra from the different plants have very close absorbances and it is difficult to distinguish them, so we used a continuous wavelet transform to extract their features for further classification.
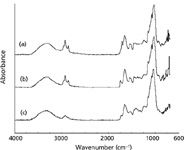
Figure 1: FT-IR spectra of (a) yellow foxtail seed, (b) giant foxtail seed, and (c) green foxtail seed.
The regions providing higher information were the 3600–2800 cm–1 and 1800–650 cm–1 regions. The 3600–2800 cm–1 region includes the O-H and N-H stretching bands and the character is not obvious. The 1800–650 cm–1 region includes the fingerprint region, which contains more molecule structural information. Thus we used the 1800–650 cm–1 region to extract the spectral features.
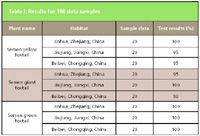
Table I: Results for 180 data samples
Continuous Wavelet Feature Extraction
The proper wavelet base and scale should be determined by analyzing the signal spectra property and the comparison of decomposition results with different wavelet bases and decomposition levels (5). During the multiresolution wavelet decomposition process, the suitable wavelet basis function and wavelet decomposition level are determined based upon the comparison of the FT-IR signals and the signals' decomposition effects under different resolution. The standard selection is to extrude several characteristic peaks in the original spectra and select a good smoothing wavelet. After comparing Haar, Daubechies, Mexicon hat, Meyer, Morlet, and Symlets wavelet decomposition, we chose the anisotropic Morlet wavelet as "wavelet analysis." Three characteristic peaks in the original FT-IR signal of wavelet domain were used for further extraction of its eigenvalues. The yellow foxtail, giant foxtail, and green foxtail seeds were analyzed by continuous wavelet transformation separately. The decomposition level was set at 17. After analysis we chose the 11, 13, and 15 levels to extract its features.
Figure 2 shows preprocessed FT-IR spectra of yellow foxtail seed and its continuous wavelet transform (CWT) coefficients, where L1–L15 indicates detailed information after decomposition (fine to coarse).

Figure 2: The result of the multiresolution decomposition for yellow foxtail seed FT-IR with CWT.
Figures 3 and 4 show preprocessed FT-IR spectra of giant foxtail and green foxtail seed, respectively, and their CWT coefficients.
From Figures 2–4, we see that it is difficult to discern the main features of its spectrum from the wavelet domain if the CWT resolution is fine because of too much detailed information. The detailed information is sensitive to spectrum change, has strong response to characteristic peak of the original various spectrum, and is not good for the feature extraction. Therefore, the decomposition level 11, 13, and 15 in the continuous wavelet domain were chosen as a variable characteristic extraction space. Feature variable is defined as energy of the decomposition in the continuous wavelet domain. There are three resolutions of the spectrum with three decomposition levels 11, 13, and 15. In order to effectively extract features of each resolution, wavelet coefficients in the continuous wavelet domain were divided into three regions according to the properties of their FT-IR spectra (Figure 5).
From Figure 5, we can see that the three characteristic regions are 1760–1670 cm–1 , 1530–1400 cm–1 , and 1220–1030 cm–1 . These feature vectors are composed from the wavelet domain (decomposed at levels 11, 13, 15). Nine feature intervals are formed with three resolution spectrum and the characteristics values are the spectral energy in the nine feature intervals, respectively.
Back-Propagation Algorithm
The artificial neural network has many models. It can be divided into feed-forward and feedback based upon the network structure. One of the main applications of a feed-forward network is identification and classification. There are no strict distinctions between the input and output layers of a feedback network, and we can extract the important characteristics and energy minimization of data after study (13).
When all the feed-forward neural-network nodes used the sigmoid function, one hidden layer was sufficient to arbitrary classification. Figure 6 shows the calculation process of the feed-forward artificial neural network. Figure 6a shows the first stage, which includes choosing the network model and learning rules, studying input and output data (output data also known as the target output data), and learning and training the network to get the neural network's node weight and node threshold. The network weights and threshold were determined on a process of constantly adjusting the network weights and threshold by comparing the error between the output data of the artificial neural network and the target output data until the errors were within the allowable range.
The second stage is shown in Figure 6b. The output result was generated by inputting the testing data into the network model with the chosen weights and threshold in the first stage.
We used FT-IR–continuous wavelet characteristic vector value of the yellow foxtail, giant foxtail, and green foxtail seeds, which were collected from around the country, as guide data to train the network. The back-propagation algorithm, which is mature in multilayer feed-forward networks both in theory and applications, was used.
After data preprocessing, the three congeners were mapped to the three nodes in the output layer and the wavelet FT-IR eigenvalues of nine eigenvectors were normalized into the value between 0 and 1.
The classification algorithm has two steps. The first step is back-propagation network training, and the second step is classification of different kinds of categories using the trained back-propagation network (Figure 7).
Step 1 — Network training. There are three layers: the input, the output, and the hidden layer. The input layer consists of the nine normalized eigenvectors from the three regions. The output layer is used for classification with each node corresponding to each kind of plant seed. The hidden layer is the layer between the input layer and output layer. The number of nodes in the hidden layer has to be decided carefully. Fewer hidden nodes mean higher local minimum and poor fault tolerant ability. However, too many hidden nodes mean long study time and the classification result is not always the best. It is necessary to test repeatedly and choose the best number of hidden nodes. In step 2 the network model designed in step 1 is used to test the nine eigenvectors from the three normalization regions.
The sigmoid function was used as the activation function. To make the least square error of the corresponding input samples p minimum, we studied and amended the threshold and weights. The formula of the least square error function can be written by

where tpj is the target output value of sample p in the output layer's j node, that is, the type of the plant, and opj is the actual output value of sample p in the output layer's j node. The actual output value is calculated from the input layer to the output layer, while the adjusted direction of error and weight are from the output layer to the input layer.
The formula of calculation of the output value opj of the node j (the output value equal to the input value when node j is the input layer's node) is

where wji is the weight value that connected nodes i and j, and θj is the threshold of node j. Threshold values can be considered as the weight connecting an output equal to 1 to other nodes, so its adjustment process is the same as for wji. The adjustment of weight wji is as follows:
The formula of amendment weight wji, which connects the hidden layer's node i to the output layer's node j is as follows (when j is the output layer's node):

where η is the learning rate, α is the momentum term, and δpj is the error signal of the output layer's node j. δpj is calculated as follows:

When j is not the output layer nodes, we also used the above weight amendment to connect the hidden layer's node i and the hidden layer's node j. But in this case δpj calculation becomes

where δpk is the error message between the output with input from node j and node k and wkj is the weight connecting nodes j and k.
Identified Network and Application of the Results
After testing, we define the structure of the back-propagation network as nine nodes in the input layer, 10 nodes in the hidden layer, and three nodes in the output layer. The error is 0.05; α is 0.8; and η is 0.02.
For the training process, we used nine input layer nodes of back-propagation network structure, followed by normalized nine feature vectors. The output layer nodes were divided into category 1: yellow foxtail seed; category 2: giant foxtail seed; and category 3: green foxtail seed. The trained network was used to verify the 180 different sample data. The input data are the eigenvectors extracted from the wavelet transform of the original FT-IR. The results are shown in Table I.

Figure 3: The result of the multiresolution decomposition for giant foxtail seed FT-IR with CWT.
Based upon the results in Table I, the three different types of plant seeds (the yellow foxtail seed, the giant foxtail seed, and the green foxtail seed) are identified correctly. The eigenvectors of the different plant seeds that were extracted from the wavelet transform of the FT-IR have significant difference, so that a high classification accuracy could be achieved. Because the feature values of the green foxtail seed are very different from the ones of the two other seeds, an identification rate of 100% can be obtained.

Figure 4: The result of the multiresolution decomposition for green foxtail seed FT-IR with CWT.
Conclusion
Using the seed as material to obtain FT-IR spectra is an effective way to classify plants because the seed of the reproductive organ contains more stable characters than the vegetative organ.
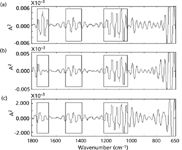
Figure 5: Division of three feature regions of L15 detail signal in the CWT domain: (a) yellow foxtail seed, (b) giant foxtail seed, and (c) green foxtail seed.
The HATR–FT-IR method can directly measure yellow foxtail seed, giant foxtail seed, and green foxtail seed of the sibling plants to obtain spectra that enable easier comparison.
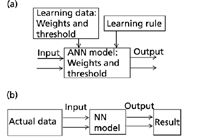
Figure 6: The artificial neural network calculation flowchart.
Wavelet transform can be used to extract the features of the same family plants whose infrared absorption is similar in FT-IR. The selected eigenvectors in the section 11, 13, and 15 resolution were used to successfully classify the sibling plant seeds through the artificial neural network. The integration of spectroscopy and computer science technologies provides an efficient analyzing tool for further study in plant taxonomy.
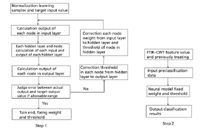
Figure 7: Back-propagation algorithm flow chart.
Acknowledgments
This research was supported by the National Natural Science Foundation of China under project number 30800705. The authors would like to thank Dr. Shuiliang Guo of Department of Biology, Zhejiang Normal University, China, for identifying the plant samples.
Cungui Cheng, Wei Xiong, and Yumei Tian are with the Zhejiang Key Laboratory for Reactive Chemistry on Solid Surfaces, Department of Chemistry, Zhejiang Normal University, Jinhua, China. E-mail Cungui Cheng at ccg@zjnu.cn.
Changjiang Zhang is with the Department of Electronics and Information Engineering, Zhejiang Normal University, Jinhua, China.
References
(1) C.S. Hao, W.Q. Shi, H.Q. Wei, Q.Z. Meng, and J.S. Gu, Acta Acad. Medic. Hebei 15, 60–62 (1994).
(2) H.F. Lu, C.G. Cheng, X. Tang, and Z.H. Hu, Acta Bot. Sin. 46, 401–406 (2004).
(3) C.G. Cheng, G.L. Sun, and C.J. Zhang, Spectroscopy 22(11), 38–42 (2007).
(4) Y.N. Ni, The Application of Chemometrics in Analytical Chemistry (Science Press, Beijing, 2004), pp. 123–131.
(5) C.G. Cheng, Y.M. Tian, and C.J. Zhang, Acta Chim. Sinica 23, 793–798 (2008).
(6) C.G. Cheng, Y.M. Tian, and W.Y. Jin, Acta Chim. Sinica 22, 2539–2543 (2007).
(7) S.M. Debbal and F. Bereksi-Reguig, Comput. Biol. Med. 37, 269–276 (2007).
(8) E. Dinç, M. Kanbur and D. Baleanu, Spectrochim. Acta A 68, 225–230 (2007).
(9) H.B. Wang, W.Y. Xu, and R.C. Xu, Eng. Geol. 80, 302–315 (2005).
(10) E.E. Tabach, L. Lancelot, I. Shahrour, and Y. Najjar, Math. Comput. Model. 45, 766–776 (2007).
(11) L.S. Anker and P.C. Jurs, Anal. Chem. 64, 1157–1164(1992).
(12) W.Y. Jin, C.G. Cheng, and X.H. Wu, Spectrosc. Spect. Anal. 26, 2210–2213 (2006).
(13) S.B.G. Ha, J. W. Ma, Z.J. Zhou, and Q.Q. Li, J. Grad. School Chinese Acad. Sci. 20, 328–333 (2003).

AI Shakes Up Spectroscopy as New Tools Reveal the Secret Life of Molecules
April 14th 2025A leading-edge review led by researchers at Oak Ridge National Laboratory and MIT explores how artificial intelligence is revolutionizing the study of molecular vibrations and phonon dynamics. From infrared and Raman spectroscopy to neutron and X-ray scattering, AI is transforming how scientists interpret vibrational spectra and predict material behaviors.
Real-Time Battery Health Tracking Using Fiber-Optic Sensors
April 9th 2025A new study by researchers from Palo Alto Research Center (PARC, a Xerox Company) and LG Chem Power presents a novel method for real-time battery monitoring using embedded fiber-optic sensors. This approach enhances state-of-charge (SOC) and state-of-health (SOH) estimations, potentially improving the efficiency and lifespan of lithium-ion batteries in electric vehicles (xEVs).
New Study Provides Insights into Chiral Smectic Phases
March 31st 2025Researchers from the Institute of Nuclear Physics Polish Academy of Sciences have unveiled new insights into the molecular arrangement of the 7HH6 compound’s smectic phases using X-ray diffraction (XRD) and infrared (IR) spectroscopy.