Study on Estimating Total Nitrogen Content in Sugar Beet Leaves Under Drip Irrigation Based on Vis-NIR Hyperspectral Data and Chlorophyll Content
The relationship between the leaf nitrogen content (LNC) and hyperspectral remote sensing imagery (HYP) was determined to construct an estimation model of the LNC of drip-irrigated sugar beets, aiming to provide supports for the in-time monitoring of sugar beet growth and nitrogen management in arid areas. In this study, a field hyperspectrometer was used to collect the leaf reflectance at the 350–2500 nm for each treatment on the 65th, 85th, 104th, 124th, and 140th day after emergence, and the LNC and leaf chlorophyll content (CHL) of sugar beets were also determined. The spectral characteristic parameters were selected to construct the vegetation indices. The LNC estimation model using HYP as the independent variable (HYP-LNC), and that using CHL and HYP as the independent variables (HYP-CHL-LNC), were compared. The results shows that the HYP-CHL-LNC models had a better linear relationship and a higher fitting accuracy than the HYP-LNC models.
Nitrogen is of great significance to the growth and yield formation of crops because it is an important component of nucleic acids and proteins (1). Appropriate nitrogen application could significantly increase crop yields, but excessive application of nitrogen may cause the accumulation of ammonium ions, increase harmful nitrogen, and reduce root quality (2,3). Therefore, rapid monitoring of nitrogen status is key for crop management. At present, studies on estimating leaf nitrogen content (LNC) mainly focus on the hyperspectral data in the visible (380–780 nm) and near-infrared (NIR) (780–2500 nm) ranges. To estimate the LNC, most use the equation constructed with the spectral reflectance at the wave bands that are highly correlated with LNC as the independent variables. Stone (4) estimated the LNC of wheat using the plant nitrogen spectral index (PNSI) and the equation constructed with the spectral reflectance at 780 nm and 671 nm. Thomas (5) found that the wavelength range of 550–675 nm could be used to estimate the LNC of pepper. Tian (6) found that the blue-band vegetation indices R434/(R496 × R401) could be used to estimate the LNC. Wang (7) proposed an improved normalized difference vegetation index (NDVI) triple-band index (R924 − R703 + 2 × R423)/(R924 + R703 − 2 × R423), which could improve the estimation accuracy of LNC. Menesatti (8) constructed a partial least square (PLS) estimation model to estimate the LNC of Tarocco blood oranage [Citrus sinensis (L) Osbeck] based on hyperspectral data. Zhang (9) constructed a multiple linear regression (MLR) equation of the LNC and NIR reflectance spectrum of apples.
As a non-destructive monitoring technology, hyperspectral remote sensing (HYP) (non-imaging) has been widely used in the cultivation of wheat (10,11), rice (12,13), and cotton (14,15), but it was rarely used in the study of sugar beets. Previous studies mainly estimated the LNC using the equation constructed with the spectral reflectance at sensitive wavebands. Therefore, the main research objectives of this study were as follows: 1) to construct the model for estimating LNC of sugar beet, HYP-LNC, with the equation constructed with the spectral reflectance at sensitive wavebands as the independent variable; 2) to construct the LNC estimation model, HYP-CHL-LNC, with spectral data and CHL as independent variables; and 3) to propose an optimized multivariate model through comparing the estimation accuracy of the HYP-LNC and HYP-CHL-LNC models. This study selected and optimized the model for estimating the LNC of sugar beets through establishing the relationship between the leaf spectral reflectance and the content of CHL and LNC, which could provide support for the rapid and real-time monitoring of the nitrogen status of crops.
Materials and Methods
Experimental Design
The experiment was carried out at the Experimental Station of the Agricultural College of Shihezi University in Xinjiang Province, China, from April to November 2017. The soil was irrigated desert loess, with an organic matter content of 13.27 g/kg. The available potassium was 157.97 mg/kg, the total nitrogen content was 0.76 mg/kg, the available phosphorus content was 22.56 mg/kg, and the pH was 7.3.
The experiment adopted a random block design. A total of four nitrogen levels were set in this experiment: CK (0 kg/hm2), N75 (75 kg/hm2), N150 (150 kg/hm2), and N225 (225 kg/hm2), and three nitrogen application modes were set: M1 had 100% of the nitrogen fertilizer applied on the 65th day after emergence (10:0:0); M2 had 70% of the nitrogen fertilizer applied on the 65th day after emergence and 30% was applied on the 100th day (7:3:0); and M3 had 50% of the nitrogen fertilizer applied on the 65th day after emergence, 30% percent applied on the 100th day, and 20% percent on the 135th day (5:3:2). There were 30 plots, and the area of each plot was 12 m2. Each treatment had three replicates. The sugar beet variety was Beta356, and the sowing date was April 15. The row spacing was 50 cm and the plant spacing was 20 cm. The base fertilizers were calcium triple superphosphate (319.5 kg/hm2) and potassium sulfate (206 kg/hm2). Other management steps were the same as the local practice.
Determination of Spectral Reflectance of Sugar Beet Canopy
Visible NIR spectroscopy (vis-NIR) is a method to identify and quantify the substance content of samples by using the interaction between electromagnetic waves and substances in the visible (380–780 nm) and NIR (780–2500 nm) regions. It is one of the important methods for nondestructive and rapid detection of substance content (16–18).
The FileSpecPro FR2500 spectrometer (Analytical Spectral Device) was used to measure the hyperspectral reflectance of the canopy. The wavelength range of the spectrometer was 350~2500 nm, the sampling interval was 1 nm, and the field of view was set at 25°. During measurement, the probe was oriented vertically downward, and the vertical height from the canopy was approximately 0.5 m. Calibration was conducted before the measurement in each plot. In a sunny and cloudless weather, the measurement was conducted from 12:00 to 15:00, and the spectral reflectance were measured on the 65th, 85th, 104th, 124th, and 140th day after the emergence of the sugar beets. Five spectral data sets were recorded for each measurement point. Each plot was measured three times, and the average value was taken as the spectral reflectance of the plot.
The sampling time and sampling positions for determining the LNC and leaf chlorophyll content (CHL) were consistent with those for the spectral measurement. The LNC was measured with the Kjeldahl method, and the CHL was measured using an acetone–ethanol mixture (19).
Spectral Data Processing
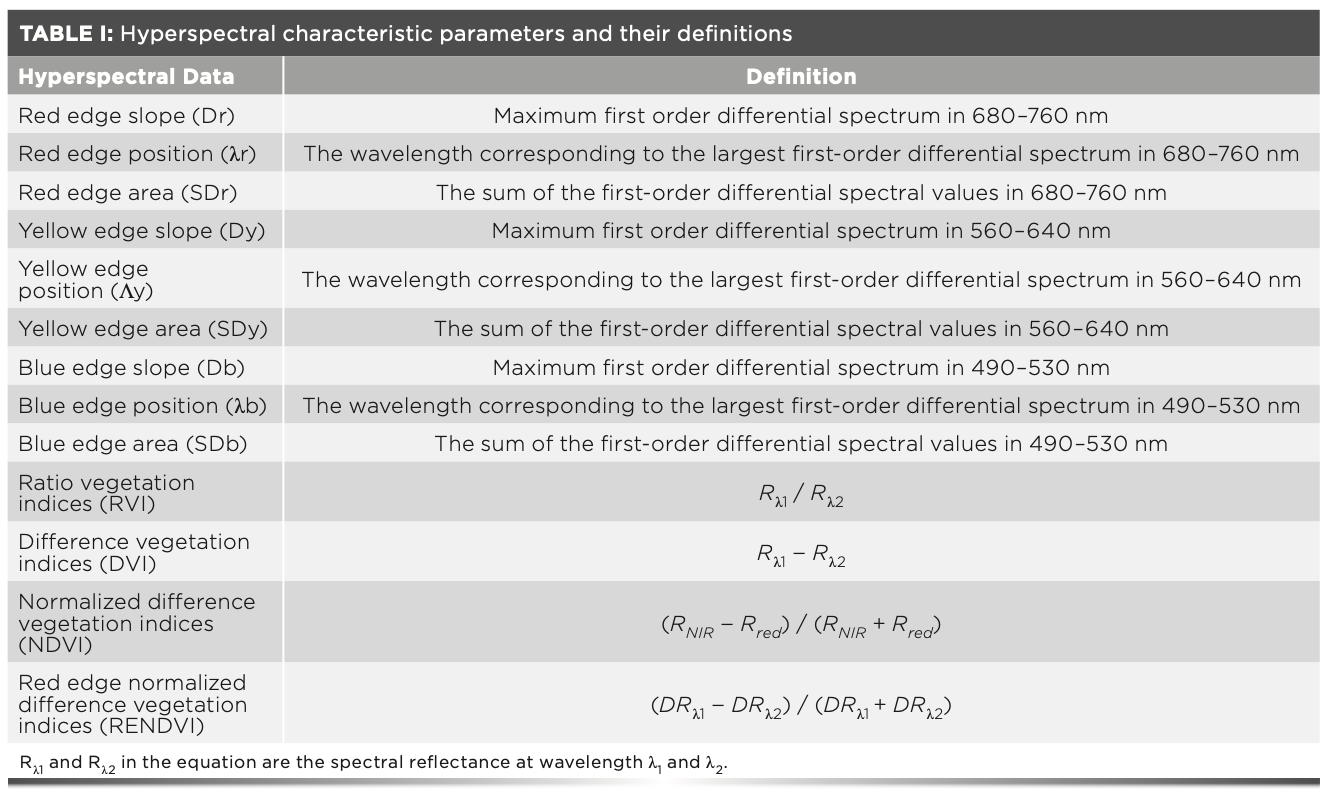
The ViewSpec Program was used to extract the original spectral data. Because the collection of spectral data was easily affected by the environmental background noise, light scattering of atmospheric particles, and instrument noise, the spectral reflectance near 1400, 1800, and 2400 nm that were affected by water vapor were removed, and a Savitzky-Golay filter was used to denoise the data near 350–2500 nm. Microsoft Excel 2013 and SPSS 12.0 software were used to perform statistical analysis on the agronomic data and spectral data, and the Origin 2018 software was used for graphing. Matlab software was used to extract characteristic parameters of the canopy spectral data, and the common spectral trilateral parameters were extracted from them. By selecting the existing vegetation indices for comparison and combining the sensitive wavebands that have a good correlation with the LNC, the ratio vegetation indices (RVI), difference vegetation indices (DVI), normalized difference vegetation indices (NDVI), and red-edge normalized difference vegetation indices (RENDVI), were constructed (Table I).
The spectral reflectance from the 65th day to the 140th day after the emergence were collected. The canopy of sugar beets fully covered the soil background in 65 days. Therefore, this study selected the total sample size for the estimation of LNC and validation. According to the sample size, the samples were randomly divided into two groups, including 75 samples for modeling and 26 samples for model validation. By comparing the coefficient of determination (R2), root mean square error (RMSE), and relative error (RE) of each model, the optimal model was selected for the estimation of LNC. Among them, R2 was used to test the goodness of fit, and RE and RMSE were used to test the reliability of the model.
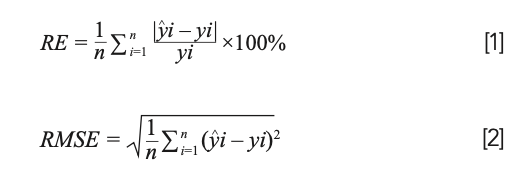
where yi is the measured value of LNC, y^i is the LNC estimated by the model, and n is the number of samples.
Results
Analysis of Spectral Characteristics of Sugar Beet Canopy Under Different Nitrogen Levels
The spectrum of sugar beet canopy in the visible and NIR bands had obvious characteristics (Figure 1a). The changes of the spectral reflectance of the sugar beet canopy were similar under different nitrogen levels (Figure 1a). The spectral reflectance showed a trend of first increasing and then decreasing, having a peak near 550 nm and a valley near 670 nm. The spectral reflectance rose sharply with the increase of wavelength in the wavelength range of 670–760 nm, and had obvious changes in the wavelength range of 780–1300 nm. The spectral reflectance for the N75, N150, and N225 treatments at 550 nm decreased by 7.5%, 28%, and 23% compared with that for CK, respectively, which indicated that compared with CK, the N75, N150, and N225 treatments could improve the absorption of red and blue light and the photosynthetic efficiency of sugar beet leaf. The N150 treatment had a better effect on improving photosynthetic efficiency than the N75 and N225 treatments. In the NIR region (780–1300 nm), the spectral reflectance for the N75, N150, and N225 treatments increased by 6.14–12.6%, 14.2–16.4%, and 6.82–18%, respectively, compared with that for CK.
FIGURE 1: (a) Canopy hyperspectral reflectance at different nitrogen levels. (b) Canopy red edge at different nitrogen levels.
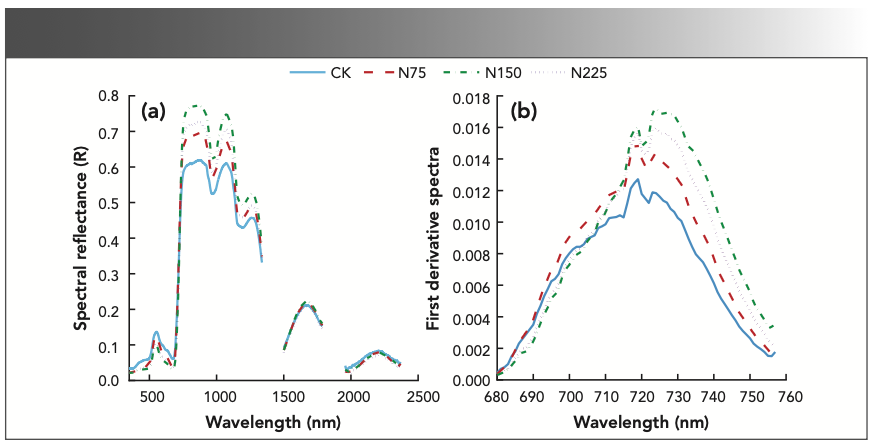
In the NIR region, the waveband of the original spectral curve was consistent with the red edge, but obvious differences were found among nitrogen treatments, indicating that different nitrogen treatments had great impacts on sugar beets. The red-edge position for the N75 treatment was the same as that for the CK, whereas the red shift appeared in the red-edge position for the other nitrogen treatments. The spectral reflectance for the N150 and N225 treatments moved 5 nm to the long wave range compared with the CK, indicating that the photosynthetic efficiency of sugar beet canopy increased with the nitrogen application rate, but the red-edge position for the N150 treatment tended to be stable, which was consistent with the “green peak” of the original spectral reflectance in the visible region (Figure 1b).
Correlation Analysis Between LNC and the Spectral Reflectance of Sugar Beets
The wavelengths with a stable correlation between canopy spectral reflectance and LNC mainly concentrated in the wavelength ranges of 380–1300 nm and 1418–1809 nm. Because the leaf spectral reflectance in the NIR region (1300–2500 nm) was mainly controlled by leaf water content, the spectral reflectance increased with the decrease of leaf water content, and the sensitive bands of LNC mainly concentrated in the shortwave IR and visible regions. Therefore, the wavelength range of 380–1300 nm was selected for the estimation of LNC (Figure 2).
FIGURE 2: Correlation between original spectral reflectance and LNC of sugar beet. P0.05: significant correlation; P0.01: extremely significant correlation.
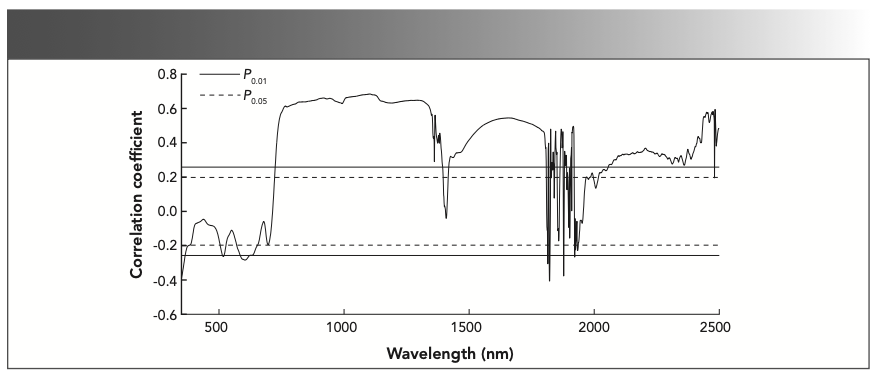
In the wavelength range of 380–1300 nm, the waveband with positive correlation with LNC in the visible region was mainly in the 726–780 nm region. The maximum positive correlation was found at 767 nm (r = 0.609, P < 0.01); the waveband with negative correlation with LNC was mainly in 591–615 nm region, and the maximum negative correlation was found at 604 nm (r = -0.267, P < 0.01). In the NIR region, the wavebands with positive correlation with LNC was mainly in 780–1300 nm, and the maximum positive correlation was found at 1104 nm (r = 0.68, P < 0.01). But there was no negative correlation with LNC in this region (P > 0.05).
Correlation Analysis Between the LNC of Sugar Beets and First-Order Differential Spectral Reflectance
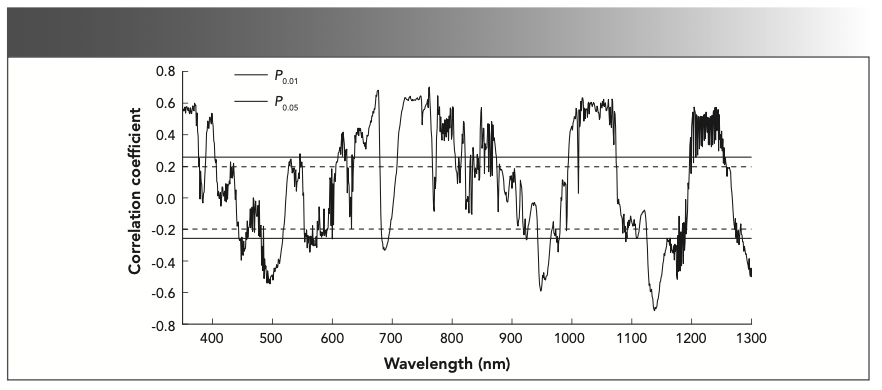
According to the correlation analysis between the first-order differential spectral reflectance and the LNC of sugar beets, the sensitive wavelengths of LNC were mainly concentrated in the shortwave IR and visible regions, so the first-order differential spectral reflectance at 380~1300 nm was selected for correlation analysis with the LNC. In the wavelength ranges of 389–403, 610–620, 638–679, 709–766, 774–805, 995–1073, and 1200–1252 nm, the correlations were positive, and the maximum positive correlations (r = 0.703, P < 0.01) were found at 762 nm in the visible region (380–780 nm), and at 1018 nm (r = 0.633, P < 0.01) in the NIR region (780–1300 nm), respectively. In the wavelength ranges of 445–457, 486–517, 683–693, 943–964, 1126–1176, and 1285–1300 nm, the correlations were negative, and the maximum negative correlations (r = -0.545, P < 0.01) were found at 496 nm in the visible region, and at 1138 nm (r = -0.715, P < 0.01) in the NIR region. In the red-edge region (680–760 nm), the maximum positive correlation was found at 747 nm (r = 0.646, P < 0.01), and the maximum negative correlation was found at 687 nm (r = -0.332, P < 0.01) (Figure 3).
FIGURE 3: Correlation between the first derivative spectra of sugar beet canopy and LNC.
Correlation Between the LNC of Sugar Beets and Hyperspectral Characteristics
Through analyzing the correlations between LNC and spectral reflectance and the first-order differential spectral reflectance, the spectral reflectance with the largest correlation coefficient in the corresponding wavebands were selected to construct the RVI, DVI, and NDVI for the estimating LNC. The correlations between the LNC, spectral characteristics, and vegetation indices were analyzed (Table II).
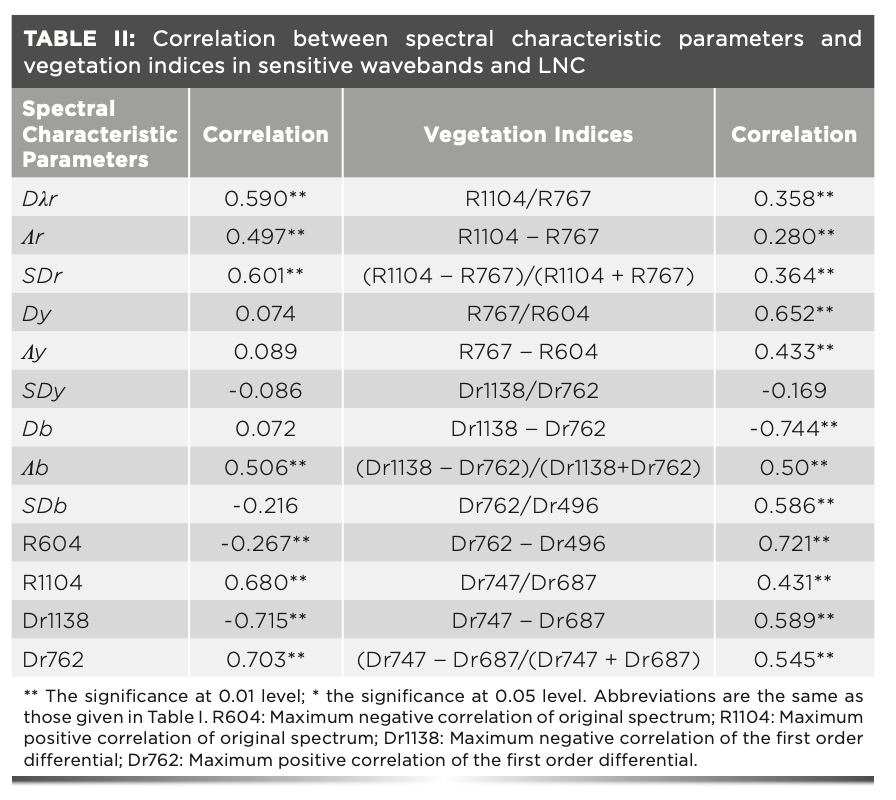
The parameters of red edge (red-edge position, red-edge area, and red-edge amplitude) were correlated with the LNC (P < 0.01), and only the blue-edge position Db among the parameters of the yellow edge and blue edge was correlated with LNC (P < 0.01). Among the parameters of red, yellow, and blue edges, the Dλr, SDr, and Db and LNC were correlated with LNC (P < 0.01), and the correlation between SDr and LNC was the maximum (r = 0.601, P < 0.01). The original spectral reflectance and first-order differential spectral reflectance were correlated with LNC (P < 0.01), among which the correlations between Dr1138 and Dr762 and LNC were all above 0.7. The correlation coefficients between all constructed vegetation indices, except for Dr1138–Dr762, and LNC were low (P < 0.01). In the original spectral vegetation indices, only the correlation coefficient between R767–R604 and LNC was above 0.6. The first-order differential vegetation indices except Dr1138–Dr762 was correlated with LNC (P < 0.01), among which the correlation coefficients of Dr1138– Dr762 and Dr762–Dr496 were above 0.7. The red edge spectral vegetation indices were correlated with LNC (P < 0.01), among which the correlation coefficients of Dr747– Dr687 and (Dr747/Dr687)/(Dr747 + Dr687) were above 0.5, and the correlation coefficients between the first-order differential spectral vegetation indices and red-edge spectral vegetation indices and LNC were higher than that between the original spectral vegetation indices and LNC (Table II).
Correlation Between LNC of Sugar Beets and Hyperspectral Vegetation Indices
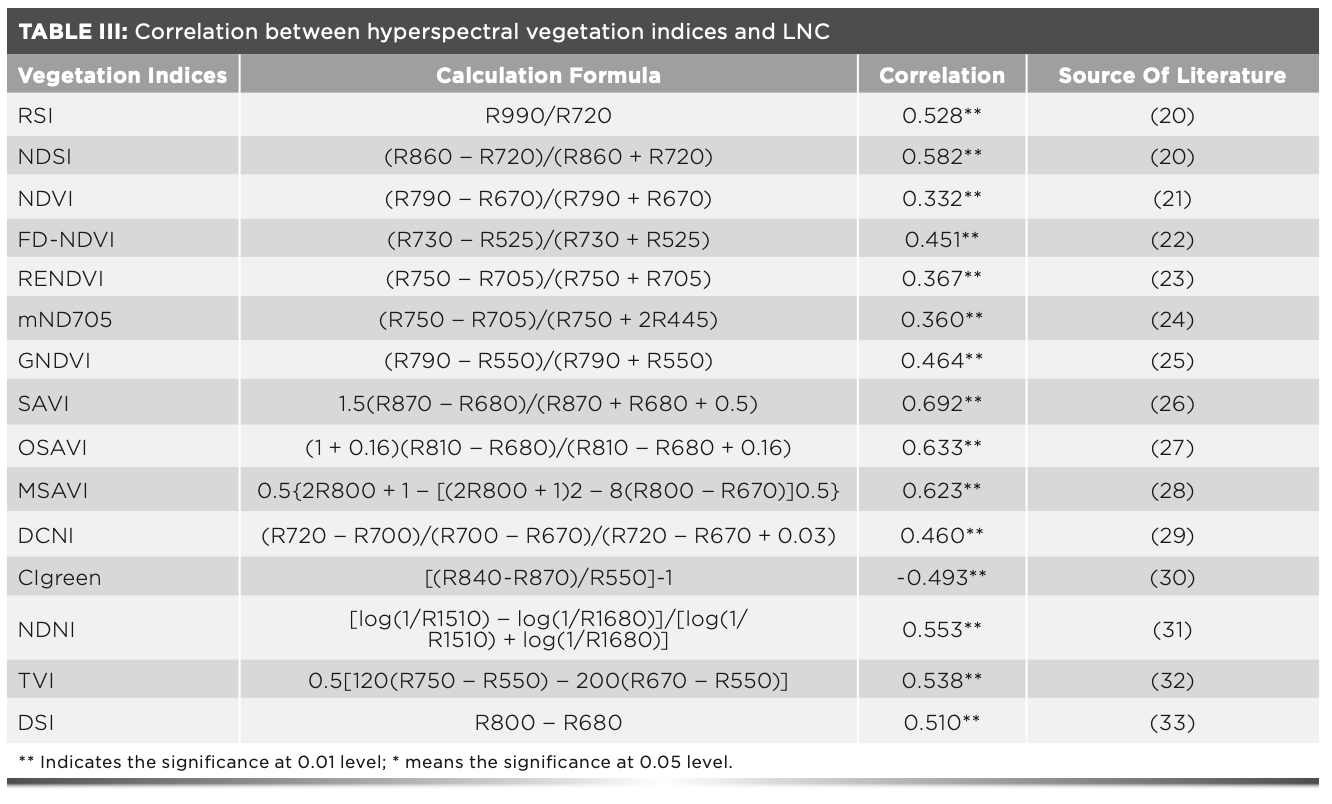
On the basis of previous studies, the existing vegetation indices were optimized through analyzing the experimental data of this study, and the correlations between the optimized hyperspectral vegetation indices and LNC were analyzed. The LNC had a correlation with the selected 15 hyperspectral vegetation indices (P < 0.01), of which eight had a correlation coefficient greater than 0.5. The correlation coefficients of the vegetation indices SAVI, OSAVI, and MSAVI and LNC were above 0.6, and the correlation coefficient of SAVI and LNC was the maximum (r = 0.692**, P < 0.01).
Estimation of LNC Based on Spectral Characteristic Parameters and Vegetation Indices and Validation
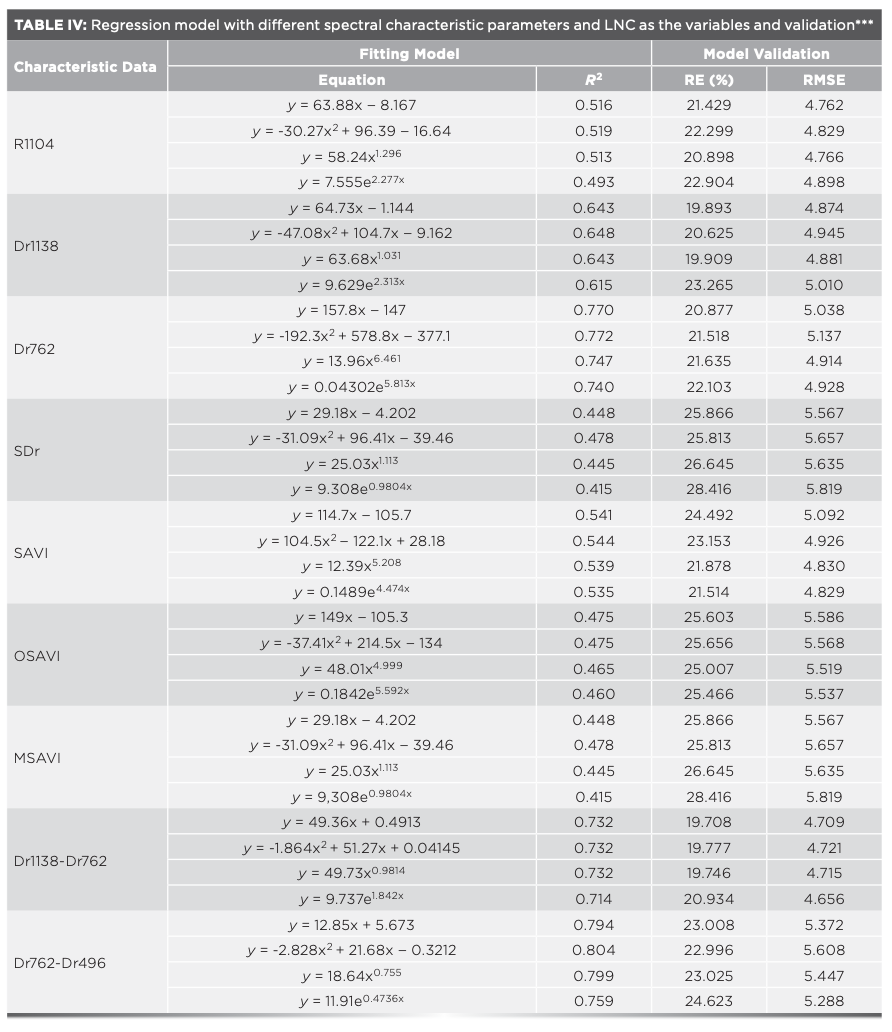
The correlations between LNC and hyperspectral characteristic parameters were analyzed, and the hyperspectral characteristic parameters with correlation coefficients greater than 0.6 in Tables II and III were selected to estimate the LNC. Taking hyperspectral parameters as independent variable x and leaf LNC as dependent variable y, the estimation models of LNC were constructed using linear function, quadratic function, power function, and exponential function. The optimal model was selected by comparing the coefficients of determination (R2), relative error (RE) (%), and root mean square error (RMSE) of each model, in which R2 was used to test the goodness-of-fit, and RE (%) and RMSE were used to test the reliability of the model.
The test of the accuracy of HYP-LNC estimation models showed that the LNC had a high goodness-of-fit with the selected spectral characteristic parameters and vegetation indices, and the accuracy was also high (R2 = 0.415–0.804). By comparing the estimation models using different functions with HYP-LNC as the variables, it was found that the models using the quadratic function were optimal among the models constructed with different spectral characteristic parameters and vegetation indices, and the R2 of the spectral characteristic parameters Dr1138 and Dr762 were above 0.6. The R2 of the models with Dr1138–Dr762 and Dr762–Dr496 as the variables were above 0.7, and the R2 for the quadratic model with Dr762–Dr496 as the variable was the highest (R2 = 0.804) (Table IV).
Correlation Between LNC and CHL of Sugar Beets
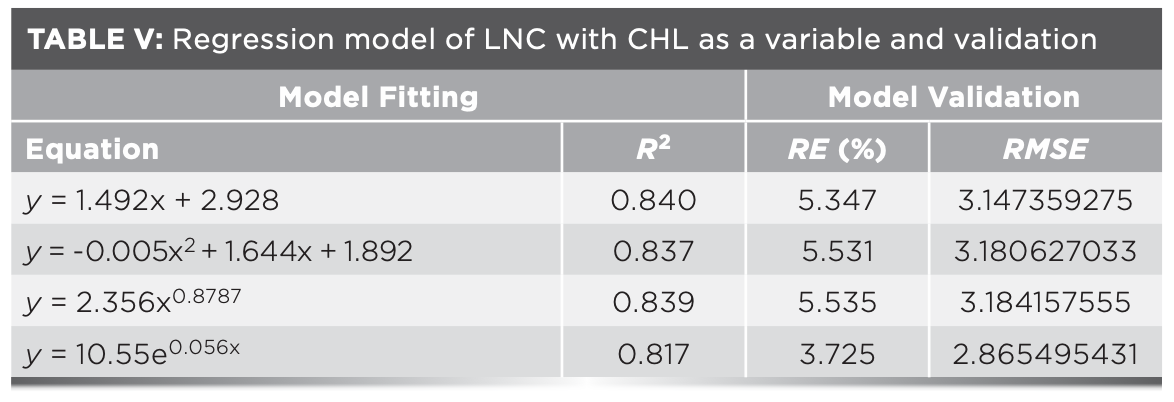
Correlation analysis showed that there was a correlation between LNC and CHL (r = 0.902, P < 0.01). Through multiple functional regression analysis of LNC, it was found that there was a high goodness-of-fit between LNC and CHL for different functional regression models, and the R2 were above 0.8. R2 showed small differences among different function regression models. The RE (%) and RMSE for the exponential function model were low, indicating that the regression model of exponential function with CHL as a variable could well estimate the LNC of sugar beets.
Estimation of LNC Based on Spectral Characteristic Parameters and Vegetation Indices and Validation
Hyperspectral characteristic parameters and vegetation indices in Table IV were selected to construct a multivariate linear regression equation for estimating LNC, in which CHL was taken as the independent variable x1, hyperspectral data was taken as the independent variable x2, and LNC was taken as the dependent variable y. Through the model construction and accuracy analysis, the HYP-CHL-LNC models all had a better linear relationship than the HYP-LNC models and the accuracy were also high (R2 > 0.8). Among them, R2 of the HYP-CHL-LNC model with DR762 as the independent variable reached 0.879, indicating that the model with CHL and hyperspectral data as independent variables could better estimate LNC (Table V).
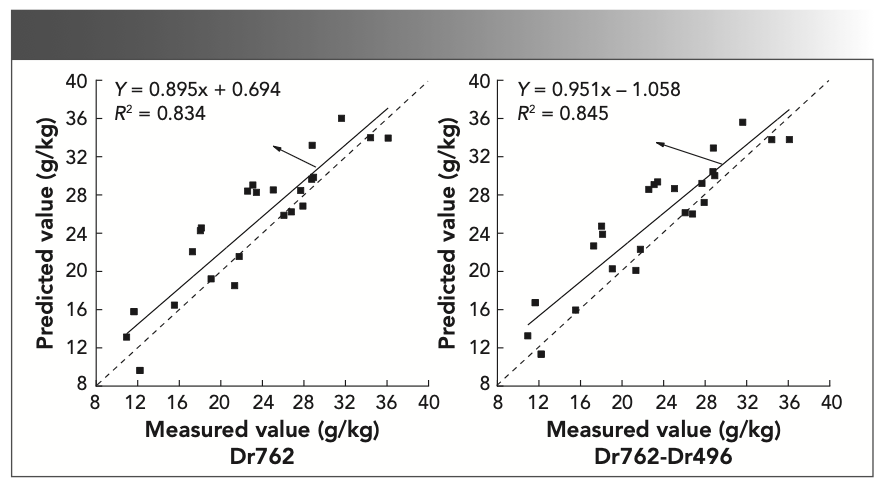
The accuracy of the HYP-CHL-LNC models were analyzed (Table VI). By comparing the RE (%) and RMSE of each model, it was found that the R2 of the LNC estimation models with Dr762 and Dr762–Dr496 as the variables were above 0.87, and the RE (%) and RMSE were low. Although R2 of the models with Dr762 as the variable were higher than those of the models with Dr762 and Dr496 as the variables, RE (%) were relatively high. So it was difficult to select the optimal estimation model. Therefore, the model fitting using predicted values and measured values with Dr762 and Dr762–Dr496 as the variables was conducted in this study. According to the analysis of model fitting, it was found that with the DR762–DR496 as the variable, the goodness of fit was the highest (R2 = 0.845). Therefore, the linear estimation model with CHL and DR762–DR496 as independent variables could better estimate the LNC among the models (Figure 4).
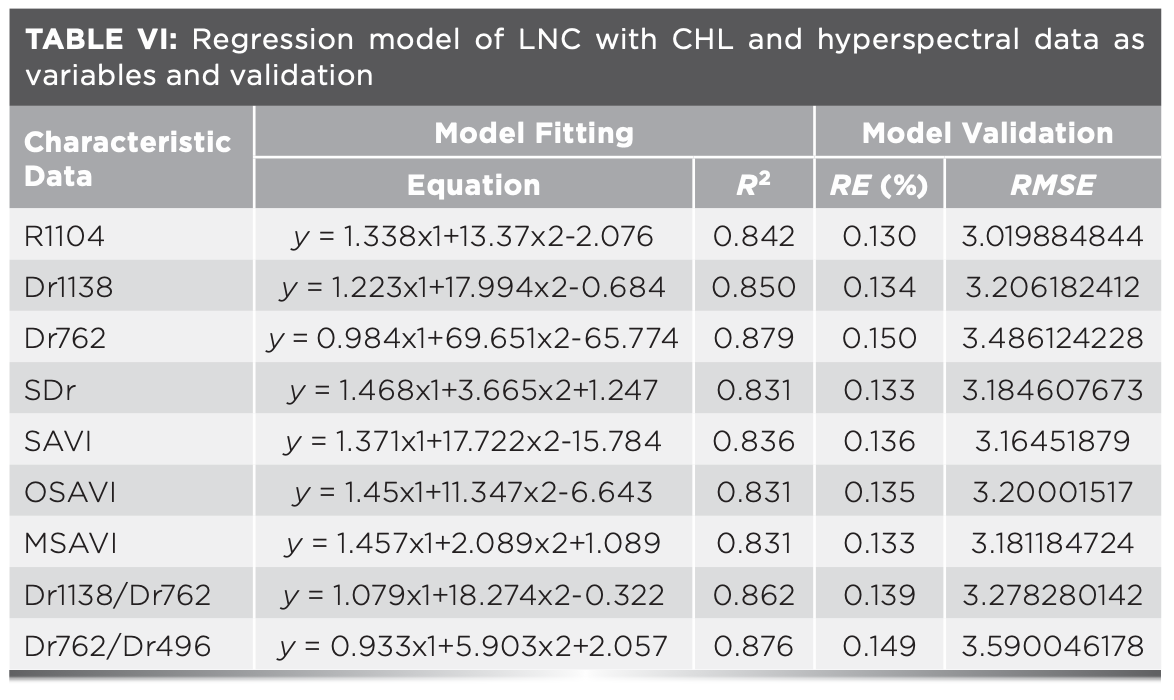
FIGURE 4: Validation of LNC estimation model under different hyperspectral characteristic parameters and vegetation indices of sugar beets.
Discussion
The estimation of LNC using hyperspectral remote sensing is complex because of many factors, such as crop canopy structure, leaf surface, and internal characteristics. Chemical, optical, and soil properties can influence it. Knyazikhin (34) found that the canopy structure and its optical properties are the main factors that determine the spectral reflectance. Canopy structure is very complex. Photons collide, intercept, and scatter in the structure, and only a small part is intercepted. Therefore, there is no direct correlation between leaf spectral reflectance and LNC. However, the complex connection between leaves, canopy, and ecosystems may cause multiple correlations between LNC and spectral reflectance. Although the physical driving factors of canopy spectral reflectance are necessary and play an important role in simulating canopy biochemical indicators, these physical mechanisms are linked to a series of ecological drives of the ecosystem, canopy, and the internal and external structure of leaves. Nitrogen is the most important component in the carbon and nitrogen cycle, and the availability of nitrogen could largely determine the vegetation canopy structure (35,36). The carbon and nitrogen cycle is the key to the operation of ecosystem. Photosynthesis provides energy and materials for the growth and reproduction of vegetation. The quantitative changes in the nitrogen content provide direct information about vegetation canopy (37). This also shows the linkage between nitrogen content and canopy structure, which has direct or indirect influence on the spectral reflectance of the canopy. However, the CHL and hyperspectral reflectance are extremely sensitive. They could determine the photosynthetic rate. Therefore, the biological and physical characteristics of crops could not be evaluated in isolation.
The accuracy of estimation models of agronomic parameters using different algorithms are different (38–40), and the correlations between different combinations of sensitive bands and agronomic parameters are also different (41,42). Although the combination of different algorithms and different sensitive bands could improve the estimation accuracy, it is still based on the spectral data in essence. Its purpose is to remove the interference in the spectral data and extract the spectral data relating to agronomic parameters. However, the estimation of agronomic parameters based on hyperspectral data is affected by plant itself (for example, plant canopy structure) and its surrounding environment (for example, soil properties and suspended particulate matter). The movements of photons in the internal structure of plants and the multiple interference factors could reduce the estimation accuracy of agronomic parameters. Therefore, reducing the interference factors and the photon loss could directly improve the correlation between the spectral data and agronomic parameters. It is also an important step to improve estimation accuracy. This study estimated the LNC of sugar beet using multiple parameters. The indirect relationship between the movement consumption of photons and LNC is transformed into the direct relationship between the movement con- sumption of photons and CHL. The results showed that the estimation model of LNC with spectral data and CHL as independent variables has the optimal accuracy. However, the biological and physical characteristics of crops have a great impact on spectral data, so we should use the spectral processing methods and working principles to reduce the interference factors between spectral data and agronomic parameters, and also need to conduct extensive simulations using a wide range of wavelengths.
Conclusion
For all models, the coefficient of determination for the multivariate linear regression model with CHL and DR762-DR496 as independent variables reached 0.876, the relative error (RE) (%) was 0.149, the root mean square error (RMSE) was 3.59, and the goodness-of-fit between the predicted value and the measured value reached 0.845. Therefore, compared with other estimation models, the multivariate linear regression model with CHL and DR762–DR496 as independent variables is the optimal model for estimating the LNC of sugar beet.
Among the HYP-LNC models using multiple functions, the model based on linear function with the difference vegetation index Dr762–Dr496 as the variable is the optimal model for estimating the LNC of sugar beets. The R2 was 0.794, the RE (%) was 23.008, and the RMSE was 5.372.
The HYP-CHL-LNC models have a better linear regression relationship than the HYP-LNC models, and the accuracy was also higher. Among the models, the R2 of the multivariate linear regression model with CHL and Dr762–Dr496 as independent variables was 0.876, the RE (%) was 0.149, the RMSE was 3.590, and the goodness of fit between predicted value and measured value was 0.845. Thus, this model is the optimal model for estimating the LNC of sugar beets.
Through comparing the vegetation indices constructed by the predecessors, correlations between vegetation indices and the LNC (P < 0.01) were found, indicating that different crops at different latitudes and the constructed vegetation indices could be used to estimate LNC. However, because of the differences in environment and crops, there is a certain difference in the agreement between the constructed vegetation indices and LNC. This study was only conducted in Shihezi, Xinjiang Province, China, but the estimation of LNC of sugar beets using hyperspectral remote sensing data may be affected by the surrounding environment, canopy structure, leaf angle and structure, and other factors, so the results need to be further verified.
References
(1) Singh, A.; Kumar, A.; Jaswal, A.; Singh, M.; Gaikwad, D. S. Nutrient Use Efficiency Concept and Interventions for Improving Nitrogen Use Efficiency. Plant Arch. 2018, 18 (1), 1015–1023. http://www.plantarchives.org/PDF%20181/1015-1023%20(PA3%204123).pdf.
(2) Eckhoff, J. L. A. Split Application of Nitrogen on Irrigated Sugarbeet. J. Sugar Beet Res. 1995, 32 (4), 175–183.
(3) Abdallah, A.; Mekdad, A. Sugar Beet Productivity as Affected by Nitrogen Fertilizer and Foliar Spraying with Boron. Int. J. Curr. Microbiol. App. Sci. 2015, 4 (4), 181–196.
(4) Stone, M. L.; Soile, J. B.; Raun, W. R.; Whit- ney, R W.; Taylor, S. L.; Ringer, J. D. Use of Spectral Radiance for Correcting In-Season Fertilizer Nitrogen Deficiencies in Winter Wheat. Trans. ASAE 1996, 39 (5), 1623–1631.
(5) Thomas, J. R.; Oerther, G. F. Estimating Nitrogen Content of Sweet Pepper Leaves by Reflectance Measurements. Agron. J. 1972, 64 (1), 11–13. DOI: 10.2134/agronj1972.00021962006400010004x
(6) Tian, Y. C.; Yao, X.; Yang, J.; Cao, W. X.; Hannaway, D. B.; Zhu, Y. Assessing Newly Developed and Published Vegetation Indices for Estimating Rice Leaf Nitrogen Concentration with Ground- and Space-Based Hyperspectral Reflectance. Field Crops Res. 2011, 120 (2), 299–310. DOI: 10.1016/j.fcr.2010.11.002
(7) Wang, W.; Yao, X.; Yao, X. F.; Tian, X. C.; Liu, X. J.; Ni, J.; Cao, W. X.; Zhu, Y. Estimating Leaf Nitrogen Concentration with Three-Band Vegetation Indices in Rice and Wheat. Field Crops Res. 2012, 129, 90–98. DOI: 10.1016/j.fcr.2012.01.014
(8) Menesatti, P.; Antonucci, F.; Pallottino, F.; Roccuzzo, G.; Allegra, M.; Stagno, F.; Intrigliolo, F. Estimation of Plant Nutritional Status by Vis-NIR Spectrophotometric Analysis on Orange Leaves [Citrus sinensis (L) Osbeck cv Tarocco] Biosyst. Eng. 2010, 105 (4), 448–454. DOI: 10.1016/j.biosystemseng.2010.01.003
(9) Zhang, G. C.; Li, Z.; Yan, X. M.; Cheng, C. G.; Zhou, P.; Guo, L. L.; Zhou, C. J.; Liu, N.; Han, X. R. Rapid Analysis of Apple Leaf Nitrogen Using Near Infrared Spectroscopy and Multiple Linear Regression. Commun. Soil Sci. Plant Anal. 2012, 43 (13), 1768–1772. DOI: 10.1080/00103624.2012.684824.
(10) Song, X.; Xu, D. Y.; He, L.; Feng, W.; Wang, Y. H.; Wang, Z. J.; Coburn, C. A.; Guo, T. C. Using Multi-angle Hyperspectral Data to Monitor Canopy Leaf Nitrogen Content of Wheat. Precis. Agric. 2016, 17, 721–736. DOI: 10.1007/s11119-016-9445-x
(11) Hussain, A.; Sahoo, R. N.; Kumar, D.; Pradhan, S. Relationship of Hyperspectral Reflectance Indices with Leaf N and P Concentration, Dry Matter Accumulation and Grain Yield of Wheat. J. Indian Soc. Remote Sens. 2017, 45, 773–784. DOI: 10.1007/s12524-016-0633-y
(12) Mahajan, G. R.; Pandey, P. N.; Sahoo, R. N.; Gupta, V. K.; Datta, S. C.; Kumar, D. Monitoring Nitrogen, Phosphorus and Sulphur in Hybrid Rice (Oryza sativa L.) Using Hyperspectral Remote Sensing. Precis. Agric. 2017, 18, 736–761. DOI: 10.1007/s11119-016-9485-2
(13) Sun, D. W.; Cen, H. Y.; Weng, H. Y.; Wan, L.; Abdalla, A.; El–Manawy, A. I.; Zhu, Y. M.; Zhao, N.; Fu, H. W.; Tang, J.; Li, X. L.; Zheng, H. K.; Shu, Q. Y.; Liu, F.; He, Y. Using Hyperspectral Analysis as a Potential High Throughput Phenotyping Tool in GWAS for Protein Content of Rice Quality. Plant Methods 2019, 15 (54), 1–16. DOI: 10.1186/s13007-019-0432-x
(14) Xu, D. Q.; Liu, X. L.; Wang, W.; Chen, M.; Kan, H. C.; Li, C. F.; Zheng, S. F. Hyper-spectral Characteristics and Estimation Model of Leaf Chlorophyll Content in Cotton Under Waterlogging Stress. Chin. J. Appl. Ecol. 2017, 28 (10), 3289–3296. DOI: 10.13287/j.1001-9332.201710.013
(15) Wu, H. B.; Zhu, Y.; Tian, Y. C.; Yao, X.; Liu, X. J.; Zhou, Z. G.; Cao, W. X. Relationship Between Canopy Hyperspectra Parameter and Leaf Nitrogen Concentration in Cotton. Chin. J. Plant Ecol. 2007, 31 (5), 903–909. DOI: 10.17521/cjpe.2007.0114
(16) Shetty, N.; Rinnan, Å.; Gislum, R. Selection of Representative Calibration Sample Sets for Near-Infrared Reflectance Spectroscopy to Predict Nitrogen Concentration in Grasses. Chemom. Intell. Lab. Syst. 2012, 111 (1), 59–65. DOI: 10.1016/j.chemolab.2011.11.013
(17) Wang, Y.; Li, M.; Ji, R.; Wang, M.; Zheng, L. Comparison of Soil Total Nitrogen Content Prediction Models Based on Vis-NIR Spectroscopy. Sensors 2020, 20 (24), 7078. DOI: 10.3390/s20247078
(18) Beć, K. B.; Huck, C. W. Breakthrough Potential in Near-Infrared Spectroscopy: Spectra Simulation. A Review of Recent Developments. Front. Chem. 2019, 7. DOI: 10.3389/fchem.2019.00048
(19) Zhang, X. Z. Determination of Chlorophyll Content in Plants—Acetone Ethanol Mixture Method. Liaoning Agric. Sci. 1986, 3, 26–28.
(20) Yao, X.; Zhu, Y.; Tian, Y. C.; Cao, W. X. Exploring Hyperspectral Bands and Estimation Indices for Leaf Nitrogen Accumulation in Wheat. Int. J. Appl. Earth Obs. Geoinf. 2010, 12 (2), 89–100. DOI: 10.1016/j.jag.2009.11.008
(21) Rouse, J. W.; Haas, R. H.; Schell, J. A.; Deer- ing, D. W. Monitoring Vegetation Systems in the Great Plains with ERTS. In Third ERTS-1 Symposium NASA, NASA SP-351; Washington DC, 1974; pp 309–317. https://ntrs.nasa.gov/api/citations/19740022614/downloads/19740022614.pdf
(22) Liang, L.; Yang, M. H.; Deng, K. D.; Zhang, L. P.; Lin, H.; Liu, Z. X. A New Hyperspectral Index for the Estimation of Nitrogen Contents of Wheat Canopy. Acta Ecol. Sin. 2011, 31 (21), 6594–6605.
(23) Gitelson, A.; Merzlyak, M. N. Spectral Reflectance Changes Associated with Autumn Senescence of Aesculus hippocastanum L. and Acer platanoides L. Leaves. Spectral Features and Relation to Chlorophyll Estimation. J. Plant Physiol. 1994, 143 (3), 286–292. DOI: 10.1016/S0176- 1617(11)81633-0
(24) Sims, D. A.; Gamon, J. A. Relationships Between Leaf Pigment Content and Spectral Reflectance Across a Wide Range of Species, Leaf Structures and Developmental Stages. Remote Sens. Environ. 2002, 81 (2–3), 337–354. DOI: 10.1016/S0034-4257(02)00010-X
(25) Gitelson, A.; Merzlyak, M. N. Signature Analysis of Leaf Reflectance Spectra: Algorithm Development for Remote Sensing of Chlorophyll. J. Plant Physiol. 1996, 148 (3–4), 494–500. DOI: 10.1016/S0176-1617(96)80284-7
(26) Huete, A. R. A Soil-Adjusted Vegetation Index (SAVI). Remote Sens. Environ. 1988, 25 (3), 295–309. DOI: 10.1016/0034-4257(88)90106-X
(27) Rondeaux, G.; Steven, M.; Baret, F. Optimization of Soil-Adjusted Vegetation Indices. Remote Sens. Environ. 1996, 55 (2), 95–107. DOI: 10.1016/0034-4257(95)00186-7
(28) Haboudane, D.; Miller, J. R.; Pattey, E.; Zarco, P. J. Hyperspectral Vegetation Indices and Novel Algorithms for Predicting Green LAI of Crop Canopies: Modeling and Validation in the Context of Precision Agriculture. Remote Sens. Environ. 2004, 90 (3), 337–352. DOI: 10.1016/j.rse.2003.12.013
(29) Chen. P. F.; Haboudane, D.; Trembley, N.; Wang, J. H.; Vigneault, P.; Li, B. G. New Spectral Indicator Assessing the Efficiency of Crop Nitrogen Treatment in Corn and Wheat. Remote Sens. Environ. 2010, 114 (9), 1987–1997. DOI: 10.1016/j.rse.2010.04.006
(30) Gitelson, A. A.; Vina, A.; Ciganda, V.; Rundquist, D. C.; Arkebauer, T. J. Remote Estimation of Canopy Chlorophyll Content in Crops. Geophys. Res. Lett. 2005, 32 (8), 1–4. DOI: 10.1029/2005GL022688
(31) Serrano, L.; Penuelas, J.; Ustin, S. L. Remote Sensing of Nitrogen and Lignin in Mediterranean Vegetation from AVIRIS Data: Decomposing Biochemical from Structural Signals. Remote Sens. Environ. 2002, 81 (2–3), 355–364. DOI: 10.1016/S0034-4257(02)00011-1
(32) Broge, N. H.; Leblanc, E. Comparing Prediction Power and Stability of Broadband and Hyperspectral Vegetation Indices for Estimation of Green Leaf Area Index and Canopy Chlorophyll Density. Remote Sens. Environ. 2001, 76 (2), 156–172. DOI: 10.1016/S0034-4257(00)00197-8
(33) Chen, J. X.; Huang, S.; Fan, Y. F.; Wang, R.; Liu, Q. L.; Yang, W. Y.; Yang, F. Remote Detection of Canopy Leaf Nitrogen Status in Soybean by Hyperspectral Data under Monoculture and Intercropping Systems. Acta Agron. Sin. 2017, 43 (12), 1835–1844.
(34) Knyazikhin, Y.; Schull, M. A.; Stenberg, P.; Mottus, M.; Rautiainen, M.; Yang, Y.; Marshak, A.; Carmona, P. L.; Kaufmann, R. K.; Lewis, P.; Disney, M. I.; Vanderbilt, M. V.; Davis, A. B.; Baret, F.; Jacquemoud, S. J.; Lyapustin, A.; Myneni, R. B. Hyperspectral Remote Sensing of Foliar Nitrogen Content. Proc. Natl. Acad. Sci. U.S.A. 2013, 110 (3), E185–E192 DOI: 10.1073/pnas.1210196109.
(35) Ollinger, S. V.; Reich, P. B.; Frolking, S.; Lepine, L. C.; Hollinger, D. Y.; Richardson, A. D. Nitrogen Cycling, Forest Canopy Reflectance, and Emergent Properties of Ecosystems. Proc. Natl. Acad. Sci. U.S.A. 2013, 110 (27), E2437. DOI: 10.1073/pnas.1304176110
(36) Townsend, P. A.; Serbin, S. P.; Kruger, E. L.; Gamon, J. A. Disentangling the Contribution of Biological and Physical Properties of Leaves and Canopies in Imaging Spectroscopy Data. Proc. Natl. Acad. Sci. U.S.A. 2013, 110 (12), E1704. DOI: 10.1073/pnas.1300952110
(37) Ustin, S. L. Remote Sensing of Canopy Chemistry. Proc. Natl. Acad. Sci. U.S.A. 2013, 110 (3), 804–805. DOI: 10.1073/pnas.1219393110
(38) Wang, F.; Huang, J. F.; Wang, Y.; Liu, Z. Y.; Zhang, F. Y. Estimating Nitrogen Concentration in Rape from Hyperspectral Data at Canopy Level Using Support Vector Machines. Precis. Agric. 2013, 14, 172–183. DOI: 10.1007/s11119-012-9285-2
(39) Huang, L. S.; Ding, W. J.; Liu, W. J.; Zhao, J. L.; Huang, W. J.; Xu, C.; Zhang, D. Y.; Liang, D. Identification of Wheat Powdery Mildew Using In-Situ Hyperspectral Data and Linear Regression and Support Vector Machines. J. Plant Pathol. 2019, 101, 1035–1045. DOI: 10.1007/s42161-019-00334-2
(40) Stellacci, A. M.; Castrignanò, A.; Troccoli, A.; Basso, B.; Buttafuoco, G. Selecting Optimal Hyperspectral Bands to Discriminate Nitrogen Status in Durum Wheat: A Comparison of Statistical Approaches. Environ. Monit. Assess. 2016, 188, 199. DOI: 10.1007/s10661-016-5171-0
(41) Li, F.; Miao, Y. X.; Hennig, S. D.; Gnyp, M. L.; Chen, X. X.; Jia, L. L.; Bareth, G. Evaluating Hyperspectral Vegetation Indices for Estimating Nitrogen Concentration of Winter Wheat at Different Growth Stages. Precis. Agric. 2010, 11 (4), 335–357. DOI: 10.1007/s11119-010-9165-6
(42) Tian, Y. C.; Gu, K. J.; Chu, X.; Yao, X.; Cao, Y. X.; Zhu, Y. Comparison of Different Hyperspectral Vegetation Indices for Canopy Leaf Nitrogen Concentration Estimation in Rice. Plant Soil 2014, 376, 193–209. DOI: 10.1007/s11104-013-1937-0
Zong-fei Li, Hua Fan, Cong Fei, Ji-xia Su, Yang-yang Li, Ning-ning Liu, Hong-liang Zhou, Li-juan Zhang, and Kai-yong Wang are with Agronomy College at Shihezi University, in Xinjiang, China. Bing Chen is with the Cotton Institute at the Xinjiang Academy of Agricultural and Reclamation Science, in Xinjiang, China. Direct correspondence to Hua Fan at fanhua@shzu.edu.cn or Bing Chen at zyrcb@126.com. ●
