Identifying Synthetic Designer Drugs Using FT-IR, Raman, and GC–IR
Law enforcement relies upon "schedules" or lists of controlled substances. In an attempt to circumvent the law, clandestine laboratories produce synthetic designer drugs that are chemically related to a controlled substance, but are different enough to raise legal issues with prosecution.
Law enforcement relies upon "schedules" or lists of controlled substances. In an attempt to circumvent the law, clandestine laboratories produce synthetic designer drugs that are chemically related to a controlled substance, but are different enough to raise legal issues with prosecution. Identification of the drugs as evidence requires exact information, including isomeric and stereochemical specificity. We show here examples where infrared (including gas chromatography–infrared spectroscopy) or Raman spectroscopy paired with reference libraries can provide the needed specificity with the additional advantage of being fast.
Law enforcement agencies worldwide report increasing street supplies of synthetic drugs, including so-called "bath salts" and cannabinoids. The United States Drug Enforcement Administration (DEA) and other law enforcement agencies recently initiated a major raid targeting all levels of the global synthetic designer drug market (1). Small chemical modifications made to known drugs result in new drugs that may not be on federal or state controlled substance lists. Words in laws such as "analogue" tend to leave interpretation open to juries. Court cases may hinge on the exact positional or stereochemical isomer, which juries are likely not technically competent to assess. As laws tighten, convictions remain dependent on incisive forensic analysis.
The Scientific Working Group for the Analysis of Seized Drugs (SWGDRUG, www.swgdrug.org) defines infrared and Raman spectroscopy as two of a limited number of "Category A" analytical techniques providing the highest potential discriminating power (2). For seized-drug identification, it is most desirable to use a Category A technique combined with at least one other technique (Category A, B, or C). To assist forensics laboratories in the drug identification process, scientists at the Cayman Chemical Company, the Tennessee Bureau of Investigation (TBI), and Thermo Fisher Scientific collaborated to make high quality libraries of reference spectra (dispersive Raman, attenuated total reflection-infrared [ATR-IR], and vapor-phase IR) from synthetic designer drugs available. Here, we discuss the importance of Fourier transform infrared (FT-IR) and Raman spectroscopy, enabled by these libraries, in identifying designer drugs in seized materials (3). We also present how gas chromatography with IR detection (GC–IR) enables the identification of specific isomers of synthetic drugs even when present in complex matrices like plant material.
Experimental
Reference Raman and FT-IR spectra were acquired using compounds obtained from Cayman Chemical Company. FT-IR spectra were acquired at 2 cm-1 resolution with a diamond ATR accessory integrated into a Thermo Scientific Nicolet iS50 FT-IR spectrometer. The Raman spectra were acquired on a Thermo Scientific DXR Raman system with 532-nm laser excitation, a 900-line/mm grating and a 25-μm slit. The Raman and infrared spectra acquired from a sample of mephedrone shown in Figure 1 demonstrate the complementary nature of these two techniques, which emphasize different functional groups in the molecule (4). In this example, we labeled the peak locations to allow easy comparison to the spectra in the SWGDRUG monographs.
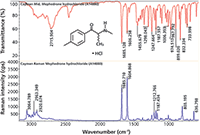
Figure 1: Comparison of FT-IR and Raman spectra from mephedrone, a psychoactive compound commonly known as "meow meow."
GC–IR vapor-phase spectra were acquired at TBI. Standards of cannabinoids, bath salts, and other drugs were mixed with solvent (typically methanol) to obtain 1-mg/mL solutions.
A 5-m silica capillary with a 0.30-mm cross section coated with bonded poly(1% diphenyl, 99% dimethylsiloxane) was used. The temperature program was as follows: 80 °C for 1 min, then 70 °C/min from 80 °C to 270 °C, and 270 °C for 20 min. This combination of short column and fast ramp is used because the drugs have low volatility, which can lead to long retention times. Under these conditions, seized materials often exhibit incomplete separation (plant extracts and contaminants being present), necessitating further analysis as noted below. The resulting reference spectra were grouped into the TBI gas phase library.
Figure 2 shows GC–IR results for three compounds that illustrate spectral differences among highly similar isomers. This ability to identify isomers is a major advantage of both IR and Raman spectroscopy.
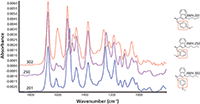
Figure 2: Comparison of vapor-phase spectra for three closely related cannabinoids.
Results and Discussion
The fundamental issue for forensics laboratories involves making a complete and confident identification of seized materials. This is most often done by spectral searching, either using commercial or locally-made libraries. Spectral searching involves matching a sample spectrum to a library spectrum. Typically, a metric is reported representing "goodness of agreement" (0–1, 0–100). The value of the metric can be affected by sampling differences between the library spectra and the target spectrum. We illustrate both the specificity (that is, isomer versus isomer) and robustness (when collection methods differ) for identification of synthetic designer drugs. Because laboratories may exchange data or use commercial products, robustness is critical in determining the usability of results as evidence.
Using the Dispersive Raman Reference Library with Fourier Transform Raman Spectra
Dispersive and Fourier transform (FT) Raman spectroscopy each have strengths and weaknesses. Here, we consider whether library spectra collected using dispersive Raman can be used to match spectra from an FT-Raman analysis. Fundamentally, both methods respond to the same vibrational events, but there are subtle differences in data spacing, resolution, and intensities that could affect the identification.
Searching the FT-Raman spectrum of an unknown against the dispersive Raman library achieves the results shown in Figure 3. The algorithm returns a metric of 96 for harmaline. Although care must be used in over-emphasizing metrics, 96 is generally considered a strong match. This lends credence to the use of this database with Raman spectra acquired with different laser excitation wavelengths.
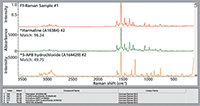
Figure 3: Search results for an FT-Raman spectrum (1064-nm laser). The library spectra were collected with 532-nm excitation (dispersive).
The substance identified, harmaline, is a psychoactive indole found naturally in certain plants. Harmaline has been identified as an adulterant in herbal mixtures containing synthetic cannabinoids and may contribute to poisoning when combined with a hallucinogenic tryptamine. Harmaline is controlled in Australia, Canada, and France, but it is uncontrolled in the United States (except for regulation as a food or drug additive).
Using the ATR Reference Library with Transmission Spectra
ATR spectroscopy is becoming the technique of choice for rapid infrared spectral analysis. With minimal (or no) sample preparation and rapid data collection, ATR can provide a first screen when samples enter the laboratory. Even so, many forensics laboratories still prefer (or are required) to use traditional transmission techniques based on KBr pellets or Nujol (mineral oil) mulls (5).
The transmission spectrum at the top of Figure 4 was acquired from a Nujol mull of harmaline. The large Nujol C-H peaks have been removed (blanked, not subtracted) before the search. The library spectra, collected using a diamond ATR accessory, were processed using an advanced ATR correction algorithm that normalizes the intensity and line shape as expected for transmission spectra (6). The sample was correctly identified as harmaline with a metric of 93. Similar results are obtained in the reverse case, when ATR spectra are corrected and compared with existing transmission-based spectral libraries, which has historically been the most common basis for libraries. This interchangeability permits laboratories to continue to use historical (transmission) databases.
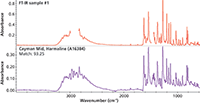
Figure 4: Search results for a sample run as a Nujol (mineral oil) mull with a reference library created from spectra after applying the advanced ATR correction.
Using the ATR Reference Library with Spectra from a Handheld Spectrometer
Field operations requiring instant, confident identification of materials are becoming more prevalent. Collecting data at the scene provides evidence as well as safety for investigators exposed to the materials.
Figure 5 shows an infrared spectrum acquired with a handheld instrument (Thermo Scientific TruDefender) from a white powder discovered at a clandestine laboratory. The results of searching off-line the external ATR reference library produced a best match to 3-methylmethcathinone (3-MMC) hydrochloride with a value of 93. The result: A very good match was obtained for a spectrum acquired in the field from a sample of questionable purity under less than ideal conditions (7,8).
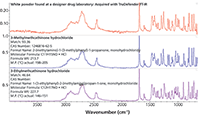
Figure 5: Search results for a spectrum acquired in the field on a handheld FT-IR system.
The substance 3-MMC is a psychoactive synthetic cathinone that has been identified in bath salts. Most countries have made the material illegal, either explicitly or as a structural analog to mephedrone (4-MMC), for which a more extensive legal history exists.
Using the ATR Reference Library with Mixture Spectra
Clandestine laboratories rarely maintain tight quality controls, resulting in product that can be mixtures of two or more active compounds as well as containing precursors or contaminants. Ultimately, prosecution requires accurate and complete information about the sample. Infrared and Raman spectra reflect the mixed character of the product, but individual identifications are still required.
A sample was run via ATR and a simple (one-component) search against the ATR reference library was carried out. This approach resulted in a low match value — under 70 — with a number of peaks clearly not accounted for. Further analysis options exist, with the best option being advanced statistical analysis techniques such as multicomponent searching (MCS).
Figure 6 shows the MCS results (using Thermo Scientific OMNIC Specta software) for the sample. The automated selection of two components from the ATR library results in a high similarity of the composite spectrum to the sample spectrum. Results similar to this enable FT-IR-MCS to become a first screen when materials arrive, being far quicker than most alternatives.
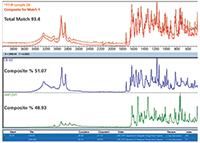
Figure 6: Results from a multicomponent search of a sample of a mixture.
CB-52 is a relative newcomer as a synthetic cannabinoid, with many questions still circulating regarding efficacy. Shown to provide therapeutic effects in mice, there are few reports of activity in humans. AM-1241 is a known potent and selective agonist for one of the key cannabinoid receptors in humans.
Using the Vapor-Phase Library with GC–IR Spectra
Methcathinones often appear labeled as bath salts or plant food ("not for human consumption"). Cannabinoids can be sold as a coating on plant material which are labeled as "potpourri." In both cases, simple IR or Raman analysis may be inconclusive as the drug is swamped by matrix. GC–IR offers a potent tool for separating and identifying the drugs (9).
Potpourri samples are soaked in a tiny excess of solvent like methanol. After this "washing," the excess drop is drawn up into a GC syringe. Powdered samples are dissolved directly and then drawn up into the syringe. Unlike the more sensitive gas chromatography–mass spectrometry (GC–MS), in GC–IR the sample remains intact (it is not fragmented), so isomeric and stereochemical information can be observed.
The GC conditions that were chosen force rapid elution, resulting in overlapped chromatographic peaks, as shown in the inset to Figure 7. The largest peak results from multiple components eluted simultaneously, so the associated spectrum contains multiple signals. A multicomponent search resulted in a clear match to two cannabinoids. Even overlapped, the IR data unambiguously determine the specific isomers eluted.
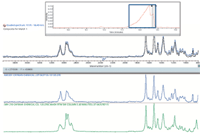
Figure 7: GCâIR result for a mixed drug extracted from a suspect potpourri sample.
AM-2201 is a potent cannabinoid agonist, which has reportedly caused panic attacks and severe nausea and vomiting. JWH-210 is a strong analgesic which is also an agonist for the cannabinoid receptors. Both are listed by multiple countries as being illegal substances.
Conclusions
The importance of identifying new synthetic compounds being sold as "legal highs" is increasing as the materials are being distributed throughout the world. The results of this evaluation demonstrate the value of using targeted reference spectral libraries with FT-IR and Raman instruments to rapidly screen and identify designer drugs. Excellent results were obtained with the reference libraries even with older instrumentation and different types of spectrometers. We plan to add new compounds to the libraries as they become available.
Steve Lowry is a senior application scientist for the laboratory FT-IR products with Thermo Fisher Scientific in Madison, Wisconsin. Mike Bradley is a marketing manager with Thermo Fisher Scientific. Wayne Jalenak is a senior application scientist for the portable analytical instruments with Thermo Fisher Scientific in Tewksbury, Massachusetts. Direct correspondence to: steve.lowry@thermofisher.com
References
(1) DEA Website announcement of synthetic drug crackdown: http://www.justice.gov/dea/divisions/hq/2014/hq050714.shtml.
(2) SWGDRUG Recommendations Edition 6.1 (2013-11-01), www.swgdrug.org, (2013-11-01).
(3) S. Angelos and M. Garry, Forensics Magazine 08, 5 (2011)
(4) E.G. Bartick, in Handbook of Vibrational Spectroscopy, J.M. Chalmers and P.R. Griffiths, Eds. (John Wiley and Sons, Ltd., New York, 2002), pp. 2993–3004.
(5) S. Kumar, P, Joshi, and A. Raivanshi, Internet Journal of Forensic Science 4, (2008).
(6) B. Lavine, A. Fasasi, N. Mirjankar, K. Nishikida, and J. Cambell, Appl. Spectrosc. 68, 608–615, (2014).
(7) E. Bukowski and J. Monti, Am. Lab. 39, 16–19 (2007).
(8) C. Goh, W. van Bronswijk, and C. Priddis, Appl. Spectrosc. 62, 640–648 (2008).
(9) G. Everrett, W. Stanton, and M. Bradley, Thermo Scientific Application Note 52418, (2012).
AI Shakes Up Spectroscopy as New Tools Reveal the Secret Life of Molecules
April 14th 2025A leading-edge review led by researchers at Oak Ridge National Laboratory and MIT explores how artificial intelligence is revolutionizing the study of molecular vibrations and phonon dynamics. From infrared and Raman spectroscopy to neutron and X-ray scattering, AI is transforming how scientists interpret vibrational spectra and predict material behaviors.
Real-Time Battery Health Tracking Using Fiber-Optic Sensors
April 9th 2025A new study by researchers from Palo Alto Research Center (PARC, a Xerox Company) and LG Chem Power presents a novel method for real-time battery monitoring using embedded fiber-optic sensors. This approach enhances state-of-charge (SOC) and state-of-health (SOH) estimations, potentially improving the efficiency and lifespan of lithium-ion batteries in electric vehicles (xEVs).
New Study Provides Insights into Chiral Smectic Phases
March 31st 2025Researchers from the Institute of Nuclear Physics Polish Academy of Sciences have unveiled new insights into the molecular arrangement of the 7HH6 compound’s smectic phases using X-ray diffraction (XRD) and infrared (IR) spectroscopy.