Measuring Orientation in Polymer Films
The mechanical properties of polymer films such as tensile strength and resistance to tearing depend strongly on the orientation of the polymer chains. Fourier transform infrared (FT-IR) spectroscopy can be used to measure the degree of orientation both within the plane of the film and normal to it.
The mechanical properties of polymer films such as tensile strength and resistance to tearing depend strongly on the orientation of the polymer chains. Fourier transform infrared (FT-IR) spectroscopy can be used to measure the degree of orientation both within the plane of the film and normal to it. Tilting the film allows dipole changes normal to the plane to be measured so that three-dimensional orientation can be investigated. Attenuated total reflectance (ATR) measurements are sensitive to orientation both in the plane and normal to it, but measure only surface regions. Transmission spectra of thin films often contain interference fringes (channel spectra) that need to be minimized. This article illustrates the different measurements and also considers some of the practical issues.
Synthetic polymers are semicrystalline and contain regions with some order in the arrangement of the polymer chains and disordered amorphous regions. The orientation of the polymer chains within thin films is often anisotropic as a result of the manufacturing process. For example, stretching a film in one direction will tend to align the polymer chains in that direction. Polymer chain orientation has a big effect on mechanical properties such as tensile strength and tear resistance. In general, tensile strength is greater in a direction parallel to the polymer chains than in directions normal to them and the same applies to tear resistance.
Orientation in the plane of films produced by extrusion is defined relative to the machine direction and the transverse direction. Orientation can be investigated in a normal transmission measurement of the absorbance for radiation polarized in either direction. However, because the electric field is in the plane of the film this approach cannot measure any absorption with a dipole moment change normal to the plane. That information can be obtained by transmission at non-normal incidence or, for surface layers, by attenuated total reflectance (ATR).
Measuring Thin-Film Spectra
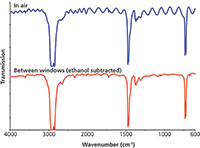
Although polymer films can generally be measured in transmission without any preparation, the spectra often include interference fringes that limit the accuracy of intensity measurements. Several methods have been proposed to reduce the amplitude of these fringes, which are caused by reflection at the film surfaces. One is to reduce the refractive index change by placing the surfaces in contact with a material with a refractive index close to that of the film. Simply clamping the film between windows may not achieve good optical contact, so adding a liquid may be necessary. Figure 1 shows a polyethylene film measured between windows with ethanol as a contact liquid. This contact liquid was chosen because it does not interact with the polymer and has no absorption interfering with the bands of interest near 720 cm-1. Other methods such as abrading the surface or using a polarizer with a tilted film would not be appropriate in this application.

Figure 1: Transmission spectra of an LDPE film in air and in contact with ethanol.
Crystallinity and Orientation
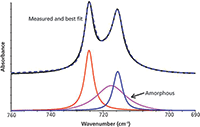
In the spectra there may be some separate features for crystalline and amorphous regions as well as features that are common to both. The differences result from differences in chain conformations or from interactions between the chains in crystalline regions. Figure 2 shows the CH2 rocking bands in a blown film of low-density polyethylene. In crystalline regions, interaction between adjacent chains splits the band into two relatively narrow components at 730 and 719 cm-1, whereas the amorphous regions have a broad absorption. The spectrum can be fitted well using values for the component bands taken from the literature (1). It has been suggested that the amorphous component may give rise to two bands, but this approach did not improve the fit for this example. Although Fourier transform infrared (FT-IR) spectroscopy can be used to compare the degree of crystallinity in different films, calibration is necessary for any quantitative measurements, such as using differential scanning calorimetry.

Figure 2: Crystalline and amorphous components of CH2 rocking bands.
Using Polarized Radiation
Absorption occurs only for dipole moment changes that are perpendicular to the light path. For normal transmission measurements this means that vibrations with dipole moment changes in the plane of the film are seen. A polarizer can be used to confine the electric field to a single direction perpendicular to the direction of propagation, so we can separately measure absorptions in the machine and transverse direction. This approach allows us to use the ratio of the absorbances in the two directions, the dichroic ratio, as a measure of the degree of orientation in the plane of the film.

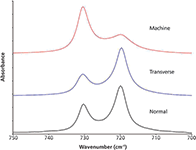
Figure 3: Polarized transmission spectra of polyethylene films: (a) 3M card, (b) blown film.
Figure 3 contrasts a film that is almost isotropic (3M card) with a blown film such as is used in freezer bags. The 3M card has very little amorphous material and the overlap with the absorption of amorphous regions has a negligible effect on the band intensity ratios which are close to 1.0. For the blown film polarizer, orientation at 0° corresponds to the electric field in the transverse direction. The band at 719 cm-1 is strongly oriented in this direction, while the 730 cm-1 band is oriented less strongly in the machine direction. The uncertainty in the orientation of the amorphous component is much larger than for the bands from the crystalline regions.

Table I: Dichroic ratio: (machine direction)/(transverse direction)
Three-Dimensional Orientation
Measurement in normal transmission allows for orientation only in the machine and transverse directions to be determined because the electric field is in the plane of the film. Tilting the film to give non-normal incidence introduces a component of the electric field normal to the plane and so allows orientation in the normal direction to be estimated (Figure 4). When the film is tilted so that light passes through it at an angle β to the normal the component of the electric field normal to the film is proportional to sinβ. The contribution to this spectrum from the component of the field in the plane of the film has to be subtracted. This value is obtained from measurement at normal incidence.

Figure 4: Geometry of a tilted film measurement.
If the absorbance for normal transmission is Ay and that for the tilted film Atilt, the absorbance normal to the plane of the film for a pathlength equal to the film thickness Anorm is given by the following equation (1):

For low-density polyethylene (LDPE) with a 45° angle of incidence this reduces to

The spectra of a blown film for the three directions are shown in Figure 5. The band at 719 cm-1 is strongly oriented in the transverse and normal directions while that at 730 cm-1 is oriented in the machine and normal directions. These results are consistent with the most commonly observed morphology for blown LDPE films.

Figure 5: Spectra for three orientations of the electric field.
The quantitative accuracy of this approach is limited by refractive index effects when using strong bands. This limitation can be seen from the presence of derivative-like features in the residuals from curve fitting. However, the approach is useful for comparing films with different processing conditions.
Surface Orientation
As we have previously described (2), ATR measurements involve electric field components both in the plane of a surface and normal to it. These can be separated by using a polarizer at different film orientations. This approach has been used to measure the orientation at polymer surfaces (3). However, a significant practical issue is the need to ensure identical contact while measuring spectra at different film orientations unless the material has suitable reference bands that are insensitive to orientation. Commercial ATR accessories require the sample to be removed to change the orientation, which introduces a large amount of potential errors. Additionally, there is a risk that the pressure required to obtain good contact may affect the surface orientation. Specifically, in the case of LDPE, differences in band intensities that have been attributed to changes in crystallinity induced by pressure (2) are more likely caused by changes in surface orientation.
Conclusion
Transmission measurements with polarized radiation can provide a simple and rapid measure of the degree of orientation within LDPE films. Similar results can be obtained from other polymers where suitable absorption bands have been identified. Spectra at non-normal incidence give insight into three-dimensional orientation. When ATR spectra are used to determine surface orientation it is important to establish that pressure from the ATR crystal is not affecting the results.
Richard Spragg is an applications scientist with PerkinElmer LAS in Seer Green, England. Direct correspondence to: richard.spragg@perkinelmer.com
References
(1) X.M. Zhang, S. Elkoun, A. Ajji, and M.A. Huneault, Polymer 45, 217–229 (2004).
(2) R.A. Spragg, Spectroscopy supplement FT-IR Technology for Today's Spectroscopists 28(s8), 14–21 (2013).
(3) N.J. Everall and A Bibby, Appl. Spectrosc. 51, 1083–1090 (1997).

AI Shakes Up Spectroscopy as New Tools Reveal the Secret Life of Molecules
April 14th 2025A leading-edge review led by researchers at Oak Ridge National Laboratory and MIT explores how artificial intelligence is revolutionizing the study of molecular vibrations and phonon dynamics. From infrared and Raman spectroscopy to neutron and X-ray scattering, AI is transforming how scientists interpret vibrational spectra and predict material behaviors.
Real-Time Battery Health Tracking Using Fiber-Optic Sensors
April 9th 2025A new study by researchers from Palo Alto Research Center (PARC, a Xerox Company) and LG Chem Power presents a novel method for real-time battery monitoring using embedded fiber-optic sensors. This approach enhances state-of-charge (SOC) and state-of-health (SOH) estimations, potentially improving the efficiency and lifespan of lithium-ion batteries in electric vehicles (xEVs).
New Study Provides Insights into Chiral Smectic Phases
March 31st 2025Researchers from the Institute of Nuclear Physics Polish Academy of Sciences have unveiled new insights into the molecular arrangement of the 7HH6 compound’s smectic phases using X-ray diffraction (XRD) and infrared (IR) spectroscopy.