Resonance-Enhanced Nanoscale IR Spectroscopy of Ultrathin Films and Monolayers on Metals
Resonance-enhanced atomic force microscopy (AFM)–infrared (IR) is a new technique that couples an atomic force microscope with a pulsed tunable IR laser source to provide high spatial resolution chemical analysis of samples as thin as a monolayer. The AFM probe tip acts as a small local detector of the thermal expansion of the sample caused by the absorption of the monochromatic IR radiation.
Resonance-enhanced atomic force microscopy (AFM)–infrared (IR) is a new technique that couples an atomic force microscope with a pulsed tunable IR laser source to provide high spatial resolution chemical analysis of samples as thin as a monolayer. The AFM probe tip acts as a small local detector of the thermal expansion of the sample caused by the absorption of the monochromatic IR radiation. Examples are presented of the use of this technique to obtain highly spatially resolved IR spectra (down to 25 nm) of monolayer levels of material deposited onto gold substrates, including self-assembled monolayers of a hydroxyl-terminated hexa(ethylene glycol) undecanethiol, 4-nitrothiophenol, a monolayer island sample of poly(ethylene glycol) methyl ether thiol, and a 5-nm-thick film of purple membrane from Halobacterium salinarum.
Infrared (IR) microspectroscopy provides a powerful capability for chemically characterizing materials at spatial resolutions down to 5–10 μm. Commercial Fourier transform infrared (FT-IR) spectrometers equipped with microscopes or other microsampling accessories have been an important fixture in most analytical laboratories since the 1980s. In industrial and forensic laboratories, for example, FT-IR microspectroscopy has proven to be one of the most important industrial problem-solving techniques for identifying small amounts of unknown material, including contaminants that occasionally arise during the development of new products or during the actual production processes. In today's world, where nanomaterials are becoming more prevalent, there is an ever-increasing need to chemically characterize smaller and smaller particles and domains. The diffraction-limited spatial resolution of conventional FT-IR microscopes is no longer sufficient to solve many of these important nanoscale problems.
The recent coupling of atomic force microscopy (AFM) with pulsed tunable infrared laser sources has enabled the collection of IR spectra at spatial resolutions below 100 nm × 100 nm (1,2). The sharp AFM tip acts as a local detector of IR absorbance at the surface of a sample it is in contact with. When the wavenumber of the laser source is in resonance with a molecular vibrational frequency, the IR radiation can be absorbed and the sample expands when the molecules return to their ground vibrational state after exchanging energy with the sample matrix. This causes the sample to thermally expand over an area corresponding to the focused IR laser spot. The AFM cantilever will deflect because of the local thermal expansion of the material in proximity to the apex of the AFM probe, providing significantly higher spatial resolution that is not limited by the diffraction limit of the IR wavelength. In the initial configuration of this technique, the optical parametric oscillator (OPO) tunable laser source had a repetition rate of 1 kHz and a pulse length of ~10 ns, which would cause a rapid expansion of the sample inducing an impulse in the cantilever. This would cause the cantilever oscillation to ring down at its natural resonance frequencies after each laser pulse. In this article, we describe how replacing the OPO tunable laser source with a variable repetition rate quantum cascade laser (QCL) produces a signal enhancement of the AFM-IR signal of two orders of magnitude. This enhancement is accomplished by tuning the QCL repetition rate to match the contact resonant frequency mode of the AFM cantilever (3,4). At the contact resonance, the oscillation amplitude of the cantilever is significantly increased relative to off-resonance frequencies. An additional enhancement of the AFM-IR signal results when a gold-coated AFM tip is used, producing a "lightning rod" effect that enhances or localizes the electric field at the tip apex. The combination of matching the repetition rate of the laser to the contact resonance of the AFM cantilever and using a gold-coated probe allows for the collection of IR spectra of samples on arbitrary substrates down to thicknesses of ~10 nm. If the thin film sample is deposited onto a gold substrate, a further increase in the local enhancement of the electric field allows measurements down to less than 1 nm. This enables the AFM-IR technique to detect monolayer coverages of material on metal surfaces at lateral spatial resolutions down to 25 nm × 25 nm.
Experimental
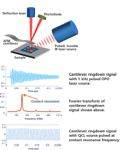
Figure 1 shows an optical diagram of an AFM-IR experiment where a pulsed tunable IR laser source illuminates the surface of a thin film with monochromatic light at a location where an AFM tip is in contact with the sample. The combination of a deflection laser and position-sensitive photodiode enable the determination of the precise vertical position of the AFM cantilever in real time as it rings down after receiving a thermal expansion pulse from the sample induced by absorption of IR laser radiation at a single wavenumber. The amplitude of the AFM cantilever ringdown is directly proportional to the actual amount of IR radiation absorbed by the molecules at the surface of the sample at that particular wavenumber. By stepping the wavenumber of the IR source over a user-selectable range, an IR spectrum can be generated. Figure 1 also shows the difference between the appearance of the cantilever oscillation signals obtained with a 1-kHz repetition rate OPO laser source and a QCL source with its repetition rate tuned to a cantilever contact resonance.

Figure 1: Optical diagram of an AFM-IR experiment showing the difference between the signal responses using a 1-kHz repetition rate OPO laser source and a QCL source with its repetition rate tuned to a contact resonance frequency mode in the AFM cantilever.
Self-assembled monolayers (SAMs) of hydroxyl-terminated hexa(ethylene glycol) undecanethiol (EG6-OH), 4-nitrothiophenol (NTP), and a monolayer island sample of poly(ethylene glycol) methyl ether thiol (PEG) were deposited on template-stripped gold substrates as described previously (4). A cell membrane of purple membrane of Halobacterium salinarum was deposited onto a gold substrate. Measurements of the EG6-OH and NTP monolayer films were made in the Belkin laboratory at the University of Texas using AFM-IR instrumentation equipped with a QCL source with a tuning range of 1375–1130 cm-1 (4). The PEG monolayer island and purple membrane samples were measured using a nanoIR2 instrument (Anasys Instruments) equipped with a broadly tunable (1900–1200 cm-1) QCL source. All spectra were collected using a data point spacing of 2 cm-1, although the QCL source has an IR laser linewidth of less than 1 cm-1.
Results and Discussion
Figure 2 shows AFM-IR spectra and molecular structures of EG6-OH and NTP SAMs on gold (in blue) (4). AFM topography measurements were used to verify that the EG6-OH and NTP monolayer film thicknesses were 1.5 nm and less than 1 nm, respectively (4). Each AFM-IR spectrum originates from an approximate sample surface area of 25 nm × 25 nm limited by the contact area of the AFM probe with the sample (4). Corresponding IR reflection absorption spectra, recorded over a substantially larger area, of EG6-OH and NTP SAMs are shown in red, for comparison (4–6). The agreement is generally good, although there appear to be some band shape differences in the NTP spectra. The EG6-OH absorption bands centered at 1345 and 1244 cm-1 correspond to the CH2 wagging and twisting modes, respectively (5). A strong NTP absorption peak around 1339 cm-1 is assigned to the symmetric NO2 stretching mode, while the much weaker absorption band around 1175 cm-1 is assigned to an aromatic CH-bending mode.

Figure 2: AFM-IR spectra (blue) of self-assembled monolayers (SAMs) of (a) EG6-OH and (b) NTP, compared to mid-IR reflection absorption spectra (red) of the corresponding SAMs (adapted from references 5 and 6, respectively). Figure adapted with permission from Nature Photonics (4).
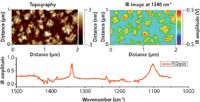
Figure 3 shows the AFM topography image (top left) and an IR absorption image with the QCL tuned to the fixed wavenumber of 1340 cm-1 (top right) of a monolayer island film of PEG on gold. The AFM topography image suggests the PEG islands are about 5-nm thick. The IR absorption band at 1340 cm-1 is assigned to a CH2-wagging mode and the image confirms the location of the PEG island regions. PEG monolayer island regions as small as 25 nm × 25 nm are easily resolved in the IR absorption image. The AFM-IR spectrum of one of the PEG islands is shown at the bottom of Figure 3. The broad IR band centered at 1102 cm-1 is assigned to the C-O-C antisymmetric stretching mode.

Figure 3: AFM topography image (top left), and IR absorption image with the QCL tuned to the fixed wavenumber of 1340 cm-1 (top right) of a monolayer island film of PEG on gold. An AFM-IR spectrum of one of the PEG islands is shown at the bottom.
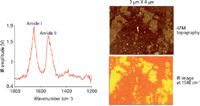
Figure 4 shows the AFM topography image (top right) and IR absorption image collected with the QCL source tuned to the fixed wavenumber of 1540 cm-1 (bottom right) of a PM film of Halobacterium salinarium on gold. The membrane is composed of a double layer of polar and neutral lipids, and the integral membrane protein bacteriorhodopsin. The secondary structure of bacteriorhodopsin consists of seven transmembrane α-helices and an extracellular β-sheet (7). The AFM-IR spectrum shown on the left side of Figure 4 was collected at one location on the purple membrane film; the spectrum is unsmoothed and took about 2 min to collect. The IR image collected at 1540 cm-1, where the amide II vibrational mode absorbs strongly, shows high spatial resolution and uniform distribution of the protein within the membrane film regions of the image.

Figure 4: AFM topography image (top right) and IR absorption image collected with the QCL source tuned to the fixed wavenumber of 1540 cm-1 (bottom right) of a purple membrane film of Halobacterium salinarium on gold. An AFM-IR spectrum collected at one location on the film is shown on the left.
It is interesting to compare the photothermally detected AFM-IR spectrum of purple membrane on gold shown in Figure 4 with a recently published scattering scanning near-field optical microscopy (s-SNOM) IR spectrum of the same type of film cast on a silicon substrate (8). The peak wavenumber of the amide I band in the s-SNOM spectrum occurs at 1661 cm-1 (8), compared to 1652 cm-1 for the AFM-IR spectrum shown in Figure 4. This discrepancy likely results because the peak position of the strong amide I band in the s-SNOM IR spectrum is shifted 10 cm-1 higher, much like it is in grazing angle (GI) FT-IR measurements on the same sample, compared to where it would be in an IR transmission measurement (8). The AFM-IR signals reported here exist only because of the amount of IR radiation actually absorbed by the sample and do not contain any contribution from the real part of the refractive index, like the s-SNOM and GI measurements do. Thus, photothermal AFM-IR peak positions and band shapes more closely resemble IR transmission spectra. The reason the amide II IR band is so much weaker in the s-SNOM experiments than it is in the AFM-IR spectrum shown in Figure 4 is less clear, but it may be that the two techniques have different sensitivities to orientation of the helical chains, or that the actual helical chain orientation is somewhat different in the two experiments. Because the polarization direction of the exciting laser radiation is perpendicular to the sample plane in both experiments, we suspect the helical chains may be more tilted or randomly oriented in the region where the IR spectrum shown in Figure 4 was collected on the gold substrate (9).
Conclusion
Resonance-enhanced AFM-IR nanospectroscopy has been demonstrated on four different monolayer example films adsorbed on flat gold substrates. Spatial resolutions more than two orders of magnitude smaller than conventional FT-IR microspectroscopy have been demonstrated. A sharp AFM tip is used to photothermally detect the radiation actually absorbed at the sample surface as a function of the wavenumber of a tunable IR laser source. When a quantum cascade laser is used, it provides a signal enhancement two orders of magnitude over conventional AFM-IR nanospectroscopy because its repetition rate can be matched to specific mechanical resonance frequencies in the AFM cantilever. An additional two orders of magnitude improvement in sensitivity can be achieved by gold-coating the AFM tip and casting the sample films on gold substrates. It is the combination of resonance enhancement using the QCL source and the "lightning rod" effect produced by gold-coating the AFM tip and substrate that enables the detection of monolayers of material at spatial resolutions on the order of 25 nm × 25 nm. This powerful new capability promises to be useful at providing chemical characterization of monolayer films in the materials and life sciences.
Curtis Marcott is a senior partner with Light Light Solutions in Athens, Georgia. Feng Lu, Mingzhou Jin, Mikhail A. Belkin are with The University of Texas at Austin. Honghua Yang, Craig B. Prater, and Kevin Kjoller are with Anasys Instruments in Santa Barbara, California. Direct correspondence to: marcott@lightlightsolutions.com
References
(1) A. Dazzi, R. Prazeres, F. Glotin, and J.M. Ortega, Opt. Lett. 30, 2388–2390 (2005).
(2) A. Dazzi, C.B. Prater, Q. Hu, D.B. Chase, J.F. Rabolt, and C. Marcott, Appl. Spectrosc. 66, 1365–1384 (2012).
(3) F. Lu and M.A. Belkin, Opt. Express 29, 19942–19947 (2011).
(4) F. Lu, M. Jin, and M.A. Belkin, Nat. Photonics 8, 307–312 (2014).
(5) P. Harder, M. Grunze, R. Dahint, G.M. Whitesides, and P.E. Laibinis, J. Phys. Chem. B 102, 426–436, (1998).
(6) G.T. Merklin, L.-T. He, and P.R. Griffiths, Appl. Spectrosc. 53, 1448–1453 (1999).
(7) R. Henderson and P.N.T. Unwin, Nature 257, 28–32 (1975).
(8) I. Amenabar, S. Poly, W. Nuansing, E.H. Hubrich, A.A. Govyandinov, F. Huth, R. Krutokhvostov, L. Zhang, M. Knez, J. Heberle, A.M. Bittner, and R. Hillenbrand, Nat. Commun. 4, 2890, doi:10.1038/ncomms3890 (2013).
(9) K.J. Rothschild and N.A. Clark, Biophys. J. 25, 473–488 (1979).

AI Shakes Up Spectroscopy as New Tools Reveal the Secret Life of Molecules
April 14th 2025A leading-edge review led by researchers at Oak Ridge National Laboratory and MIT explores how artificial intelligence is revolutionizing the study of molecular vibrations and phonon dynamics. From infrared and Raman spectroscopy to neutron and X-ray scattering, AI is transforming how scientists interpret vibrational spectra and predict material behaviors.
Real-Time Battery Health Tracking Using Fiber-Optic Sensors
April 9th 2025A new study by researchers from Palo Alto Research Center (PARC, a Xerox Company) and LG Chem Power presents a novel method for real-time battery monitoring using embedded fiber-optic sensors. This approach enhances state-of-charge (SOC) and state-of-health (SOH) estimations, potentially improving the efficiency and lifespan of lithium-ion batteries in electric vehicles (xEVs).
New Study Provides Insights into Chiral Smectic Phases
March 31st 2025Researchers from the Institute of Nuclear Physics Polish Academy of Sciences have unveiled new insights into the molecular arrangement of the 7HH6 compound’s smectic phases using X-ray diffraction (XRD) and infrared (IR) spectroscopy.