Infrared Tissue Imaging Applications Growing in Biomedical Research and Diagnosis
IR imaging provides a new tool for disease detection, revealing compositional and structural information in tissue previously not available with contrast staining.

A majority of diseases leading to premature death originate in tissue and cell dysfunction, primarily due to genetic deficiency, either existing at birth or acquired after birth. For over 160 years, disease detection in biopsied tissue has relied upon the painstaking preparation of thin sections followed by contrast staining to visibly signal the presence or absence of diseases with an optical microscope.

Figure 1. Modern IR imaging detector.
Contrast staining involves difficult sample preparation procedures and heavily relies upon the experience, skills, and physical endurance of both the histologist and pathologist to achieve an accurate diagnosis. The process is complicated further by the fact that separate stains often are required for each component to be studied and that the sensitivity and specificity of these stains vary widely. An additional drawback with reagent staining is that if research findings later suggest that an additional chemical or biological component is of interest, additional biopsied tissue will need to be obtained and new stains applied, which is often difficult and time-consuming.
Tissue imaging with infrared (IR) imaging provides a new window into disease processes, revealing compositional and structural information previously not available or at higher sensitivity or specificity than with contrast staining. It also provides the added benefit that instrumentation does not require reagents to promote a visible change in color. The multichannel nature of IR spectra ensures that all IR compositional data is stored in a single data set, permitting the rapid extraction of information on new components of interest without the need for further sample preparation or analysis.
Evolution of IR Imaging Technology
IR spectroscopy is a very mature technique with wide acceptance in the analytical community — both as a qualitative and a quantitative research tool — because it provides direct molecular identification of the materials being studied. From this technology evolved IR microscopy and later IR imaging, which enable measurements to be made on spatially resolved areas within a sample. Researchers in the past made efforts to apply IR to this instrumentation for tissue imaging, but ran into limitations of extremely slow image collection times or poor data quality. IR microscopy instruments were slow because they could only measure one point at a time, so obtaining data over the areas required for biomedical research took days, sometimes slowing research projects to a standstill.
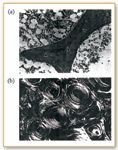
Figure 2. Images of (a) trabecular and (b) cortical bone.
These key problems of analysis time were overcome in early IR Imaging systems by using focal plane array technology originally developed for military applications. Focal plane arrays are grids of a large number of small detectors, typically 4096 in a 64 X 64 element configuration. When located at the focal point of an optical system, the arrays act like the film in a conventional camera, enabling the multichannel collection of a large number of spatially resolved areas in a single measurement. However, early instruments based upon focal plane array technology were prone to mechanical failure, delivered poor quality data, and were quite expensive.
The technology for using focal plane array detectors to sense IR radiation has developed and matured over the past 15 years. More recently, focal plane arrays have been developed specifically for tissue imaging applications that offer larger array sizes and higher sensitivity than earlier military technology. One drawback of the focal plane array technology is the need to multiplex the signal-read out. Smaller linear IR arrays have been introduced that negate this need by incorporating dedicated signal processing electronics, increasing the effective measurement times for each detector within the array. This improves the signal-to-noise performance of the instrument significantly, resulting in higher sensitivity and the ability to measure wavelengths where earlier detector designs were noise limited, that is, down to 700 cm-1. IR imaging spectrometers now are being used by researchers in many areas of biomedical research to provide a greater understanding of the chemical constituents in diseased tissues with the end goal of delivering improved therapies. At the same time, many researchers are attempting to use IR imaging to analyze human tissue, especially in an effort to distinguish diseased and healthy tissues based upon differences in their biomolecular structure or the content of biologically active molecular components and compounds. IR imaging is enabling earlier, more accurate, and less invasive disease detection. The remainder of this article will describe how three researchers are using IR imaging to provide more sensitive and specific diagnoses of several diseases and also to better understand the diseases' development as a starting point in developing new therapies.
Understanding the Mechanisms Involved in Osteoporosis
Richard Mendelsohn and other researchers at Rutgers University in Newark, NJ, and at the Hospital for Special Surgery in New York City, have demonstrated the ability of IR imaging to distinguish between normal and pathological states of bone by providing spatially resolved information about molecular structure and relative concentration of tissue constituents not available with other methods. Osteoporosis is responsible for the large majority of the 1.5 million bone fractures each year in the U.S., which cost $17 billion to treat. Human bones consist primarily of two types of bone: cortical (dense) bone and trabecular (spongy) bone. Trabecular bone, which is encased in cortical bone and is responsible for bone flexibility, deteriorates most rapidly during osteoporosis. With normal bone, trabecular plates interconnect the marrow spaces. In osteoporotic bone, on the other hand, the trabeculae change from a plate-like to a rod-like shape and are dissolved by the osteoclasts. The osteoblasts, which are responsible for bone formation, do not produce enough new bone and bone mass is reduced.
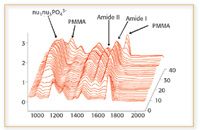
Figure 3. IR fingerprints change at each location in the tissue. Key: PMMA: polymethyl-methacrylate; amide I and amide II bands are explained in the text.
"While traditional approaches such as bone density and X-ray diffraction measurements solely focus upon the mineral phase, IR also provides information on the protein phase as well by enabling spatial measurements of collagen distribution," said Mendelsohn. IR can measure the identity of the mineral phase, amount of mineral, orientation of collagen, mineral crystalline, and the amount of carbonate, proteoglycan, lipids, and collagen crosslinks at a spatial resolution of 8–12 μm. IR imaging provides a deeper understanding of the changes that take place in trabecular bone as the disease progresses by showing that chemical fingerprints change at each location in diseased trabecular bone tissue. The crystalline index can be extracted easily by baseline correction of the spectra followed by measurement of peak height ratios at two indicated wavenumber positions (1).
IR also has demonstrated that osteoporotic bone has much less spatial variation in the mineral content than normal bone, showing that there is substantially more mineral in normal bone than in osteoporotic bone and that the average crystal size and spatial distribution also are altered drastically between the two samples. This finding helped increase understanding of the disease. Normal bone consists of two types of bone. Low mineral content, highly crystalline bone is strong but brittle, while high mineral content, less crystalline bone, is weaker but more flexible. Osteoporotic bone is missing the vital high-mineral, flexible bone type and therefore is more brittle and prone to fractures (2).
The Hospital for Special Surgery and the Rutgers researchers also might have found a new form of brittle bone disease based upon different spatial distributions of collagen crosslinks. They found a population of women whose bone fractured even though their mineral content was normal. The Rutgers researchers found the explanation while looking at the spatial distribution of collagen, the fibrous component of bone. Using IR spectroscopy, they detected alterations in the crosslinks between the collagen molecules near the trabecular surfaces that apparently caused this problem. While the symptoms are similar to osteoporosis, the mechanism is quite different. Mendelsohn concluded that these applications have demonstrated the power of IR for medical research (3, 4).
Gaining Insight into Protein-Folding Diseases
IR also provides the potential to better understand and diagnose protein-folding diseases, such as Parkinson's, Alzheimer's, and Lou Gehrig's diseases. Protein-folding diseases can occur anywhere in the body, but they occur most commonly in the brain, where a naturally occurring protein misfolds into an aberrant structure known as plaque. Accumulations of these misfolded proteins in the brain are thought to disrupt communications between neurons and might also be toxic to neurons. Plaques also have been detected in other organs recently, such as the liver, pancreas, ovary, testis, and thyroid. All proteins have an amide backbone, a carbonyl group with an attached NH group. This means that IR spectra of proteins have an amide I and an amide II peak. The amide I band is very sensitive to the secondary structure of the protein. Beta-sheets and coils, for example, have different amide I frequencies, which fall between about 1600 and 1700 wavenumbers. Protein-folding diseases typically cause a downward shift in the amide I peak from about 1655 wavenumbers to between 1620 and 1630 wavenumbers, representative of a conversion of the protein from α-helical to β-sheet in structure.

Figure 4. Evidence of amyloid formation in neuronal cells infected with spirochetes (8).
Alzheimer's disease is characterized by the accumulation of A-beta protein in the brain. A-beta protein is formed from a longer protein, called the amyloidal precursor protein (APP), when it is cut by enzymes called secretases in two places. Depending upon the length of the cleaved peptide, the fragment will remain folded in its natural state or misfold, aggregate, and form beta amyloid plaque in the brain, which in turn causes the symptoms of Alzheimer's disease. Right now, the only way to confirm an Alzheimer's diagnosis is with a brain biopsy after the patient dies. Thioflavin-S or a similar stain normally is used to detect amyloidal plaques, but this test is not very specific and is unable to distinguish between A-beta and many other similar protein structures.
IR spectroscopy, on the other hand, has the potential for diagnosing Alzheimer's and other protein misfolding diseases in living patients by detecting A-beta and other proteins in areas of the body outside of the brain. The approach, pioneered by Lisa M. Miller and her collaborators at Brookhaven National Laboratory, Brookhaven, NY, involves scanning pancreatic or other tissue in which A-beta protein is known to accumulate and then generating IR images that show the ratio of the misfolded to folded protein (1630 to 1655 wavenumbers) in the different areas of the sample (5–7). The improved sensitivity and specificity of IR relative to traditional histological methods offer the potential to improve research into the disease dramatically.
For example, Miller recently investigated the hypothesis that Alzheimer's disease might develop from a bacterial infection at some point in life, possibly long before the patient develops the disease (8). To test this theory, Miller and coworkers infected individual neuronal cells with spirochete bacteria for about six weeks. She then stained the cells with Thioflavin-S, with the result that some stained positive for A-beta and others did not. The more sensitive IR spectroscopy measurements for A-beta, on the other hand, showed A-beta in both the cells that stained positive and those that stained negative.
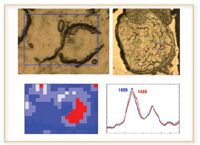
Figure 5. In prion protein diseases, some cells exhibit misfolded prion proteins (right cell), as evidenced by the elevated β-sheet content, whereas others do not (left cell) (10).
IR spectroscopy offers major improvements in the study of prion diseases, such as bovine spongiform encephalopathy (BSE), also known as mad cow disease. This disease also is caused by the misfolding of a naturally occurring protein. However, unlike Alzheimer's, exposure of the normal protein to a small concentration of the misfolded protein causes the normal proteins also to misfold. This disease normally is detected by staining for the prion protein, but the test cannot distinguish between the misfolded form of the protein and the normal form. IR spectroscopy, on the other hand, can distinguish the protein structure easily, which is critical in understanding how the disease develops. For example, Miller's research already has shown that the misfolded prion protein has an elevated beta-sheet structure and is localized near the cell membrane (9, 10).
Replacing Visual Interpretation with Automated, Reproducible Results
Max Diem, of the City University of New York, New York City, is addressing problems with conventional histopathology, the microscopic study of stained thin sections of tissue, which currently is used to diagnose most diseases of cell tissue. Histopathology currently requires a trained pathologist to render diagnosis, so it is subjective and prone to errors that often are influenced by the level of expertise and fatigue of the pathologist. Diagnosis of a sample frequently varies from one pathologist to another and, after looking at hundreds of slides in a single day, the pathologist's error rate tends to increase. Another problem with conventional histopathology is that you need to know what disease you are looking for to ensure the right test is performed to find it.

Figure 6. Stained section (left) and spectral pseudo color map (right) of lymph node.
Diem is developing methods using IR spectral imaging to replace histopathogical studies. An IR spectrum is a reproducible, objective, and quantifiable result of a physical measurement that provides a measure of the biochemical composition of the volume of tissue being interrogated by the IR beam. For a tissue section, Diem's group typically collects upwards of 40,000 individual spectra in a period of about 20 min. Each spectrum then is compared with all other spectra of a data set and clustered according to its similarity. A color code is assigned to all spectra in a cluster and this color is plotted at the pixel coordinate at which the spectrum was collected. The result is a pseudo color map, obtained by completely objective and unsupervised methods, that accurately reproduces the histopathology of the sample. This procedure, called hierarchical cluster analysis, eliminates the need for visual interpretation.
Diem has demonstrated that automated spectral imaging is at least as sensitive as histopathology in identifying keratin deposits in human cervical epithelium tissue, a condition known as parakeratosis (11). Another advantage of IR is that it identifies other conditions, such as inflammation, that that would not show up in stained samples unless specific tests were ordered. Diem's primary research goal is, however, detecting metastatic cancers in lymph nodes. Lymph nodes frequently are excised during surgery and might harbor a small number of metastatic cancer cells. The difficulty of diagnosing these samples visually means that the final diagnosis might not be available for days. Diem already has been able to perform this analysis in one hour and he is working to reduce the time required to 15 min so that it can provide answers in the operating room, which could in some cases eliminate the need for a second round of surgery (12, 13).
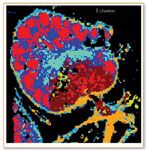
Figure 7. Lymph node with colon cancer metastatis.
Conclusion
By increasing the sensitivity and accuracy of results and reducing the amount of human involvement needed to study the composition of tissue, IR spectroscopy provides the potential to improve research and diagnostic methods dramatically. Linking basic scientific research with clinical effects, tissue imaging provides a tool to test hypotheses of disease pathways by evaluating whether proposed disease indicators correspond to real life tissues. At the same time, tissue imaging provides the potential for automating labor-intensive and error-prone conventional histopathological methods based upon visual inspection.
Sharon Williams is infrared business manager for PerkinElmer Life & Analytical Sciences, and based in the U.K. E-mail: Sharon.Williams@perkinelmer.com
References
1. A. L. Boskey, E. DiCarlo, E. Paschalis, P. West, and R. Mendelsohn, Osteoporosis Int. (in press).
2. H. OuYang, E.P. Paschalis, W.E. Mayo, A. L. Boskey, and R. Mendelsohn, J. Bone Mineral Res. 16, 893–900 (2001).
3. E. P. Paschalis, K. Verdelis, S. Doty, A.L. Boskey, R. Mendelsohn, and M. Yamauchi, J. Bone Mineral Res. 16, 1821–1828 (2001).
4. E.P. Paschalis, E. Shane, C. Lyritis, G. Skarantavos, R. Mendelsohn, and A.L. Boskey, J. Bone Mineral Res. 19, 2000–2004 (2004).
5. P. Dumas and L.M. Miller, J. Biol. Phys. 29(2–3), 201–218 (2003).
6. L.M. Miller, P. Dumas, N. Jamin, J.-L. Teillaud, J. Miklossy, and L. Forro, Rev. Sci. Instr. 73, 1357–60 (2002).
7. L.M. Miller, Q. Wang, T. Telivala, R. Smith, A. Lanzirotti, and J. Miklossy, J. Struct. Biol. (in press).
8. J. Miklossy, A. Kis, A. Radenovic, L.M. Miller, L. Forro, R. Martins, K. Reiss, N. Darbinian, P. Darekar, L. Mihaly, and K. Khalili, Neurobiol. Aging (in press).
9. J. Kneipp, L.M. Miller, M. Joncic, M. Kittel, P. Lasch, M. Beekes, and D. Naumann, BBA Mol. Basis Disease 1639(3), 152–58 (2003).
10. Q. Wang, A. Kretlow, D. Naumann, and L.M. Miller, Vibrational Spectrosc. 38, 61–69. (2005).
11. B.R. Wood, L. Chiriboga, H. Yee, M.A. Quinn, D. McNaughton and M. Diem, Gynecologic Oncology. 93(4), 59–68. (2004).
12. M. Diem, M. Romeo, S. Boydston-White, M. Miljkovic´ and C. Matthäus, Analyst. 129(10), 880–885. (1994–2004).
13. M.J. Romeo and M. Diem, Vibrational Spectrosc.38, 115–119. (2005).

High-Speed Laser MS for Precise, Prep-Free Environmental Particle Tracking
April 21st 2025Scientists at Oak Ridge National Laboratory have demonstrated that a fast, laser-based mass spectrometry method—LA-ICP-TOF-MS—can accurately detect and identify airborne environmental particles, including toxic metal particles like ruthenium, without the need for complex sample preparation. The work offers a breakthrough in rapid, high-resolution analysis of environmental pollutants.