Mass Calibration: Special Needs for Proteomics
Part IV of this four-part series wraps up the discussion of mass calibration, covering the "new generation" attributes that have become apparent as researchers aim to meet the calibration demands of proteomics.

Part III of this four-part series on mass calibration in mass spectrometry (MS) described the use of cluster calibrants to meet needs for calibration in the higher m/z, and higher mass ranges, of modern MS. Adoption of cluster calibrants reflected an extension of mass range from the high limit of about 1000 daltons (Da) for gas chromatography–mass spectrometry (GC–MS), and from about 5000 Da for LC–MS, into the realm of several kilodaltons and above, particularly for matrix-assisted laser desorption ionization (MALDI). A related shift in the approach to mass calibration also was catalyzed by the need to calibrate an instrument and source used to produce multiply charged ions, as produced in electrospray ionization-mass spectrometry (ESI-MS), in which the use of biocalibrants became prevalent.
Implicit in our previous discussions is the fact that demand for higher mass calibrants is complemented in modern practice by the need to assess and ensure the reproducibility of instrument operation. For example, high instrumental reproducibility is central to the mathematical operation in which the masses of a series of multiply charged ions are deconvoluted to produce a true mass spectrum (rather than an m/z spectrum), as in many ESI mass spectra. High reproducibility also is needed especially for high throughput analyses in which the mass accuracy of tens and thousands of mass spectra must be assessed and certified every day. (Don't tell the managers that the instruments can run overnight as well.)
In this final installment on mass calibration, we explore the "new generation" attributes of higher mass calibration that have become apparent as researchers meet the calibration demands of proteomics. Analyses in this regime are characterized by a need for high mass accuracy, a higher and sometimes broader mass range of instrument operation, a large number of different compositions of ions that share a few basic structural types, and a competitively derived pressure for extraordinarily high analytical throughput. Automated analyses and heuristic interpretive approaches have developed at the cutting edge of proteomic MS in just the past three years. But the foundations developed in the first three parts of this series underlie the broad outline and justifications for these calibration initiatives. Of interest is a recent general overview (1) in which data analysis is described as the Achilles heel of proteomics, in which the overwhelming quantity of data is described, but the inclusion of the substantial contributions of improved mass calibration is absent. These advances bear close examination.
MALDI is used almost exclusively with time-of-flight (TOF) mass analyzers, and TOF also has been used in the recent generation of ESI instruments. The relationship between mass and time in such an instrument is deceptively simple, with the more massive ions taking longer to transit from source to detector than lighter ions. Limitations on mass measurement accuracy due to differences in ion formation (time and space windows) and the accelerating voltage (providing the kinetic energy with which the ions move through the instrument) have been researched amply over the years. The lower resolution TOF analyzer has been transformed into a higher resolution integrated platform, and the need for higher mass accuracy in higher throughput proteomics analyses is pushing mass calibration methods into new avenues. We explore several of these in the following vignettes, drawn from recent publications. In proteomics, performance is indicated by the rate of identification of peptides using the method, and mass calibration accuracy is a part of that overall process.
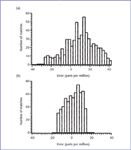
Strittmatter et al. (2) used multivariate regression fitting to increase the mass calibration accuracy for a TOF mass analyzer and ESI mass spectra. Two methods were explored. The first used a double Gaussian function to fit the measured peak distribution. In TOF mass analysis, the arrival of an ion at the detector is captured in a digitized universe. The small distribution in arrival times for ions of a single mass makes up the inherent peak shape for this ion. We often think of this peak shape as inherently symmetrical, but in reality, it is not. As a result, the conventional centroiding approach to calculate the single mass for the peak is limited in its accuracy. Using a double Gaussian function accommodates some of the asymmetry and provides a more accurate single mass for the ion. The concept is part of the usual approach to higher accuracy curve fitting in spectroscopy, and has been used previously in MS. Here, used in conjunction with the ESI TOF mass analysis, the authors claim that use of the double Gaussian method increases the number of identifications by 15–25% over the more conventional calibration procedure. A second calibration approach employed by these authors uses a time-dependent higher order calibration (based upon the presence of internal calibrants of known masses) that adjusts the mass calibration as the performance of the mass analyzer itself changes slightly during an analysis. Such a change might occur, for example, as a result of a slight change in temperature of the instrument itself. The higher order terms thus define a calibration surface (as contrasted with a calibration line) that reflects instrument performance more accurately. This surface calibration can be applied in postrun data processing, subsequent to a more conventional mass calibration that prepares for the acquisition of data. Using this method, approximately 15% more peptides can be identified. The authors present results that compare performance against a standard data set for a combination of the double Gaussian and surface calibration improvements. Figure 1 summarizes those results in the form of an error histogram that plots deviation from a known value with those values measured using a conventional calibration method (Figure 1a), and using the improvements suggested by the authors (Figure 1b).

Figure 1. Comparison of deviation results for known masses using (a) a standard calibration method, and (b) an improved calibration based upon multivariate regression. Figure is adapted from Strittmatter et al. (2).
Wolki et al. (3) explored instrumental mass calibrations that support protein mass fingerprinting (PMF), and compared the performance of varying calibration procedures for TOF mass spectra derived from a standardized data set. PMF analyses, in short, produce a combined mass spectrum that represents a peptide mixture, and is predicated on the appearance of one ion (or a small number of ions) for each different peptide in the mixture. Because mass spectra are additive, the combination of ions provides a fingerprint for the mixture. Matrix effects (covered in a previous column) can alter the relative abundances of the ions observed, and quantitation can be difficult, but matrix effects also can affect the accuracy of the standard internal mass calibration process. The first of the two methods described by Wolki et al. exploits the concept of "local similarity" as described elsewhere (4). PMF often is used for MS analysis of mixtures of peptides separated by two dimensional gel electrophoresis.
Samples are processed and presented to the mass spectrometer in an array that reflects the usually incomplete separation achieved in the electrophoresis. (The same concept can be applied with the use of any other separation method in which the time-based separation is convoluted with a dimensional matrix). Therefore, the masses observed in the PMF spectrum of each array sample are not completely independent of one another, and some overlap of measured masses is expected due to the incomplete separation. Common ions in the fingerprint will be of an invariant mass, and so the measured masses will deviate from the true mass, with some higher and some lower, such that an "averaging" of the masses might be expected to produce a more accurate mass than a fully independent calibration.
In the second approach described by Wolki et al., mass calibration linked to sample position was explored. In high-throughput PMF, multiple samples are arrayed in a dimensional array, such as a multiwell plate. Higher order correction coefficients for mass calibration in TOF mass analysis are dependent upon a sample position coordinate. The "slope coordinate" corrected for slight variations in space and energy values for samples held in slightly different initial positions in the ionization source. The mathematical processing is complex, but it resulted in an apparent increase in mass measurement accuracy. However, when the mass results were routed into the search-and-match algorithm, an increase in the level of identification over that reached with a conventional internal calibration could not be achieved. Although the authors demonstrate conclusively that their calibration procedures increase the accuracy of the raw mass spectral data, the optimum performance increase of 5–10% in the number of peptides identified within a single run is not achieved reliably across all sample data sets, and on all instruments. However, because a performance increase of only a few percentage points is significant in a high-throughput proteomics analysis, the increase in accuracy of the mass values and the decreased reliance on internal mass calibration methods is seen by the authors as advantageous and worthy of further investigation.
We include this second example here because it illustrates that the need for modern mass calibration has grown to include more than the basics of mass and charge physics, but usually higher order correction factors specifically tied to the exact analysis, and in some cases the exact instrument, used. These complex procedures often run within the background of data processing, but must be understood. In addition, these examples show that mass informatics (the pattern of information reflected in the mass spectrum) often provides a handle from which a heuristic calibration aid can be developed.
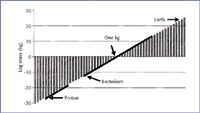
Over the course of this series, we have covered some simple physics of charged ions and their motion in various magnetic and electric fields to calibration based upon informatics. Figure 2 puts our mass range in perspective, in a scale that extends from ions within a mass spectrometer into the laboratory and larger worlds. The vertical axis is in units of log mass (kg), ranging from very small masses at the bottom left to very high masses at the top right. We have discussed previously the relationship between the dalton and the kilogram. Mass spectral measurements occupy a range of approximately eight orders of magnitude, shown at the left lower scale as a solid line spanning the range from the mass of a proton to higher masses. Physics experiments at the sub-atomic scale, of course, extend the mass range down even farther. Pursuing the scale in the other direction, a gap of many orders of magnitude is apparent until we reach a laboratory scale, the lower end of which is being defined currently with experiments in nanotechnology, and the upper range of which is set rather arbitrarily at 1 kg. We use as a lower benchmark the measurement of the mass of a single bacterium, about 1 pg. The laboratory scale therefore extends over 15 orders of magnitude. We also can calibrate and measure mass in a more massive "real world" that extends seamlessly to higher and higher masses, perhaps another 15 orders of magnitude. Measurements on a more massive scale are benchmarked with the mass of the Earth, given as 5.974 × 1024 kg. Astronomers measure masses of planetary and solar objects (mass astronomy) through study of the interaction of the object with surrounding fields, as in a microlensing experiment that documents the effect of mass on the passage of light through a region of space. Interactions with surrounding fields underlie our measurements in MS as well.

Figure 2. Mass scale perspective from MS into the laboratory world and beyond.
Finally, consider the standard deviation achieved in mass spectral measurements. For PMF analyses, as in the papers summarized in this column, researchers achieved a 10-ppm deviance. We cannot measure the mass of the bacterium with that accuracy, and rarely do we approach that accuracy in the laboratory frame of reference, or in the more massive world. The extraordinary achievements of mass calibration in modern MS are points of justifiable pride.
Kenneth L. Busch exhibits a personal mass somewhere between the benchmarks of a single bacterium and Planet Earth, as shown in Figure 2, calibrated usually by time-of-flight through the subway turnstiles in Washington, D.C. He can be reached at wyverners@yahoo.com This column represents the views of the author and not those of the National Science Foundation.
References
1. S.D. Patterson, Nat. Biotech. 21, 221–222 (2003).
2. E.F. Strittmatter, N. Rodriguez, and R.D. Smith, Anal. Chem. 75, 460–468 (2003).
3. W.E. Wolski, M. Lalowski, P. Jungblut, and K. Reinert, BMC Bioinformatics 6, 203–220 (2005).
4. F. Schmidt, M. Schmid, P.R. Jungblut, J. Mattow, A. Facius, and K.P. Pleissner, J. Amer. Soc. Mass Spectrom. 14, 943–956 (2003).

High-Speed Laser MS for Precise, Prep-Free Environmental Particle Tracking
April 21st 2025Scientists at Oak Ridge National Laboratory have demonstrated that a fast, laser-based mass spectrometry method—LA-ICP-TOF-MS—can accurately detect and identify airborne environmental particles, including toxic metal particles like ruthenium, without the need for complex sample preparation. The work offers a breakthrough in rapid, high-resolution analysis of environmental pollutants.
Measuring Soil Potassium with Near-Infrared Spectroscopy
January 8th 2025Researchers have developed a novel three-step hybrid variable selection strategy, SiPLS-RF(VIM)-IMIV, to enhance the accuracy and efficiency of soil potassium measurement using near-infrared spectroscopy, offering significant advancements for precision agriculture and real-time soil monitoring.
The Fundamental Role of Advanced Hyphenated Techniques in Lithium-Ion Battery Research
December 4th 2024Spectroscopy spoke with Uwe Karst, a full professor at the University of Münster in the Institute of Inorganic and Analytical Chemistry, to discuss his research on hyphenated analytical techniques in battery research.
Mass Spectrometry for Forensic Analysis: An Interview with Glen Jackson
November 27th 2024As part of “The Future of Forensic Analysis” content series, Spectroscopy sat down with Glen P. Jackson of West Virginia University to talk about the historical development of mass spectrometry in forensic analysis.
Detecting Cancer Biomarkers in Canines: An Interview with Landulfo Silveira Jr.
November 5th 2024Spectroscopy sat down with Landulfo Silveira Jr. of Universidade Anhembi Morumbi-UAM and Center for Innovation, Technology and Education-CITÉ (São Paulo, Brazil) to talk about his team’s latest research using Raman spectroscopy to detect biomarkers of cancer in canine sera.