An Integration of Modified Uninformative Variable Elimination and Wavelet Packet Transform for Variable Selection
The wavelet packet transform (WPT) combined with the modified uninformative variable elimination (MUVE) method (WPT–MUVE) is proposed to select variables for multivariate calibration of spectral data.
The wavelet packet transform (WPT) combined with the modified uninformative variable elimination (MUVE) method (WPT–MUVE) is proposed to select variables for multivariate calibration of spectral data. In this approach, MUVE is used to select informative variables in the wavelet packet decomposition domain. The proposed method was applied to near-infrared (NIR) reflectance spectroscopy data for analysis of protein and fat in milk powder samples, and the performance was compared to full spectrum partial least squares (PLS), conventional uninformative variable elimination (UVE), and the MUVE method. Using the proposed method, a model with fewer variables and better prediction performance was obtained.
Chemometrics plays an important role in analytical chemistry, especially spectral analysis. Many researchers have studied multivariate calibration methods to build a quantitative model in the NIR spectral analysis. It is not always possible, however, to obtain a good calibration model if the full spectral region is used for analysis, because some regions contain information that is useless or irrelevant for the model. Furthermore, the noise and background in the spectra may worsen the predictive ability of the whole model (1). Thus, a good and robust quantitative calibration model should be built by selecting diagnostic wavelengths or variables that include only sample-specific or component-specific wavelengths instead of the full spectrum. For this aim, some new algorithms have been developed, such as the genetic algorithm (GA) (2,3), simulated annealing (SA) (4,5), moving window–partial least squares (MW-PLS) (6), iterative predictor weighting–partial least squares (IPW-PLS) (7), interval PLS (iPLS) (8,9), stepwise regression analysis (SRA) (10), successive projections algorithm (SPA) (11,12), and uninformative variable elimination (UVE) (13,14).
Modified uninformative variable elimination (MUVE) as a method for variable selection was proposed by our research group (15). The method uses a simulated annealing algorithm instead of adding artificial random noise to estimate an optimal cutoff threshold and optimal latent variables for the PLS model (15). The wavelet packet transform (WPT), an extension of the wavelet transform (WT) has been found to be a very efficient tool for analyzing analytical signals. With the WPT technique, the original spectral information can be represented only by a small number of coefficients in WPT decomposition (16–21). Therefore, if the WPT technique is combined with MUVE, a less complex and efficient model can be obtained.
In our work, a combination of MUVE and WPT (MUVE–WPT) was used to select the spectral feature for multivariate calibration of spectral analysis. In MUVE–WPT, MUVE was used to select informative variables in the WPT decomposition domain. For the application of the two methods, calibration of NIR spectra and the routine ingredients (protein and fat) in milk powder samples were investigated.
Theory and Algorithm
WPT–MUVE
The WPT has been found to be a very efficient tool in processing analytical signals, especially in compression of spectral data (20,21). It offers more flexibility for analytical signal representation and feature extraction. In the case of the discrete wavelet transform (DWT), the signal decomposition is unique, but with WPT, decomposition of the original signal leads to redundancy, so attention must be paid to the best-basis selection criteria. A simple algorithm to find the best decomposition tree for a given signal was proposed by Coifman and Wickerhauser (22). This algorithm can lead to the optimal tree if the cost, C, is minimized. The cost is the Shannon entropy. The entropy cost for best-basis selection criterion is straightforward for the individual signals, but not for the set of signals. Definition of the best-basis for the data set depends on selection of the relevant features. In multivariate calibration, the features of the variance spectrum are defined as shown in equation 1 (20):

where m is the number of objects, n is the number of variables, xij is an element of the data set X(m × n), and xj is the mean of the jth column, calculated as

In this study, the best-basis provides a compact representation of spectral data in time and frequency. Therefore, in the WPT–MUVE, the coefficients in best-basis can be used to replace the original spectra for variable selection. The main steps of WPT–MUVE can be summarized as follows:
1. Calculate the variance spectrum.
2. Decompose the variance spectrum by WPT.
3. Search the WPT tree for the best-basis according to the Shannon entropy criterion.
4. Expand all spectra into the best-basis.
5. Process the coefficients in the best-basis by MUVE.
Experimental and Calculations
Data Set and Calculations
Vis–NIR reflectance spectra of 350 milk powder samples were measured by a handheld FieldSpec Pro FR (325–1075 nm)/A110070 spectroradiometer (Analytical Spectral Devices Inc., Boulder, Colorado). The concentration of protein was determined by the Kjeldahl method as described in GB/T5413.1-1997 (National Standards of P.R. China) and fat content was measured by the R. Gottlieb method following BF/T 5413.3-1997 (National Standards of P.R. China). Before the calibration, samples were divided into two sets by the Kennard-Stone method (23). One set is the calibration set consisting of 250 samples and the other is the prediction set consisting of 100 samples. In the calibration set, the 100 samples are used as a validation set. To compare the performance of the calibration models, the samples in the two sets are kept the same for all calibration models. In the calculation of WPT, a Daubechies 4 (db4) wavelet filter and decomposition level 4 were used.
Software and Evaluation of the Model
All calculations were performed with programs written by us in MATLAB 7.6 (The Math Works, Natick, Massachusetts).
The quality of the model was evaluated by the root mean squared error (RMSE) of cross-validation (RMSECV) and RMSE in the calibration set and prediction set (RMSEP). RMSE is calculated as follows:
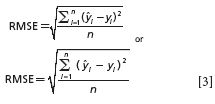
where n is the number of samples, and yi and ŷi are the reference and predicted values of the sample i, respectively.
The optimal number of PLS latent variables was determined on the basis of minimum root mean square error of cross-validation (RMSECV).
Results and Discussion
Data Set and Determination of Best-Basis
To avoid a low signal-to-noise ratio, only the wavelengths ranging from 500 to 1025 nm were used in this investigation. The preprocessor used the standard normal variate (SNV) algorithm (24), which was applied for light scatter correction and to reduce the changes in light-path length. The preprocessed NIR spectra of milk powder are shown in Figure 1. Each spectrum has 526 data points.

Figure 1: Standard normal variate pretreated absorbance spectra of a total of 350 soy milk powder samples of five varieties in the visible and NIR regions (500 â1025 nm).
The WPT is applied with characteristics of efficient compressing for the analytical signal, and the best-basis with minimal entropy cost permits the energy of the signal to be concentrated in a few coefficients (20). In this way, if the best-basis coefficients are used in the MUVE method, a less complex and efficient model should be obtained. Following steps 2, 3, and 4 in the WPT–MUVE algorithm, the optimal wavelet packet tree was obtained and is shown in Figure 2. The best-basis consisted of node index (4,0), (4,1), (3,1), (3,2), (3,3), (3,4), (3,5) and (2,3), and the best-basis coefficient of 569 was obtained.
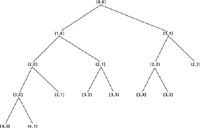
Figure 2: Obtained wavelet packet tree.
Analysis of the Protein Content in Milk Powder
WPT–MUVE Method
When the WPT–MUVE method was used, the best cutoff value was 39, the number of latent variables was 10, and the best function value was 0.3770. The stabilities obtained by MUVE and WPT–MUVE are shown in Figures 3a and 3b, respectively. The stability distributions of the best-basis coefficients shown in Figure 3b are more concentrated than the dispersed stability distribution shown in Figure 3a. In Figure 3a, variables with greater stability values were mainly concentrated on the approximation coefficients 1–50, and the stabilities of these variables are greater than the cutoff value, meaning that most of the variables contribute to the calibration model. However, the stabilities with coefficients >50 are mostly lower than those with coefficients 1–50. This is because the stabilities with coefficients >50 represent the information from noise, which contributes little to the calibration model and should be removed.
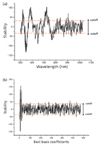
Figure 3: Stability distribution of each wavelength and cutoff threshold obtained by (a) MUVE and (b) WPTâMUVE on analysis of the protein data set using the best-basis coefficients. The two dashed lines indicate the lower and upper cutoff.
Comparison of the Results
The PLS, MUVE-PLS, and WTP–MUVE-PLS models were used to predict the protein content in milk powder. The overall results including the RMSECV, RMSE, and RMSEP are summarized in Table I. As shown in Table I, the RMSEP obtained by the WPT–MUVE-PLS model is lower than the values calculated by other models. This result indicates that the WPT–MUVE-PLS model can predict results more accurately than other models can. Furthermore, in the WPT–MUVE-PLS model, only 28 variables were used, which is fewer than with the other models. The results indicate that the integration of WPT and MUVE can be used to build a more efficient model.

Table I: A comparison of the results obtained by PLS, MUVE-PLS, WTPâMUVE-PLS model on the analysis of the protein data set
Analysis of the Fat Content in Milk Powder
Similarly, in the WPT–MUVE method, the optimal cutoff value was 42, there were 14 latent variables, and the corresponding best function value was 0.4617. The stability values obtained by MUVE and WPT–MUVE are shown in Figure 4. Similar to the case of protein analysis, the stability distribution of the best-basis coefficients of WPT–MUVE is more concentrated than that of MUVE. From Figure 4b, it can be seen that most of the informative variables are concentrated around the approximation coefficient, and stabilities of few coefficients greater than 100 are higher than the cutoff values. Thus, most of these variables in this region should be removed. The stabilities for the detail coefficients after 100 are lower than those of approximation coefficients 1–100.
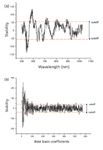
Figure 4: Stability distribution of each wavelength and cutoff threshold obtained by (a) MUVE and (b) WPTâMUVE on analysis of the fat content data set using the best basis coefficients. The two dashed lines indicate the lower and upper cutoff.
Comparison of the Results
The PLS, MUVE-PLS, and WTP–MUVE-PLS models were also used to predict the fat content of milk powder. The overall results including the RMSECV, RMSE, and RMSEP are summarized in Table II. The results shown in Table II are similar to those in Table I. The lowest RMSEP was obtained by the WPT–MUVE-PLS model with fewest selected variables.

Table II: A comparison of the results obtained by PLS, MUVE-PLS, and WTPâMUVE-PLS model on the analysis of the fat data set
Conclusion
A combination of the wavelet packet transform and the modified uninformative variable elimination is proposed for spectral feature selection. In this proposed method, MUVE is used to select informative variables in the wavelet packet decomposition domain. Results from examples using this method for the analysis of protein contents in milk powder samples indicate that this is an efficient method compared with other conventional partial least squares and MUVE methods.
Acknowledgments
This study was supported by the Scientific Research Fund of Zhejiang Provincial Education Department and The Research Fund of Wenzhou Technology Projects (No. Y200907008 and No. G20100078).
References
(1) D. Chen, X.G. Shao, B. Hu, and Q.D. Su, Anal. Chim. Acta. 51, 137–45 (2004).
(2) Y. Ying, and Y. Liu, J. Food Eng. 84, 206–213 (2008).
(3) R. Leardi, M.B. Seasholtz, and R.J. Pell. Anal. Chim. Acta. 461, 189–200 (2002).
(4) X. Chen, and X. Lei, J. Agric. Food Chem. 57, 334–340 (2009).
(5) H. Swierenga, P.J. de Groot, A.P. de Weijer, M.W.J. Derksen, and L.M.C. Buydens, Chemom. Intell. Lab. Syst. 41, 237–248 (1998).
(6) S. Kasemsumran, Y.P. Du, K. Maruo, and Y. Ozaki, Chemom. Intell. Lab. Syst. 82, 97–103 (2006)
(7) D. Chen, W. Cai, and X. Shao, Chemom. Intell. Lab. Syst. 87, 312–318 (2007),
(8) L. Nørgaard, A. Saudland, J. Wagner, J.P. Nielsen, L. Munck, and S.B. Engelsen, Appl. Spectrosc. 54, 413–419 (2000).
(9) R. Leardi and L. Norgaard, J. Chemom. 18, 486–497 (2004).
(10) R.F. Kokaly, and R.N. Clark, Remote Sens. Environ. 67, 267–287(1999).
(11) M.C.U. Araujo, T.C.B. Saldanha, R.K.H. Galvão, T. Yoneyama, H.C. Chame, and V. Visani. Chemom. Intell. Lab. Syst. 57, 65–73 (2001).
(12) D. Wu, Y. He, P. Nie, F. Cao, and Y. Bao, Anal. Chim. Acta 659, 229–237 (2010).
(13) V. Centner and D.L. Massart, Anal. Chem. 68, 3851–3858 (1996).
(14) X. Chen, H. Li, D. Wu, X. Lei, X. Zhu, and A. Zhang. Eur. Food Res. Technol. 230, 981–988 (2010).
(15) X. Chen, D. Wu, and Y. He, Anal. Chim. Acta 638, 16–22 (2009).
(16) C. Cheng, G. Sun, and C. Zhang, Spectroscopy 22(11), 38–42 (2007).
(17) C. Cheng, W. Xiong, Y. Tian, and C. Zhang, Spectroscopy 24(2), 58–67 (2009).
(18) A.K.M. Leung, F.T. Chau, and J.B. Gao, Chemom. Intell. Lab. Syst. 43, 165–184 (1998).
(19) B. Walczak, and D.L. Massart, Trac-Trend Anal. Chem. 16, 451–463 (1997).
(20) B. Walczak, and D.L. Massart, Chemom. Intell. Lab. Syst. 38, 39–50 (1997).
(21) B. Walczak and D.L. Massart, Chemom. Intell. Lab. Syst. 36, 81–94 (1997).
(22) R.R. Coifman and M.V. Wickerhauser, IEEE Trans. Inf. Theory 38, 713–719 (1992).
(23) S. Macho, A. Rius, M.P. Callao, and M.S. Larrechi, Anal. Chim. Acta 445, 213–220 (2001).
(24) R.J. Barnes, M.S. Dhanoa, and J.S. Lister, J. Appl. Spectrosc. 43, 772–777 (1989).
Xiaojing Chen is Lecturer at the College of Physics and Electronic Engineering Information, at Wenzhou University in Wenzhou, China. Di Wu is a Doctoral student and Yong He is a Professor, both in the College of Biosystems Engineering and Food Science at Zhejiang University, in Hangzhou China. Please direct correspondence about this article to Yong He at +86-571-86971143 or yhe@zju.edu.cn.

Smarter Sensors, Cleaner Earth Using AI and IoT for Pollution Monitoring
April 22nd 2025A global research team has detailed how smart sensors, artificial intelligence (AI), machine learning, and Internet of Things (IoT) technologies are transforming the detection and management of environmental pollutants. Their comprehensive review highlights how spectroscopy and sensor networks are now key tools in real-time pollution tracking.
AI Shakes Up Spectroscopy as New Tools Reveal the Secret Life of Molecules
April 14th 2025A leading-edge review led by researchers at Oak Ridge National Laboratory and MIT explores how artificial intelligence is revolutionizing the study of molecular vibrations and phonon dynamics. From infrared and Raman spectroscopy to neutron and X-ray scattering, AI is transforming how scientists interpret vibrational spectra and predict material behaviors.
Real-Time Battery Health Tracking Using Fiber-Optic Sensors
April 9th 2025A new study by researchers from Palo Alto Research Center (PARC, a Xerox Company) and LG Chem Power presents a novel method for real-time battery monitoring using embedded fiber-optic sensors. This approach enhances state-of-charge (SOC) and state-of-health (SOH) estimations, potentially improving the efficiency and lifespan of lithium-ion batteries in electric vehicles (xEVs).