Interaction of Dichloromethane Solvent with n-Alkylamines Analyzed by Electron Ionization GC–MS
Special Issues
The analysis of amines by gas chromatograph ;mass spectrometry (GC–MS) using electron ionization (EI) has always been a challenge
The analysis of amines by gas chromatography–mass spectrometry (GC–MS) using electron ionization (EI) has always been a challenge for three primary reasons: These compounds are very polar and their chromatography is difficult; many of these compounds exist as hydrochloride salts that produce an equilibrium between the free base (R3N) and the ionic form (R3N+H + –Cl) in polar solvents; and to avoid problems with the presence of peaks due to air (m/z 28 [N2] and m/z 32 [O2]), analyses are often started at m/z 35, which means that an important peak representing the diagnostic primary immonium ion (H2C=N+H2) at m/z 30 is not observed. In the course of studying the fragmentation patterns of various compounds with an amine group, a fourth problem was discovered — the reaction of the analyte with common solvents. Methanol, ethanol, acetone, carbon disulfide, dichloromethane (methylene chloride), and chloroform as purchased from various suppliers were found to pose potential problems of undergoing reactions resulting in compounds other than the analyte being studied both in the solutions formed at room temperature and in the injection port of the GC system. This presentation is Part I of a multipart series with the focus on aliphatic primary amines in dichloromethane. This study also emphasizes the importance of finding a confirmation of a proposed structure after a logical solution has been reached.
During the course of normal laboratory work involving electron ionization (EI) gas chromatography–mass spectrometry (GC–MS), it was found that the primary straight-chain aliphatic amine stearylamine appeared to decompose/rearrange into other compounds, or react with dichloromethane used as the diluent. A study was undertaken to see if other aliphatic amines behaved in the same way as stearylamine. The other straight-chain aliphatic amines studied were C8, C10, C12, C14, and C16. These rearrangement/reaction phenomena were investigated to determine the identity of the reaction products and to determine what might be a possible mechanism of the reactions by which they were formed. In most of the cases in this study, data representing the target analyte were observed in the reconstructed total ion current (RTIC) chromatogram along with data representing the reaction product.
The reactions of primary aliphatic amines with the dichloromethane occurred in solution before injection into the GC–MS system. These reactions were not an artifact of the injection method. The discovery and identification of these products also led to the realization that the mass spectra of several important compounds were missing from the NIST Mass Spectral Database. This situation has now been rectified.
Experimental
Table I lists all of the solvents and analytes and their purity, manufacturer, and purchased source. Although often not stated on the container or in the catalog, it was found that the dichloromethane contained a trace amount of cyclohexene as a stabilizer. More recent purchases did have this information printed on the bottle in some cases. All other chemicals were used as received without any further purification.
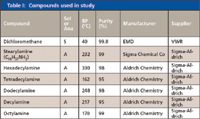
Table I: Compounds used in study
The GC–MS analyses were carried out using a model 7890A gas chromatograph fitted with a split–splitless injector (Agilent Technologies, Santa Clara, California). The GC system was interfaced to a model 5975C Inert XL MSD EI mass spectrometer (Agilent Technologies). An Agilent split–splitless injector insert was used. A 30 m × 250 μm column with a 0.25-μm film thickness of XE-52 (SGE, Austin, Texas) was used for the chromatographic separations. The mobile phase was helium (99.995% purchased from California Welding Supply Co., Stockton, California) and passed through VICI Getter gas purification system (Valco, Inc., Austin, Texas).

Table II: Results of accurate mass assignments using MassWorks
The mass spectrometer was tuned using the Agilent Standard Spectrum Tune file provided with GC, GC–MS ChemStation software (version E.02.00.493), and perfluorotributylamine (PFTBA, also known as FC-43). The following GC–MS settings were used:
Column Oven Temperature Program:
Equilibration time : 0 min
Oven program: On 40 °C for 3 min; 15 °C/min to 270 °C, hold for 2 min
Pressure: 11.182 psi
Flow: 1 mL/min
Average velocity: 25.398 cm/s
Holdup time: 1.9686 min
Flow program : On; 1 mL/min for 0 min
Injection:
Run time: 20.333 min
Syringe size: 10 μL
Injection volume: 1μL
Injection repetitions: 1
Solvent A washes (PreInj): 3
Solvent A washes (PostInj): 3
Solvent A volume: 8 μL
Solvent B washes (PreInj): 3
Solvent B washes (PostInj): 3
Solvent B volume: 8 μL
Sample washes: 0
Sample wash volume: 8 μL
Sample pumps: 3
Dwell time (PreInj): 0 min
Dwell time (PostInj): 0 min
Solvent wash draw speed: 400 μL/min
Solvent wash dispense speed: 2500 μL/min
Sample wash draw speed: 400 μL/min
Sample wash dispense speed: 2500 μL/min
Injection dispense speed: 5000 μL/min
Viscosity delay: 1 s
Sample depth disabled
Injector:
Mode: Splitless
Heater: On; 290 °C
Pressure: On; 11.182 psi
Total flow: On; 18 mL/min
Septum purge flow: On; 2 mL/min
Gas saver: Off
Purge flow to split vent: 15 mL/min at 2 min
The following MS settings were used:
Solvent delay: 6.00 min
EMV mode: Absolute
Resulting EM voltage: 1729
Scan Parameters:
Low m/z: 20.0
High m/z: 300.0
Threshold: 150
Sample number: 3; A/D samples 8; Translates to 2.6 spec/s
MS Temperature Zones:
MS Source: 250 °C; max. 250 °C
MS Quad: 150 °C; max. 200 °C
TUNE PARAMETERS for SN: US73337238
Trace Ion Detection: OFF
EMISSION: 34.610
ENERGY: 69.922
REPELLER: 19.904
IONFOCUS: 74.973
ENTRANCE_LE: 0.000
EMVOLTS: 1776.471
Actual EMV: 1729.41
GAIN FACTOR: 1.21
AMUGAIN: 1595.000
AMUOFFSET: 127.500
FILAMENT: 1.000
DCPOLARITY: 0.000
ENTLENSOFFS: 14.306@3; 14.306@ 50; 11.294@ 69; 13.302@131; 12.549@219; 16.063@414; 16.565@502; 16.565@1049
MASSGAIN: –678.000
MASSOFFSET: –38.000
The atmospheric pressure chemical ionization (APCI) data were acquired with a JMS-T100LC AccuTOF mass spectrometer (JEOL, Peabody, Massachusetts). Orifice 1 was set to 80 °C and 20 V with the desolvation chamber set to 280 °C. The needle voltage was 3000 V; ring lens and orifice 2 were set to 10 V and 5 V, respectively. The solution was introduced to the APCI system by direct infusion at a rate of 20 μL/min. The nitrogen nebulizing gas and drying gas were set to 1.5 mL/min and 1 mL/min, respectively.
Accurate mass calculations were made with the Bioscience MassWorks (Cerno Bioscience, Danbury, Connecticut) software version 2,0,6,0. Within the data file of the stearylamine analysis, a 1-min acquisition of PFTBA was used to calibrate the file using a five-spectra average after the partial pressure of the PFTBA equilibrated. The data file was acquired with the acquisition molded (Acq. Mode) in the MS SIM/Scan Parameters dialog box set to Raw Scan, and the Threshold (counts) in the Threshold and Sampling Rates tab of the Edit Scan Parameters dialog box was set to 0. All other instrument settings were the same as reported earlier. Nine ions from the PFTBA acquisition were used for the calibration of the data file, m/z 69, 100, 114, 119, 131, 169, 218, 264, and 414. Five spectra from the chromatographic peak of the analyte were averaged to produce the spectrum for the elemental composition calculations in the MassWorks software. The calculations were done by clicking on the mass spectral peak and selecting the CLIPS Search function. Depending upon the mass spectral peak of interest, the elemental limits of carbon, hydrogen, and nitrogen were set with a mass tolerance of 20 mmu. The profile mass range was set to -1.00 for start and 1.50 for end.
Stock solutions were prepared at a concentration of ~1 μg/μL. The stock solutions analyzed were then diluted to ~20 ng/μL. Not only were data obtained on individual analytes in solution but also on a mixture of the six n-alkylamines. The spectra of the unknown (identified) compounds submitted to NIST for inclusion in the NIST/EPA/NIH Mass Spectral Database were from data files obtained on individual compounds. The submitted spectra were background subtracted using AMDIS (NIST's Automated Mass spectral Deconvolution and Identification System) to eliminate mass spectral peaks due to the n-alkylamine that was eluted just before each unknown.
All solutions were spotted on thin-layer chromatography (TLC) plates, which were developed using iodine.
Results and Discussion
The relative amounts of the rearrangement/reaction products varied from compound to compound as did the ability to separate the individual compounds using the chromatographic conditions employed in this study (Figure 1).
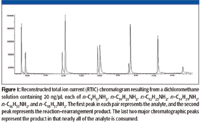
Figure 1
Due to the fact that the mass spectra of all the reaction products indicated that the same type of compounds (differing only by the number of carbon atoms that corresponded to the number of carbon atoms in the amine) were formed, a thorough analysis was carried out only of stearylamine. In order to show that the reaction took place in solution prior to injection, the solutions were subjected to TLC, which clearly showed two components in all cases. The APCI data alone would not have been conclusive because the solutions are subjected to the same high temperatures encountered in the GC injection port.
An examination of the EI mass spectrum of the rearrangement/reaction product associated with stearylamine (Figure 2) prior to obtaining any other data (accurate mass, APCI, etc.) showed that the highest m/z value peak (that was not an isotope peak or due to background) was at m/z 280. This peak probably did not represent a molecular ion M+• because the next lowest m/z value peak was at m/z 266; a difference of 14, which is not a logical loss. The fact that there are peaks with significant intensity every 14 m/z units between m/z 280 and m/z 42 indicates that straight-chain aliphatic ions are formed retaining a single atom of nitrogen and differ by one methylene unit. The intensities of the peaks at m/z 84 (the base peak in the spectrum) and m/z 126 are greater than would be expected for a homologue series. The intensity of the peak m/z 85 is far greater than can be rationalized as being due to the presence of a 13C isotope relative to the peak at m/z 84.
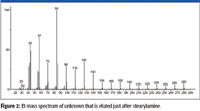
Figure 2
Peaks in the mass spectrum of stearylamine representing ions that have retained the nitrogen atom and were formed by the loss of an aliphatic radical do not have the same m/z values observed in the mass spectrum of the unknown — that is, the mass spectrum of stearylamine (nominal mass 269) has peaks at m/z 254, the loss of a •CH3 radical, a peak at m/z 240, the loss of a •C2H5 radical; m/z 226 loss of a •C3H7 radical; m/z 212 loss of a •C4H9 radical; and so forth. What appears to be corresponding peaks in the mass spectrum of the unknown are 2 m/z units less than those in the spectrum of stearylamine; that is, 252 instead of 254, 238 instead of 240, 224 instead of 226, and so forth. This would mean that if an alkyl radical is lost to form the ion that retains the nitrogen atom, then the analyte is not a primary, secondary, or tertiary amine.
Another very important point indicating that the unknown is not a primary amine is that there is no peak at m/z 30. Because there is no peak at m/z 30, it is also not possible for the unknown to be a secondary amine with the smaller of the two substituents allowing for the hydride-shift rearrangement to produce the primary immonium ion with m/z 30. The lack of the peak at m/z 30 also means that there are not two substituents, in addition to the main aliphatic substituent, that could undergo two sequential hydride-shift rearrangement fragmentations to produce the primary immonium ion.
One possibility would be that the unknown is an isocyanate (R–N=C=O) with a C-18 carbon chain (R=C18). The nominal mass of this compound is 295 Da. The peak at m/z 280 would represent the loss of a •CH3 radical from the M+•, which is consistent with the spectrum of stearylamine (Figure 3). The intensities of the peaks at m/z 84 and m/z 126 are not explained by such a structure, nor does this structure readily explain the presence of peaks at m/z 57 and m/z 85 in the mass spectrum of the unknown. It is possible that the peak at m/z 84 represents a methyl substituted pyrrolidine fragment formed through a rearrangement, and the peak at m/z 85 represents a methyl substituted pyrrolidine molecular ion. Another possibility would be the formation of a C-18 ester of cyanic acid (R–O–C≡N). Again, this structure does not readily provide an explanation of the intensities of the peaks at m/z 84 and m/z 120 or the presence of the peaks at m/z 57 and m/z 85.

Figure 3
Based on a ball-and-stick model, through the shift of a pair of electrons on the nitrogen atom in response to the charge site on the carbon of the +CH2CH2CH2N=C=O ion, the ion shown on the left side in Figure 4 would form and could explain the high intensity of the peak at m/z 84 in the spectrum of the unknown. Unfortunately, a similar ball-and-stick model for the +CH2CH2CH2O–C≡N ion indicated that there would be any similar stabilizing factor for this ion involving the oxygen atom (right side of Figure 4). This means that the structure of the unknown is still ambiguous.

Figure 4
Both of the two proposed structures have the elemental composition of C19H37NO. Even though the spectrum of the unknown had been submitted for a Spectral Identity Search against the NIST/EPA/NIH Mass Spectral Database, NIST08, of 191,436 compounds and had resulted in no hits with a better than 700 Match Factor for the best Match and the spectrum represented by that Hit had a base peak at m/z 56 compared to the base peak of the unknown at m/z 84, it was deemed to be prudent to search the proposed formula against the database. The Formula Search of the NIST08 Database resulted in 24 Hits, none having a mass spectrum with a base peak at m/z 84; however, there was a mass spectrum for octadecyl isocyanate, one of the two candidate structures. This spectrum (Figure 5) was in no way a match for the spectrum of the unknown (Figure 2). This meant there was now only one proposed structure, and this structure was predicated on a nominal mass of 295 Da for the unknown, which was highly speculative at this point.
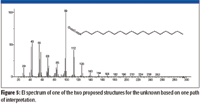
Figure 5
Additional data were needed if an unambiguous structure was to be assigned. The solution was then analyzed using APCI and direct infusion into a mass spectrometer that had sufficient resolving power to produce an accurate mass. A number of peaks representing the protonated stearylamine and protonated acetonitrile adducts were observed, but one peak stood out because it was at an even m/z value greater than that corresponding to the mass of the protonated stearylamine and did not appear to represent an adduct of stearylamine; therefore, possibly representing an ion containing only a single atom of nitrogen. This peak was at a nominal m/z value of 282, which meant that the unknown has a nominal mass 12 Da higher than that of stearylamine (281 Da for the unknown compared to 269 Da for stearylamine). It also meant that the peak at m/z 280 in the mass spectrum represented an [M – H]+ ion.
The accurate mass measurement resulted in an elemental composition of C19H39N for the unknown. A rings-plus-double-bonds calculation for this elemental composition gave a value of one. There are at least two proposed structures that conform to this elemental composition and R + Db results; one is n-C17H35–CH2–N=CH2, (a methylimine) and the other is a substituted pyrrolidine. There are no mass spectra of n-alkyl methylimines in the NIST08 Database; however, the database does contain spectra of several alkyl-substituted pyrrolidines. If the unknown is an n-alkyl-substituted pyrrolidine, based upon the number of carbon atoms present in the unknown and the fact that the unknown is most likely a result of stearylamine, the best candidate would be an n-alkyl methyl pyrrolidine. There are spectra of both 2-methyl-5-n-alkyl pyrrolidines (Figure 6) and 1-methyl-2-n-alkyl pyrrolidines (Figure 7). The mass spectra of 1 methyl-2-n-decyl pyrrolidine and 1-methyl-2-n-dodecyl pyrrolidine in the NIST08 Database had relatively low NIST Numbers (10,695 and 12,300, respectively) indicating that the spectra were from some of the original EPA/NIH data used in the initial formation of the database, meaning that the quality may not be as high as more recently acquired spectra. The NIST Number is a sequential number assigned to every spectrum when it is entered into the NIST Mass Spectral Archive and currently stands at 366,127. The inclusion of these spectra in the database is warranted because there are no other spectra of these compounds, and there are no obvious errors or unexplainable peaks. The compounds are not commercially available, therefore, remeasurement would require synthesis of the compounds. Based upon a lack of synonyms and inclusion of these compounds in other databases, they are not of particular significance and likely to be encountered in analyses of unknowns; therefore, there is no current motivation to remeasure these spectra.
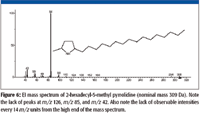
Figure 6
Although there are no spectra in the NIST08 Database of methylimines, the mass spectra n-alkyl nitriles (R–C≡N) show good intensities of peaks representing EE+ ions containing a single atom of nitrogen every 14 m/z units from [M – 15]+ down. This supports the rationale that the peaks in the spectrum of the unknown represent ions that have retained the single atom of nitrogen.
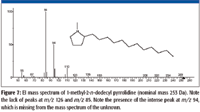
Figure 7
The software was used to determine the accurate mass and elemental composition of the ion represented by the nominal m/z 84, m/z 85, m/z 126 peaks. The m/z 84 ion has an elemental composition of C5H10N and a proposed structure +CH2CH2CH2CH2–N=CH2. The accurate mass determination based on the peak at m/z 85 resulted in an elemental composition of C5H11N, an OE+• ion possibly formed according to the mechanism shown in Figure 8.

Figure 8
The peak at m/z 280 in the mass spectrum of the unknown does represent an EE+ fragment ion formed from the molecular ion; not by the loss of a methyl radical, as had originally been speculated, but by the loss of a hydrogen radical. The molecular ion peak is present in the mass spectrum of the unknown but cannot be distinguished from the carbon-13 isotope peak of the [M – 1]+ peak. Based upon all the data, the impurity is stearyl methylimine. The spectra of the unknown chromatographic peaks associated with the other five n-alkylamines were identical to the spectrum identified as stearyl methylimine with the exception of the m/z value of the [M – H]+ peak.
Conclusion
This study illustrates two important issues. The first is that the solvent used for an analysis can compromise the results due to reactions occurring between it and the analyte. Not only is a solvent selection important for a particular analysis due to chromatographic conditions but also due to potential reactions that might take place. The other issue is that even though a structure has been deduced based upon the nominal EI mass spectral data from a GC–MS analysis, that structure needs to be put to the scrutiny of further examination, especially if any part of the rationalization is based on speculation. The study also shows other ways that the NIST08 Database can be used besides spectral searches. There is a lot of information in this database, and it can be easily extracted and used to come to valid conclusions.
Based upon an examination of the spectra in Figure 9, it is clear that the reaction between dichloromethane and a straight-chain aliphatic amines is the same regardless of the length of the carbon chain.
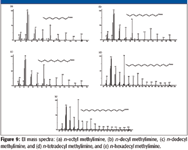
Figure 9
Due to the fact that none of the spectra of the n-alkyl methylimines formed from the six n-alkylamines studied were in the NIST08 Database, all were submitted to NIST for inclusion in the next version. These are important compounds because they are artifacts of an analytical procedure and could be encountered by others doing analyses involving aliphatic amines and dichloromethane.
O. David Sparkman, Matthew Curtis, and Patrick R. Jones are with University of the Pacific, Stockton, California.
References
(1) J.T. Watson and O. Sparkman, Introduction to Mass Spectrometry: Instrumentation, Applications, and Strategies for Data Interpretation (Wiley, Chichester, UK, 2007).
(2) H. Budzikiewicz, C. Djerassi, and D.H. Williams, Mass Spectrometry of Organic Compounds (Holden-Day, San Francisco, California, 1967).
(3) G.O. Nevstad and J. Songstad, Acta Chem. Scandinavica B 1984, 469–477.

High-Speed Laser MS for Precise, Prep-Free Environmental Particle Tracking
April 21st 2025Scientists at Oak Ridge National Laboratory have demonstrated that a fast, laser-based mass spectrometry method—LA-ICP-TOF-MS—can accurately detect and identify airborne environmental particles, including toxic metal particles like ruthenium, without the need for complex sample preparation. The work offers a breakthrough in rapid, high-resolution analysis of environmental pollutants.
The Fundamental Role of Advanced Hyphenated Techniques in Lithium-Ion Battery Research
December 4th 2024Spectroscopy spoke with Uwe Karst, a full professor at the University of Münster in the Institute of Inorganic and Analytical Chemistry, to discuss his research on hyphenated analytical techniques in battery research.
Mass Spectrometry for Forensic Analysis: An Interview with Glen Jackson
November 27th 2024As part of “The Future of Forensic Analysis” content series, Spectroscopy sat down with Glen P. Jackson of West Virginia University to talk about the historical development of mass spectrometry in forensic analysis.
Detecting Cancer Biomarkers in Canines: An Interview with Landulfo Silveira Jr.
November 5th 2024Spectroscopy sat down with Landulfo Silveira Jr. of Universidade Anhembi Morumbi-UAM and Center for Innovation, Technology and Education-CITÉ (São Paulo, Brazil) to talk about his team’s latest research using Raman spectroscopy to detect biomarkers of cancer in canine sera.