Time-Gated Confocal Raman Microscopy
Raman microspectroscopy is a powerful tool for noninvasive chemical analysis of tissues, cells, and cellular structures. To achieve the highest signal-to-noise ratio and fidelity of Raman spectra, the background must be minimized. The difference in temporal dependence of Raman and fluorescence signals can be used for very effective discrimination. A careful system design, based upon the employment of very efficient Kerr-gating materials, makes confocal Raman microscopy possible with significantly shorter acquisition times. The new instrument is tested for a variety of biomedical systems. The possible applications are outlined together with the routes for further improvement.

Raman spectroscopy plays a significant role in microscopic analysis of cells, cellular structures, and biological molecules both in vivo and in vitro (1,2). The great appeal of Raman spectroscopy for biomedical applications originates from its intrinsic ability to analyze the chemical content of the selected volume through the use of natural markers — vibrational spectra of molecules that are being investigated — noninvasively. However, despite the 30-year history of Raman microspectroscopy, it is still considered an emerging technique because of the two major problems associated with its applications. The first one originates from a relatively low cross-section for a nonresonant spontaneous Raman scattering, which for a typical Raman line is estimated to be of the order of 10–29 –10–30 cm2 (that is, more than 10 orders of magnitude weaker than fluorescence emission cross-section for a typical dye used for biological imaging). Although several methods to boost this Raman efficiency several orders of magnitude exist, such as surface-enhanced Raman spectroscopy (SERS) (3), coherent anti-Stokes Raman scattering (CARS) spectroscopy (4), and resonance Raman (RR) scattering spectroscopy (5), they all have weaknesses that limit their field of applications. Currently, spontaneous Raman scattering spectroscopy remains the only commercially available noninvasive tool capable of providing vibrational information from a microscopic volume.
A typical Raman spectrum obtained from a cell or a tissue has a very strong background, which is the result of a relatively weak autofluorescence coming from mostly protein molecules, and which must be removed before the analysis of vibrational bands takes place. Most common methods for background subtractions are based upon digital signal subtraction utilizing the common feature of fluorescent backgrounds being a smooth function of emission wavelength (6–10). Let us assume that the fluorescence signal contributes F photons to the recorded signal, while Raman signal adds additional R photons (for a typical experimental setting R << F). In this case, the shot noise introduced by this signal will be

resulting in the following signal-to-noise ratio (S/N) after the fluorescent background is digitally subtracted from the data:

which is much worse than the ideal S/N in the absence of the fluorescent background:

From the above equations, one can clearly see that the S/N degrades by a factor of √F/R, and, to compensate for it, the data acquisition times of roughly F/R longer are required. In other words, if the fluorescent background is somehow reduced by a factor of 100, the acquisition times to achieve the same S/N Raman spectra also should be cut by approximately a factor of 100 (assuming the shot noise as a predominant source of noise of the data).
There are several ways to cut the fluorescence background. One way is just to use a longer excitation wavelength, such as 785 nm or even 1064 nm, to reduce the amount of autofluorescence significantly (11). This approach results in a drastically reduced background and considerably diminishes the Raman signal (which is scaled as λ–4), while diminishing the spatial resolution (which is scaled as λ–1). A second way is based upon the known effect of photobleaching; that is, if one shines a light on a fluorescent sample, the fluorescence signal tends to decline with time, while Raman signal remains unchanged (12). It is a powerful approach, which certainly leads to the reduced background. However, it also results in the time-dependent signal, which might not be convenient for data analysis. Finally, there is a well-known approach that relies on the temporal characteristics of the emitted Raman and fluorescent signals. While Raman signal has an instantaneous response function (that is, the signal gets emitted within the pulse duration of the excitation pulse), the fluorescence is associated with a certain lifetime, which ranges from hundreds of picoseconds to tens of nanoseconds. Thus, by selectively time-gating the detected signal (13), it is possible to discriminate Raman signal against the fluorescence background if a relatively short excitation pulse is used (14–18). For the optimal gating, the temporal width of the gate should be the same as the incident pulse duration to ensure that all of the Raman signal is detected. It should be significantly shorter than the fluorescence lifetime to provide the most efficient rejection rate, but it cannot be too short, since that would result in the loss of the spectral resolution. Thus, the optimal pulse duration and the corresponding width of the gate should be somewhat of the order of several picoseconds.
Two approaches have been proposed for time-gating: by means of a picosecond streak camera or a time-gated CCD (14,15), and by Kerr-gating of a signal using the residual energy of a short pulse (16–18). Both approaches showed excellent results, but were limited in their applications either due to prohibiting high cost of the gated detectors or to a low repetition rate (1–10 kHz) of the excitation pulses used for Kerr-gating, which makes microscopic Raman imaging unpractical because of the low photon flux. The upper limit for the repetition rate in the case of the Kerr-gate setup is mostly limited by nonlinear optical properties of materials and the available pulse energy. The pump-induced change in refractive index for a given pump beam intensity, I, is given by Δn = n2I.
If the gated pulse of energy E, pulse duration τp, and wavelength λ is focused into a spot size ω0, the above variation of refractive index will cause the polarization rotation of λ/2, if the energy level reaches the following level:

where n2 is the nonlinear refractive index of material, L is the interaction length, which is the minimum of the Rayleigh length of the beam (lR ~ πω02 /λ) and the sample thickness, and tp is the pulse duration. Note that this energy does not depend on the focusing conditions, if the Rayleigh length is much smaller than the sample thickness. Evaluating equation 4 for most commonly used material, CS2 (n2 = 3.1.10–18 m2/W = 1.4.10–12 esu), one gets about 0.8 μJ for the minimum energy requirement. This level of energy is hardly available for megahertz-rate ultrafast laser systems. To reduce the energy requirement for the efficient Kerr-gating, one has to find material with an electronic nonlinearity much stronger than the one of CS2. One possible way to do this is to use a resonantly enhanced nonlinearity by using a wavelength in the vicinity of an electronic transition (or a bandgap, in the case of semiconductor materials). However, this approach also leads to undesirable effects such as two-photon absorption. The other alternative is to use plasmonic resonance, which also leads to a dramatic increase in the effective optical nonlinearity. However, the poor absorption properties of these materials might present a challenge for experimental implementation. In our opinion, the most appropriate method is to evaluate the nonresonant refractive index of different materials (19). This leads to several promising large bandgap semiconductor materials: ZnO (bandgap 3.4 eV, n2 = 5.0 • 10–12 esu at 1064 nm; energy requirement for efficient gating, 300 nJ), TiO2 (bandgap 3.2 eV, n2 = 5.5 • 10–12 esu at 1064 nm; energy requirement for efficient gating, 250 nJ), CdS (bandgap 2.5 eV, n2 = 30 • 10–12esu at 1064 nm; energy requirement for efficient gating, 40 nJ), and CdSe (bandgap 1.77 eV, n2 = 35 • 10–12 esu at 1064 nm; energy requirement for efficient gating, 35 nJ). To avoid two-photon absorption effects, CdSe must be excluded. However, nanocrystalline materials made from the aforementioned semiconductors should be considered as well. There are two fundamental features of nanocrystalline materials that benefit their use as efficient Kerr-gate materials. The first important property is that the bandgap is size-dependent and gets wider for smaller nanocrystals; the second is that the transitional dipole moment, which largely affects the value of refractive index, gets significantly enhanced in nanocrystals. Our previous results with nanocrystalline ZnO materials indicate that χ(3) in these materials can increase by more than an order of magnitude, leading to a very efficient third-harmonic generation with no parasitic effects such as two-photon absorption (20). A quick look at the above data shows that even bulk materials show significant improvement of the Kerr-gate performance with respect to conventionally used CS2 and make it feasible to implement time-gated Raman imaging with very high-repetition rate (that is, low-energy) systems.
Experimental Setup
For all of our experiments, we used a home-built picosecond Nd:YVO4 laser (21). The key feature of this laser is that it operates at a greatly reduced repetition rate (2–10 MHz, depending on the configuration setting) by using intracavity telescope optics, which allows beam traveling back and forth inside the multipass cavity to accommodate a large beam path. As a result, this laser generates in excess of 500 nJ per pulse at a repetition rate of 2–3 MHz. As a result of such a low repetition rate, the temporal spacing between two adjacent pulses is about 0.5 μs, which is much higher than a typical autofluorescence lifetime (1–10 ns), thus preventing the accumulation effects. The pulse duration is determined by the mode-locking conditions and typically is set at about 4 ps, which matches a typical bandwidth of a Raman line (2–3 cm–1). We might expect a slight advantage by using 1–2 ps laser pulses, since shorter pulses allow better discrimination against fluorescence while the linewidth of Raman transitions in solution get somewhat increased to 10 cm–1. A small portion of the fundamental wavelength is sent to generate the second-harmonic radiation, while the rest of the laser power is used as a temporal gate.
The experimental setup is represented schematically in Figure 1. An infinity-corrected microscope objective is employed to focus light pulses at the wavelength of 532 nm onto the sample and collect the back-scattered Raman signal generated from the focal volume. The pair of cross-polarizers, with a thin slab of TiO2 between them, serving as a Kerr-gate material, provide an efficient way to extinguish the fluorescence signal to a level less than 10–5. The appropriately delayed pulse at the wavelength of 1064 nm is combined with the aforesaid beam by means of a dichroic beamsplitter and serves as a time gate to allow only the Raman signal to pass through the second polarizer. The signal is then directed into a spectrometer (Jobin-Yvon, Inc., Edison, New Jersey) and detected using a liquid nitrogen–cooled CCD detector (Jobin-Yvon, Inc.). For most of the experiments, the spectral resolution was about 5 cm–1; the spectral window for Raman spectra detection was varied from experiment to experiment. The efficiency of the Kerr gate was measured with the light radiation at the wavelength of 532 nm being back-reflected from the mirror instead of a sample. We achieved the efficiency of more than 10% when the energy of the gated pulse was about 200 nJ. The cross-correlation function shows no wings and had a full-width-half-maximum (fwhm) of about 5 ps, which defines the temporal window for the time-gating.
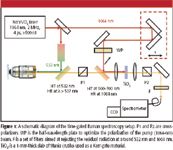
Figure 1
Experimental Results
Time-Gated Raman Microspectroscopy of Dental Tissues
The first applications of Raman spectroscopy to diagnose calcified tissues date back to the 1970s (22,23). Because vibrational spectroscopy is intrinsically sensitive to the chemical composition, there is a hope that Raman spectroscopy can become a valuable tool to diagnose the early variations in tooth chemistry. Such an instrument can become part of a better surveillance system aiming at the detection of early caries activity. However, the autofluorescence background from all the tooth components is rather strong, masking the Raman signal and making the chemical analysis of a localized area of a tooth difficult. To validate the applicability of time-gated Raman spectroscopy for dental tissue characterization, extracted human teeth, both sound and carious, were selected for the set of preliminary studies. Several teeth were stored at 4 °C in de-ionized water. Sagittal buccolingual sections were prepared to obtain slabs approximately 1 mm thick. Ultrasonic treatment in de-ionized water for approximately 1 min was used to clean the surface and to remove the debris. The incident light (P = 1 mW) was focused on the selected tooth area with a moderate power microscope objective (50×, NA = 0.5). The nongated signal collected in a backscattering geometry showed a presence of significant autofluorescence for both sound and infected tissues. The increase of this fluorescence in infected tissues is often used for noninvasive caries detection (24); however, due to the lack of chemical specificity, this method often tends to produce false-positive results. For vibrational spectroscopy, this autofluorescence background creates a problem by masking the Raman features. Figures 2 and 3 exhibit Raman spectra of enamel for a sound tooth and for a tooth suspected for caries by independent fluorescence measurement using a commercially available instrument (DIAGNOdent; Kavo Dental Corporation, Lake Zurich, Illinois). The time-gated Raman spectra of the corresponding areas are shown on the top panels and demonstrate almost identical Raman spectra of the hydroxyapatite structures, indicating that no chemical or structural composition occurs in the suspected area of the tooth. More detailed investigations later revealed that no caries was present in the second tooth. Clearly, the time-gated Raman spectroscopy demonstrated its intrinsic capacity to distinguish tissues chemically and structurally and to draw valuable conclusions based on this information. In this particular example, the same information can be obtained using conventional Raman microscopy; however, to achieve the same information with the same S/N, one has to collect data approximately 300 times longer (we estimated the ratio of fluorescence to Raman signal to be about 300). It took us several seconds to collect the above spectra using time-gated spectroscopy; it would take more than an hour to do the same using conventional Raman spectroscopy with digital background subtraction. In addition, the initial caries development happens in a localized area. Light in the visible and near-infrared part of the spectrum is largely scattered in dental tissues. The use of a time-gating method for signal detection also allows discrimination against deep tissue layers (18).
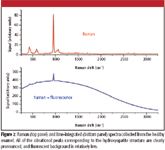
Figure 2
Time-Gated Microspectroscopy of Skin
Skin tissue is another part of the human body that is directly accessible for in vivo optical analysis. Raman spectroscopy has been used extensively to identify the presence of skin cancer (25,26). The fluorescence background is less of a problem and is typically only 10 times stronger than the useful Raman signal. Thus, the advantage of using time-gated Raman microspectroscopy is not as dramatic as for dental tissues. However, it does provide an improvement in S/N and allows retrieving of Raman spectra with a greater accuracy.
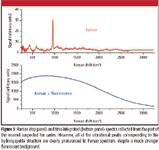
Figure 3
A piece of skin was placed under the same microscope (50×, NA = 0.5) and was illuminated by a low-power laser radiation (P = 0.5 mW) to collect the time-gated and nongated Raman signal. The nongated signal was collected by adjusting the angle of the second polarizer so that the Raman signal of the amide I band (1650 cm–1) of the time-gated signal is approximately equal to that of the nongated signal after the fluorescence background was digitally subtracted using a procedure described elsewhere (8). The resulting spectra are displayed in Figure 4. It is clear that the time-gated spectroscopy provides a better S/N for the same amount of collected signal. A more quantitative measure gives a rough estimate of S/N to be 3, which is in good agreement with equations 2 and 3, if one takes into account that the fluorescence signal is 10 times stronger than the Raman one. The other significant result, which is displayed in Figure 4b, is the difference in the shape of Raman bands in congested areas of the spectrum (600–1000 cm–1) obtained by two different methods. Indeed, any method of digital background subtraction is not good in distinguishing a feature of fluorescence spectrum from a large number of overlapping Raman lines. Thus, the information about the intensity of certain overlapping Raman bands can be diminished significantly, and only the time-gated Raman spectroscopy is capable of retrieving this knowledge without making any assumptions.
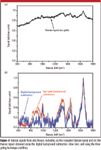
Figure 4
Conclusion and Future Outlook
In this short report, we extended time-gated Raman spectroscopy to microscopic optical imaging. The advances of laser technology make it possible to achieve efficient temporal gating in a relatively simple experimental setup. In the present setup, the use of bulky Nd:YVO4 lasers is not necessary. Several laser companies have commercial products that not only satisfy the energy/pulse duration requirements, but also have a small footprint due to the use of diode-pumped fiber laser technology. The significant reduction of the total cost of apparatus combined with the enhanced S/N and intrinsic confocal capability makes the described optical system attractive for the variety of Raman microscopic imaging applications in which autofluorescence background is an issue. We note that time-gated Raman microscopy can be used effectively in conjunction with the other techniques for fluorescence background removal, providing an even higher degree of discrimination against strong fluorescent background. This feature is especially attractive, since the cross-section of Raman scattering is greatly increased in the presence of electronic transition.
The use of time-gated Raman microspectroscopy becomes especially important for live-cell imaging, where the congested Raman bands can be mistakenly identified as some feature of fluorescence spectrum. The important information that can be retrieved from those bands is completely or partially lost if those spectra are analyzed using conventional methods of digital background suppression.
Despite of all the demonstrated examples of its successful implementation, the present time-gated microscopy system can be improved further. If nanocrystalline ZnO material (20) is used as a Kerr-gate material, the energy requirement drops by a factor of 10, making it possible to increase the repetition rate of the excitation pulses to tens of megahertz and increase the flux of collected Raman signal by an order of magnitude. The use of slightly shorter pulses (~1 ps) will not only improve the rejection efficiency of the fluorescence but also should allow better discrimination against scattering photons; however, these advantages might come on the expense of the degraded spectral resolution of Raman spectra, which is estimated to be in this case about 10 cm–1. The orthogonally polarized Raman signal, which is rejected in the present setup, also can be sent to the same gate material and independently imaged onto the front slit of an imaging spectrometer, further minimizing losses to the signal and proving the possibility of simultaneous polarization measurements as well. The ability to choose the excitation wavelength for Raman microspectroscopy would provide a degree of flexibility to the system and also can be realized by selecting a narrow-band portion of the intense continuum generated in the photonic crystal or specially designed fiber (21).
Acknowledgment
This work was supported in part by NSF grant ECS-9984225 and NIH Grant R21RR14257.
Vladimir V. Yakovlev is with the Department of Physics, University of Wisconsin, Milwaukee, Wisconsin.
References
(1) G.J. Puppels, F.F.M. Demul, C. Otto, J. Greve, M. Robertnicoud, D. Arndtjovin, and T.M. Jovin, Nature 347, 301–303 (1990).
(2) I. Notingher and L.L. Hench, Exp. Rev. Med. Dev. 3, 215–234 (2006).
(3) K. Kneipp, H. Kneipp, and H.G. Bohr, Top. Appl. Phys. 103, 261–277 (2006).
(4) A. Zumbusch, G.R. Holton, and X.S. Xie, Phys. Rev. Lett. 82, 4142–4145 (1999).
(5) I. Notingher, S. Verrier, H. Romanska, A.E. Bishop, J.M. Polak, and L.L. Hench, Spectroscopy Int. J. 16, 43–51 (2002).
(6) G. Schulze, A. Jirasek, M.M.L. Yu, A. Lim, R.F.B. Turner, and M.W. Blades, Appl. Spectrosc. 59, 545–574 (2005).
(7) L.S. Greek, H.G. Schulze, M.W. Blades, A.V. Bree, B.B. Gorzalka, and R.F.B. Turner, Appl. Spectrosc. 49, 425–431 (1995).
(8) C.A. Lieber and A. Mahadevan-Jansen, Appl. Spectrosc. 57, 1363–1367 (2003).
(9) A. O'Grady, A.C. Dennis, D. Denvir, J.J. McGarvery, and S.E.J. Bell, Anal. Chem. 73, 2058–2065 (2001).
(10) T.J. Vicker, R.E. Wambles, and C.K. Mann, Appl. Spectrosc. 55, 389–393 (2001).
(11) J.F. Brennan, Y. Wang, R.R. Dasari, and M.S. Feld, Appl. Spectrosc. 51, 201–208 (1997).
(12) H.J. van Manen, Y.M. Kraan, D. Roos, and C. Otto, Proc. Natl. Acad. Sci. USA 102, 10159–10164 (2005).
(13) R.R. Van Duyne, D.L. Jeanmaire, and D.F. Shriver, Anal. Chem. 46, 213–222 (1974).
(14) T. Tahara and H.O. Hamaguchi, Appl. Spectrosc. 47, 391–398 (1993).
(15) D.V. Martyshkin, R.C. Ahuja, A. Kudriavtsev, and S.V. Mirov, Rev. Sci. Instrum. 75, 630–635 (2004).
(16) P. Matousek, M. Towrie, A. Stanley, and A.W. Parker, Appl. Spectrosc. 53, 1485–1489 (1999).
(17) S. Barsberg, P. Matousek, M. Towrie, H. Jorgensen, and C. Felby, Biophys. J. 90, 2978–2986 (2006).
(18) M.C.H. Prieto, P. Matousek, M. Towrie, A.W. Parker, M. Wright, A.W. Ritchie, and M. Stone, J. Biomed. Opt. 10, 044006 (2005).
(19) R.A. Adair, L. Chase, and S.A. Payne, Phys. Rev. B 39, 3337–3350 (1989).
(20) G.I. Petrov, V. Shcheslavskiy, V.V. Yakovlev, I. Ozerov, E. Chelnokov, and W. Marine, Appl. Phys. Lett. 83, 3993–3995 (2003).
(21) G.I. Petrov, V.V. Yakovlev, and N.I. Minkovski, Opt. Commun. 229, 441–445 (2004).
(22) A.G. Walton, M.J. Deveney, and J.L. Koenig, Calcif. Tissue Res. 6, 162–167 (1970).
(23) F. Casciano, E.S. Etz, D.E. Newbury, and S.B. Doty, Scanning Electron Microsc. 11, 383–391 (1979).
(24) J.D. Bader and D.A. Shugars, J. Am. Dent. Assoc. 135, 1413–1426 (2004).
(25) U. Utzinger, D.L. Heintzelman, A. Mahadevan-Jansen, A. Malpica, M. Follen, and R. Richards-Kortum, Appl. Spectrosc. 55, 955–959 (2001).
(26) S. Kaminaka, T. Ito, H. Yamazaki, E. Kohda, and H. Hamaguchi, J. Raman Spectrosc. 33, 498–502 (2002).
(27) C.K. Mann and T.J. Vickers, Appl. Spectrosc. 41, 427–430 (1987).
AI-Powered SERS Spectroscopy Breakthrough Boosts Safety of Medicinal Food Products
April 16th 2025A new deep learning-enhanced spectroscopic platform—SERSome—developed by researchers in China and Finland, identifies medicinal and edible homologs (MEHs) with 98% accuracy. This innovation could revolutionize safety and quality control in the growing MEH market.
New Raman Spectroscopy Method Enhances Real-Time Monitoring Across Fermentation Processes
April 15th 2025Researchers at Delft University of Technology have developed a novel method using single compound spectra to enhance the transferability and accuracy of Raman spectroscopy models for real-time fermentation monitoring.
Nanometer-Scale Studies Using Tip Enhanced Raman Spectroscopy
February 8th 2013Volker Deckert, the winner of the 2013 Charles Mann Award, is advancing the use of tip enhanced Raman spectroscopy (TERS) to push the lateral resolution of vibrational spectroscopy well below the Abbe limit, to achieve single-molecule sensitivity. Because the tip can be moved with sub-nanometer precision, structural information with unmatched spatial resolution can be achieved without the need of specific labels.
