Imaging Local Chemical Microstructure of Germinated Wheat with Synchrotron Infrared Microspectroscopy
The biological process of germination in wheat is accompanied by localized chemical distribution of lipid and protein, particularly within the germ area of the kernel. As the embryo develops, it draws sustenance from the scutellum and to some degree from the endosperm throughout the kernel. This study was focused on the embryo/scutellum material balance. A focal plane array Fourier transform (FT)-IR microspectrometer was used to obtain 48,000 spectra from scutella in situ to provide quantitative functional group comparison.

The spatial resolution enabled by in situ Fourier-transform infrared (FT-IR) microspectroscopy as predicted from our earlier report in Spectroscopy (1) is applied to localized chemical analysis in this vital biological process of seed germination. Germination includes several different biochemical and structural processes. Ultimately, the entire seed is consumed in sustaining the new life that results after sprouting and growth (2–4). Alpha amylase production is the standard evidence for detection of sprouted (germinated) wheat at harvest. Moist preharvest conditions can cause devastating losses and render the harvested wheat unfit for flour production. Dormancy of dry seeds following harvest retards sprouting under proper storage.
This microspectroscopic study is limited to the relationship of the embryonic axis to the surrounding scutellum within the germ upon germination. The chemical microstructures of these botanical parts were characterized extensively in our previous FT-IR microspectroscopic studies, including individual cell probing across the primary root and surrounding tissue (5–7). In all of the previously reported sample preparations, sprouting was avoided deliberately by soaking kernels to be sectioned overnight in 4 °C water before freezing, sectioning, and thaw mounting on BaF2 windows. For this study, control sections for each variety were prepared in the same manner for comparison with deliberately germinated counterparts. Germination was effected on moist blotter paper in a Petri dish for 36 h at 25 °C before sectioning.
Related prior experimentation with near-IR imaging in the InGaAs region nondestructively revealed subsurface evidence of germination in whole kernels at early stages. In these images, the developing embryo showed contrast from the body of each kernel for a select wavelength and for principal component images (8). Whereas the embryonic axis spectrum has amide I and II bands and very little lipid, the scutellum is rich in 1740-cm-1 carbonyl bands. The scutellum is the storeroom of readily available nourishment for conversion to protein of the developing embryo. With this in mind, kernels identified by whole seed InGaAs imaging as germinated were sectioned to examine the lipid-to-protein population in their scutella with synchrotron IR microspectroscopy. Ungerminated kernels of the same lot were sectioned and examined for comparison. The resulting maps showed dramatic qualitative indications of differences.
Wheat that under moist conditions sprouts in the field has an economically devastating effect; therefore, identification of breeding lines resistant to early sprouting is desirable. IR microspectroscopy enables in situ investigation of the microchemical structure within frozen sections of wheat kernels. Kernel frozen sections were mapped that were sprouted under controlled conditions for a specific time, terminated at –80 °C, and mounted for sectioning.
Experimental
Specimens
In preliminary experiments, kernels were allowed to germinate under controlled conditions on moist blotter paper in Petri dishes for a specified time period (24 and 36 h) before terminating the process at –80 °C. Kernels exposed to moisture for only 3 h that showed no evidence of germination were chosen as a control and were freeze-dried. Also, kernels that were not exposed to moisture were used as controls in subsequent studies.
Sections containing both germ and endosperm were prepared by cryomicrotomy. Sections 4-μm thick were thaw mounted onto IR-reflecting, "low e" glass microscope slides (Kevley). Alternatively, 6-μm-thick sections were thaw mounted onto 1 mm × 13 mm BaF2 disks for mid-IR microspectroscopy in a transmission mode. Sections chosen for study were those in which germ meets endosperm and the scutellum is highly exposed.
Instrumentation at Synchrotron
FT-IR microspectroscopy was done on beamlines U10b and U2b at the National Synchrotron Light Source (NSLS) of Brookhaven National Laboratory (BNL) (Upton, New York). Beamline U10b was equipped with a Continμum IR microscope optically interfaced to a Magna 850 FT-IR spectrometer (Nicolet/Thermo, Madison, Wisconsin). Schwarzschild 32X objective and condenser mirror lenses were used on a double pass single mask beam path to project a 10 μm × 10 μm confocally targeted spot. A 50 μm × 50 μm liquid nitrogen–cooled (MCT) detector essentially matched the beam from the image plane mask of the microscope. A resolution of 8 cm-1 was used with 16 scans co-added unless otherwise stated. Beamline U2b was equipped with a NicPLAN model infrared microscope (Nicolet/Thermo, Madison, Wisconsin).
Instrumentation at KSU
Wheat sections were mapped in transmission and reflection-absorption modes using a Spotlight 300 Spectrum One instrument (PerkinElmer, Danbury, Connecticut). This FT imaging microspectrometer equipped with a 16-element "pushbroom" array was operated with a 6.2 μm × 6.2 μm nominal pixel size, 8-cm-1 resolution, and 64 scans co-added. Images from sections mapped contained 1000–3000 pixels.
An indium gallium arsenide (InGaAs) 320 × 256 focal plane array in series with a liquid crystal tunable filter (LCTF) spectrometer Matrix (Malvern, Columbia, Maryland) in a diffuse reflection mode provided nondestructive near-IR imaging of intact kernels previously reported (8).
OMNIC and Atlμs software (Thermo Fisher Scientific, Madison, Wisconsin) and Spotlight software (PerkinElmer, Shelton, Connecticut) were used to control data acquisition. Malvern's ISys Imaging software was used to allow further data treatment.
Microspectroscopic Procedures
Replicates of the experimental hard wheat cultivars HW and Jagger were mapped in a raster grid in 10-μm steps, resulting in a 10-μm pixel size using the Continμum IR microscope in preliminary experiments with sections from kernels that had been analyzed previously by near-IR nondestructive subsurface polychromatic contrast imaging to reveal the developing embryo. For each pixel in the grid, an IR spectrum in the range of 4000–680 cm-1 was recorded.
The same system with a NicPLAN IR microscope was used on another synchrotron visit to perform line mapping from the scutellum across the embryo into the scutellum. This enabled quantitative comparison of typical germinated versus ungerminated populations on the basis of lipid-to-protein peak area ratios.
Subsequently, large data sets were acquired from carefully chosen sections of three hard wheat varieties and mapped in the Kansas State University Microbeam Molecular Spectroscopy Laboratory (Manhattan, Kansas) with the focal plane array instrument previously described.
Results and Discussion
Based upon the assumption that the scutellum was depleted to provide nourishment for the embryo, this part of the kernel initially was studied spectroscopically. Subsequently, the endosperm, within the same sections being compared, also was examined. Change in the lipid storehouse in the vicinity of the embryonic axis was the focus of this study. Biochemical changes were revealed via the lipid–protein band ratio functional group maps within the scutellum (adjacent to the embryo).
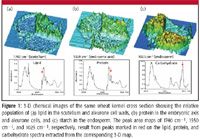
Figure 1
Figure 1 shows three different 3-D functional group maps from the same single wheat kernel to illustrate the chemical distribution by botanical part. A portion of the kernel was sectioned to show the scutellum with the embryonic axis inside as well as the cheeks of the kernel that contain the endosperm. Around the entire periphery of the kernel is a layer containing aleurone cells. The cell walls in the 3-D image produce a mountain range of lipid that outlines the section in Figure 1a. A high lipid population appears in Figure 1a by mapping the carbonyl 1740-cm-1 peak area, which shows lipid in the scutellum and the aleurone cell walls. Note the highlighted absorption band in the spectrum below the image. Figure 1b reveals the protein population based upon mapping the 1550-cm-1 amide II functional group peak areas that show high protein in the scutellum and in the aleurone cells. Note that the protein population is highest in the embryonic axis surrounded by the scutellum. This appears at the two o'clock position on the image. In contrast, Figure 1c highlights the carbohydrate population by plotting the baseline-corrected peak height of the carbohydrate band at 1025 cm-1 . Note that in the section of the wheat kernel, the endosperm contains most of the carbohydrate. The protein-rich embryonic axis was clearly distinguished in Figure 1 from the lipid-rich scutellum, and both of these botanical parts were distinguished readily from the carbohydrate of the endosperm. Chemical images of unsprouted kernel functional groups are shown for the carbonyl, amide II, and carbohydrate bands.
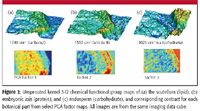
Figure 2
Data for sections of sprouted (36 h) and unsprouted (3 h) wheat mapped by mid-IR microspectroscopy are shown in 3-D functional group maps (Figures 2 and 3) for lipid (1740 cm-1 , carbonyl), protein (1550 cm-1 , amide II), and carbohydrate (1025 cm-1 ). False color contrast for these same areas was obtained from the same raw data applying principal component analysis (PCA) to obtain factor images shown. Figure 2 shows the unsprouted kernel. Sprouted kernel functional group maps for the carbonyl, amide II, and carbohydrate peaks are shown in Figure 3a. Note the high amide II population in the embryonic axis of Figure 3b in comparison to the corresponding map in Figure 2b of the unsprouted kernel. This shows development of the embryo and the buildup of protein as it is developing. The image in Figure 3a to the left of that embryo exhibits a ridge of lipid that is between the embryo and the endosperm (carbohydrate). The 3-D carbohydrate functional group map (Figure 3c) to the right of the amide map shows a depression corresponding to the location of the embryo. False color images in the corresponding PCA factors of Figure 3 show contrast corresponding to these same two botanical parts.
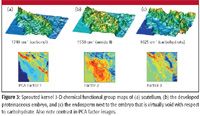
Figure 3
The lipid to protein (1740 cm-1 /1550 cm-1 ) ratios were calculated from spectra of the pixels extracted from the scutellum and embryo section images of ungerminated (3 h) and sprouted (36 h) kernels of the same variety.

Figure 4
Populations of these ratios are shown as graphs (Figure 4) for the unsprouted (control) and sprouted (36 h) kernels, respectively. The ratio mean of 0.98 for pixels from the unsprouted scutellum was compared to a mean of 0.74 for corresponding pixels of the sprouted kernel. These results indicate a shift from the lipid population to a protein population. In the graph (upper) of the unsprouted kernel, 739 of 1160 pixels had absorbance peak area ratios greater than 0.6. The graph (lower) of the scutella from sprouted kernel had only 275 of 823 pixels beyond the peak area ratios of 0.6. These data represent our first attempt at semiquantitation of the change in the chemical balance between these two functional groups.
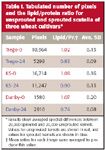
Table I. Tabulated number of pixels and the lipid/protein ratio for unsprouted and sprouted scutella of three wheat cultivars*
The kernel sections shown in Figures 2 and 3 were produced from whole kernels that had been tested for germination in a separate study designed to nondestructively detect germination by subsurface polychromatic contrast (8). Figures 5a and 5b show columns of near-infrared images, of sprouted and unsprouted whole kernels, respectively. In each column, the top image is of log 1/R values at a single wavelength for each pixel. Note that the germ area on the right end of the kernel has prominent contrast in Figure 5a. In Figure 5b, there is no evidence of a developed embryo. Whole kernel principal component factor images of the sprouted kernel clearly show evidence of a developed embryo. In contrast, there is no such prominent feature in the whole kernel near-IR images of Figure 5b. In Figures 5a and 5b to the right of the whole kernel near-IR image columns, another column of mid-IR microspectroscopic function group maps at 1740 cm-1 , 1550 cm-1 , and 1025 cm-1 are shown. These images were obtained from sections produced from the previously nondestructively analyzed wheat kernels. The curvature shown in the microspectroscopic images reveals the line of demarcation between the embryo (lower right) and the body of the kernel (upper left). This same curvature is observed with select principal component factor maps to the right of the actual mid-IR microspectroscopic images. In contrast, the mid-IR microspectroscopic functional group maps and PCA factor maps of the unsprouted kernel do not show the same degree of order or differentiation between the embryo and the adjacent tissue.
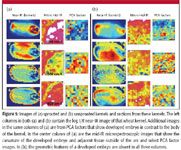
Figure 5
After the preliminary data shown in the preceding figures were obtained, on a subsequent visit to the National Synchrotron Light source at Brookhaven National Laboratory, the first attempt at quantitation of the lipid to protein peak area ratios was done with a series of line maps across the central area within the germ. A number of line maps were produced from pairs of unsprouted and sprouted kernels representing several hard wheat varieties. Figure 6 shows photomicrographs of two sections with the map lines superimposed. The 2927-cm-1 CH2 stretching vibration was used to represent the lipid, and the 1650-cm-1 (amide I band) was used to represent the protein. The ratio average from points 1–15 along the line map for the unsprouted section was 1.1. In contrast, for the sprouted kernel of the same variety, the first and last five points taken on either side of the embryo had an average ratio of 0.6. Based upon the early evidence (Figures 2 and 3) and subsequent line mapping (Figure 6) indicative of the relative population of scutellum lipid in the sprouted kernel to that of the unsprouted kernel, a series of quantitative experiments was undertaken. These provide quantitation from 48,000 spectra obtained from 26 maps taken from 14 sections representing three different cultivars, each of which was represented by both germinated and ungerminated kernels.

Figure 6
Figure 7 shows the photomicrograph of a wheat kernel cross-section with three rectangles (red) showing the actual areas of the scutellum of this kernel from which spectra were collected. An artist's sketch of a wheat kernel section is included to show the embryo and scutellum within the germ in relation to the other botanical parts.
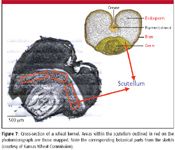
Figure 7
Figure 8 shows sprouted and unsprouted cross-sections of the varieties Trego with the corresponding spectra and 3-D maps (Figure 8a) and KS2174 images, spectra, and maps (Figure 8b). Note the difference in the mean ratios between the unsprouted and the sprouted samples. Figure 8c has photomicrograph images, spectra maps, and quantitative values for the variety Danby. Spectra from these mapped areas were processed to determine the peak area ratios that appear in Table I. These data were obtained from sections of kernels sprouted under careful control in the laboratory in Petri dishes on moist blotter paper at room temperature for 24 h.

Figure 8
Figure 9 shows the typical spectra of unsprouted (red) and sprouted (blue) scutellum tissue that summarizes the chemical differences resulting from the biological process. Table I has results of unsprouted and sprouted lipid–protein peak area ratios for stated pixel numbers of the varieties Trego, KS2174, and Danby. Note that in all cases, the lipid–protein peak area ratio was greater than 1.0 in the unsprouted and significantly lower than 1 in the sprouted. A total of 28,000 spectra from the scutella of sprouted wheat were compared with 20,000 spectra from unsprouted kernels. For each map, the scutellum lipid populations were compared to that of a control kernel. From comparing numerical lipid–protein ratios, the grand mean showed a 22% reduction of the lipid-to-protein ratio in the scutellum as a result of the germination process.
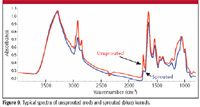
Figure 9
Summary
Deliberately germinated (sprouted) kernels selected from nondestructive NIR imaging experiments were sectioned for synchrotron mid-IR microspectroscopy. Mid-IR functional group maps of sections highlighted kernel morphological structures in the germ area based upon the predominance of the embryo's protein chemical composition. PCA factor images also highlighted the select botanical parts, including the scutellum, embryonic axis, and endosperm. Sprouted kernels were distinguished from unsprouted ones of the same variety.
Wheat kernels identified by nondestructive near-IR imaging as germinated were used to prepare frozen sections for analysis by synchrotron mid-IR microspectroscopy. A reduced lipid population was observed in the scutellum next to the developing embryo in the 1740-cm-1 (carbonyl) functional group 3-D image in comparison to that of the ungerminated (control) kernel of the same lot. This observation was repeated with pairs of sections of different cultivars.
Semiquantitative comparison was made on a subsequent synchrotron visit. This comparison was between pairs of sections of germinated and ungerminated kernels from the same lot representing multiple wheat cultivars. The lipid/amide II ratio was calculated for spectra of individual pixels from line maps across the scutellum–embryo–scutellum. These data supported previous observations from 3-D chemical images.
Finally, based upon the preliminary synchrotron work, carefully prepared sections representing three germinated cultivars and their ungerminated controls were imaged at the Kansas State University Microbeam Molecular Spectroscopy Laboratory with a focal plane array Spectrum Spotlight 300 (PerkinElmer, Shelton, Connecticut) with a 6.2 μm × 6.2 μm pixel size. A total of 48,000 spectra (28,000 sprouted and 20,000 unsprouted) were compared. An average 22% reduction in lipid/protein was observed. These data were obtained from 26 maps of 14 sections involving six kernels. For each map, the scutellum lipid population of the sprouted kernel was compared with that of a corresponding unsprouted (control) kernel. The numerical lipid–protein ratios were consistent. The grand mean showed a 22% reduction of scutellum lipid as a result of the early germination process.
Acknowledgments
This experimentation was supported with beamtime from the Department of Energy and funds from the Microbeam Molecular Spectroscopy Laboratory and the Kansas Agriculture Experiment Station. The authors are indebted to Randy Smith and Ned Marinkovic of NSLS, who facilitated successful use of NSLS infrared beamlines U10B and U2B, respectively, and to Mendy Phillips of KSU, who prepared sections at NSLS. The NSLS is operated by the U.S. Department of Energy under contract BEAC02-98CH10886 as a user facility.
References
(1) D.L. Wetzel and S.M. LeVine, Spectroscopy 8(4), 40–45 (1993).
(2) J.G. Swift and T.P. O'Brien, Aust. J. Biol. Sci. 25, 469–486 (1972).
(3) J.G. Swift and T.P. O'Brien, Aust. J. Biol. Sci. 25, 9–22 (1972).
(4) K.D. Hargin, W.R. Morrison, and R.G. Fulcher, Cereal Chem. 57(5), 320–325 (1980).
(5) D.L. Wetzel, "A Microbeam Molecular Spectroscopy of Biological Materials," in Food Flavors: Generation, Analysis, and Process Influence, G. Charlambous, Ed. (Elsevier, Amsterdam, 1995), pp. 2039–2108.
(6) D.L. Wetzel and J.A. Reffner, Cereal Foods World 38(1), 9–20 (1993).
(7) D.L. Wetzel, A.J. Eilert, L. Pietrzak, S.S. Miller, and J.A. Sweat, Cell. Mol. Biol. 44(1), 145–167 (1998).
(8) V.W. Smail, A.K. Fritz, and D.L. Wetzel, Vibr. Spectrosc. 42, 215–222 (2006).
Contribution no. 07-315-J Kansas Agricultural Experimental Station, Manhattan
Hicran Koc and David L. Wetzel are with the Microbeam Molecular Spectroscopy Laboratory, Kansas State University, Manhattan, Kansas. Address all correspondence to dwetzel@ksu.edu
AI Shakes Up Spectroscopy as New Tools Reveal the Secret Life of Molecules
April 14th 2025A leading-edge review led by researchers at Oak Ridge National Laboratory and MIT explores how artificial intelligence is revolutionizing the study of molecular vibrations and phonon dynamics. From infrared and Raman spectroscopy to neutron and X-ray scattering, AI is transforming how scientists interpret vibrational spectra and predict material behaviors.
Real-Time Battery Health Tracking Using Fiber-Optic Sensors
April 9th 2025A new study by researchers from Palo Alto Research Center (PARC, a Xerox Company) and LG Chem Power presents a novel method for real-time battery monitoring using embedded fiber-optic sensors. This approach enhances state-of-charge (SOC) and state-of-health (SOH) estimations, potentially improving the efficiency and lifespan of lithium-ion batteries in electric vehicles (xEVs).
New Study Provides Insights into Chiral Smectic Phases
March 31st 2025Researchers from the Institute of Nuclear Physics Polish Academy of Sciences have unveiled new insights into the molecular arrangement of the 7HH6 compound’s smectic phases using X-ray diffraction (XRD) and infrared (IR) spectroscopy.
