Analysis of Fructose, Glycine, and Triglycine Using HPLC UV-vis Detection and Evaporative Light-Scattering Detection
The development of a method for the simultaneous determination of glycine, triglycine and fructose using UV–vis and evaporative light-scattering detection (ELSD) is described. This was necessary as part of a research project dealing with the recovery of functional peptides from aqueous streams on an industrial scale using adsorption or related technologies. Fructose is barely detectable by UV–vis as it lacks detectable functionalities, while glycine and triglycine are both UV–vis sensitive. An NH2 phase was chosen as a column and separation was obtained within seven minutes on a 250 X 4.6 mm column. Limits of detection are approximately 40 mg fructose/L, 4 mg glycine/L and 0.05 mg triglycine/L. Calibration functions are linear in a range of 40–1400 mg/L for fructose, 5–200 mg/L for glycine and 0.5–70 mg/L for triglycine.

Short peptides (oligopeptides) are highly valuable products in the food industry because of their digestibility, low allergenic properties, flavor, textural properties and nutraceutical abilities. Oligopeptides are found in low concentrations in aqueous streams of organic origin, such as in sugar and starch production and in process streams. Therefore, there is a significant interest in processes, which can selectively concentrate peptides or peptide fractions. Besides oligopeptides, other organic components (e.g., sugars, amino acids, carboxylic acids and organic salts) are present in higher concentrations in many process streams. Triglycine can be seen as a model to study processes for the recovery of peptides. (Figure 1)
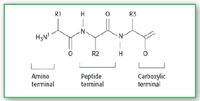
Figure 1. Basic structure of a tripeptide. (R1, R2, and R3 are H for triglycine).
To investigate the selectivity of peptide separation processes, multicomponent aqueous feeds are used, with a sugar (fructose) and an amino acid (glycine) present. To obtain the required data, an analysis method capable of determining the concentrations of triglycine, glycine and fructose simultaneously is preferred.
There are various ways to analyze amino acids and oligopeptides using HPLC by first derivitizing with, for example, o-phthalate aldehyde (phthaldialdehyde) (OPA), N-(9-fluoroenyl)methoxy-carbonyl (FMOC)or 4:3-b-Naphthopyrone-4-acetic acid N-hydroxysuccinimidyl ester (NPA-OSu) (1) and only a few where a derivatization step is not required (2). Most of them use UV–vis or fluorescence spectroscopy for detection. There are also many methods using HPLC with refractive index detection (RID) (4–7) to analyze fructose (3). The determination of fatty acids in the presence of carbohydrates by reversed-phase (RP) HPLC after derivatization with phenacyl bromide8 and as a gas chromatography (GC) method comprising a derivatization of the carbohydrates with alkylchlorosilanes have also been recorded.8 No method for the simultaneous determination of fructose, glycine and triglycine has been observed.

Table I. Chromatographic parameters.
For most of the HPLC analyses of carbohydrates, columns packed with either cation-exchange resins or amino-modified silica gel are used. Detection is mostly performed using RID. The cation-exchange columns require pure water or diluted mineral acid as the mobile phase. The amino modified columns are run with eluents of water and acetonitrile (4).
ELSDs measure the amount of light scattered by analyte particles that have been obtained through nebulization and evaporation. In general, ELSDs deliver a signal for all compounds that do not evaporate or decompose during evaporation of the mobile phase. A lot of applications using HPLC with ELS detection have been published in the past few years (9–15).
ELSDs are more universal than refractive index detectors. Furthermore, they are compatible with a much wider range of solvents and modifiers, and produce stable baselines during gradient elution. Compared with spectroscopic detectors, ELSDs produce more uniform detection sensitivity for most analytes, regardless of their physical and chemical properties (16).
Experimental
Chemicals: Reagent-analytical grade sodium dihydrogenphosphate and phosphorous acid (85%) were obtained from Merck (Darmstadt, Germany). Acetonitrile for HPLC was obtained from Sigma-Aldrich (Seelze, Germany). Reagent-analytical grade d–fructose, glycine (amino acetic acid) and triglycine (Gly–Gly–Gly) were obtained from Sigma-Aldrich (Steinheim, Germany). Ultra-pure water was obtained from Milli-Q185 from Millipore (Molsheim, France).
HPLC with UV–vis detection: The chromatographic separation was performed using a Varian Pro Star HPLC system (Varian Nederland, Middelburg, The Netherlands), consisting of a quaternary pump (Model 240) and a variable UV–vis detector (Model 310). The UV absorbance was monitored at 190 nm.
The column was a Luna NH2 column (Phenomenex, Bester, Amstelveen, The Netherlands). The eluent used 20 mM NaH2PO4 (adjusted to pH 6.05 with phosphorous acid), with a flow of 0.7 mL/min. The composition of the buffer was chosen according to the pKa of glycine (2.35–9.78) and triglycine (3.26–7.93).
HPLC with UV–vis detection and ELSD: The chromatographic separation was performed using a Varian Pro Star HPLC system (Varian Nederland, Middelburg, The Netherlands), consisting of a quaternary pump (Model 240), a variable UV–vis detector (Model 310) and an evaporative light-scattering detector at low temperature (Shimadzu's Hertogenbosch, The Netherlands). The UV absorbance was monitored at 190 nm and the gain of the ELSD was set on 5 (medium sensitivity).
The column was a Luna NH2 column (Phenomenex, Bester, Amstelveen, The Netherlands). The eluent used acetonitrile/water 40/60 with a flow of 1.2 mL/min.
Results and Discussion
Separation and detection: The chromatogram shown in Figure 2 is a typical example of the HPLC separation of the three analytes with subsequent UV–vis detection at 190 nm. Amino-modified silica-gel columns are useful for weak anion-exchange applications when appropriate buffers are used. Serious attention must be directed to the maintenance of aminopropyl-bonded phase columns. The silica gel-based packing will dissolve in water rich mobile phases, thus leaving voids in the inlet end (4).
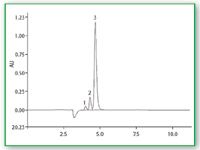
Figure 2. Typical example of the HPLC separation of 3 analytes with subsequent UVâvis detection at 190 nm.
If the column ages the retention time of the injection peak will increase. For low concentrations of fructose, the injection peak interferes and the amount of fructose is not determinable in small concentrations. Figure 3 shows a chromatogram of fructose with UV detection at 190 nm in low concentration (about 80 mg/L). Table 1 surveys the chromatographic parameters for Figure 2.
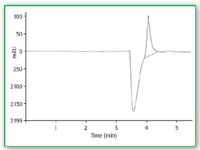
Figure 3. Chromatogram of fructose with UV detection at 190 nm in low concentration (about 80 mg/L).
Figure 4 shows two chromatograms of one injection of a standard detected at 190 nm by means of UV–vis spectroscopy (a) and ELSD (b). The detectors are connected in series.
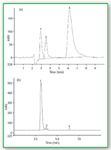
Figure 4. Two chromatograms of one injection of a standard detected at 190 nm by means of (a) UVâvis spectroscopy and (b) ELSD.
In Figure 4(a), a UV–vis detector chromatogram is presented showing the separation of the three compounds of interest. All the peaks are separated well, the first peak (fructose) interferes with the injection peak.
In Figure 4(b) an ELSD chromatogram is presented showing the separation of the three compounds of interest. An injection peak is not seen and a good determination of fructose is possible. The other two compounds cannot be quantified. The parameters are the same as in Figure 3. The concentrations are 805 mg fructose/L; 67 mg glycine/L and 26 mg triglycine/L.
This HPLC method with UV–vis detection provides a good, fast separation of glycine and triglycine. However, the fructose peak suffers from a slight overlap with the negative injection peak (Figure 2).
Calibration curves
Calibration curves UV–vis detection at 190 nm: If we examine the calibration curve of fructose with UV–vis at 190 nm we see a good linearity, R2 = 0.9991 over the range 40–1400 mg/L. (Figure 5).

Figure 5. Calibration curve for fructose UV 190 nm.
Simultaneously glycine and triglycine are detected with UV at 190 nm.

Figure 6. Calibration curve for glycine UV 190 nm.
The calibration curves of these two compounds are linear as well, R2 = 0.9968 for glycine and R2 = 0.9974 for triglycine. The range is 5–200 mg/L for glycine and 0.5–70 mg/L for triglycine. (Figures 6–7).

Figure 7. Calibration curve for triglycine UV 190 nm.
Calibration curves ELSD: If we examine the calibration curve of fructose with the ELSD, we see a good linearity, R2 = 0.9991 over the range 0.032–1.610 mg /mL. (Figure 8).

Figure 8. Calibration curve for fructose ELSD.
Conclusions
This article shows that peptides, such as glycine and triglycine, can be analyzed in a matrix of aqueous fructose solution. If the amount of fructose is neglected, then HPLC with UV–vis detection at 190 nm with the buffer eluent described above provides the best results. In order to determine also the amount of fructose HPLC–ELSD in combination with the UV–vis detector at 190 nm with the eluent water–acetonitrile is used.
Acknowledgements
The authors wish to thank Mr R. Goedknegt (Bester) for his advice in choosing the column and Mr M. Vogel (Chemical Analysis Group, University of Twente) for his suggestions in the preparation of this article.
Henny Bevers is an analytical specialist in the Separation Technology group at the University of Twente. He supervises the MSc students and the PhD students in the analytical part of their projects.
Renze Wijntje is a PhD student in the Separation Technology group at the University of Twente. He performs research on the adsorption of small peptides from multicomponent aqueous feeds.
André de Haan is Full Professor in Separation Technology at the University of Twente. His research programme is directed to the development of industrial affinity separation technologies and processes.
References
1. X. Liu et al., Chromatographia 53, 326 (2001).
2. K. Petritis, C. Elfakir and M. Dreux, LCGC Eur. 14, 389 (2001).
3. F. Chinnici, U. Spinabelli and A. Amati, J. Liq. Chromatogr. Rel. Technol. 25, 255 (2002).
4. K.B. Hicks, Adv. Carbohydr. Chem. Biochem. 46, 17 (1988).
5. M. de Cortes Sánchez-Mata, M. Cámara-Hurtado and C. Diez-Marqués, Eur. Food Res. Technol. 214, 254 (2002).
6. G. Foldhazi, Acta Alimentari 23, 299 (1994).
7. M. Cortes Sánchez-Mata et al., J. Agric. Food Chem. 46, 3648 (1998).
8. K. D. Golden and O. J. Williams, J. Chromatogr. Sci. 39, 243 (2001).
9. M. Lafosse, M. Dreux and L. Morin-Allory, J. Chromatogr. 404, 95 (1987).
10. B. Herbreteau et al., Anal. Chim. Acta 267, 147 (1992).
11. B. Herbreteau, Analusis 20, 355 (1992).
12. B. Herbreteau et al., Chromatographia 33, 325 (1992).
13. L. Morin-Allory and B. Herbreteau, J. Chromatogr. 590, 203 (1992).
14. A. Clement, D. Yong, and C. Brechet, J. Liq. Chromatogr. 15, 805 (1992).
15. M. Míguez Bernárdez, J. de la Montaña Miguélez, and J. García Queijeiro, J. Food Comp. Anal. 17, 63 (2004).
16. C.S. Young and J.W. Dolan, LCGC Eur. 16, 132 (2003).

Real-Time Battery Health Tracking Using Fiber-Optic Sensors
April 9th 2025A new study by researchers from Palo Alto Research Center (PARC, a Xerox Company) and LG Chem Power presents a novel method for real-time battery monitoring using embedded fiber-optic sensors. This approach enhances state-of-charge (SOC) and state-of-health (SOH) estimations, potentially improving the efficiency and lifespan of lithium-ion batteries in electric vehicles (xEVs).
Smart Optical Sensors for Thermal Management in Electric Vehicles
April 8th 2025A recent review in Energies explores the latest advancements in sensor applications for electric vehicle (EV) thermal management systems. The study, authored by Anyu Cheng, Yi Xin, Hang Wu, Lixin Yang, and Banghuai Deng from Chongqing University of Posts and Telecommunications, along with industry partners, examines how advanced optical sensors improve the efficiency, safety, and longevity of EVs.
Fiber Optics and Neural Networks Transform Vehicle Sensing and Road Safety
April 7th 2025A cutting-edge fiber optic sensing system, developed by researchers at Tongji University, leverages neural networks to classify vehicles with unprecedented accuracy. The system’s innovative design uses spectroscopic and optical sensor technologies to provide critical data for road maintenance and traffic management.