Identifying Organic Impurities in Counterfeit and Illicit Tobacco Using Portable ATR-FT-IR Spectroscopy
Counterfeit and illicit tobacco may contain potentially toxic organic impurities that result in adverse health effects to the consumer. The aim of this work was to investigate the feasibility of the identification of organic impurities in counterfeit or illicit tobacco using attenuated total reflectance-Fourier transform infrared (ATR-FT-IR) spectroscopy.
Counterfeit and illicit tobacco may contain potentially toxic organic impurities that result in adverse health effects to the consumer. The aim of this work was to investigate the feasibility of the identification of organic impurities in counterfeit or illicit tobacco using attenuated total reflectance-Fourier transform infrared (ATR-FT-IR) spectroscopy.
Counterfeit tobacco is a public health threat that can have hazardous consequences on the consumer. In the UK, counterfeit cigarettes have a high prevalence of 15% and cost the taxpayers about £2 billion per year (1,2). Smoking in general remains one of the leading causes of preventable deaths. Tobacco smoking results in toxic consequences because of the presence of carcinogenic compounds such as nitrosamines and polycyclic aromatic hypdrocarbons (3,4). Moreover, it is expected that morbidity and mortality because of smoking tobacco will rise to 8 million per year in 2030 (5).
It is noteworthy to distinguish between counterfeit and illicit tobacco products. Illicit tobacco products represent tobacco products that are imported from non-European Union (EU) sources. These products may be authentic, but are smuggled into the country, and thus affect the legitimate trade and revenue of tobacco significantly. On the other hand, counterfeit tobacco products are not regulated and may contain all sorts of hazardous ingredients. In most cases, the manufacturing source of counterfeit tobacco is unknown. However, it was reported that the main sources of counterfeit tobacco in the UK were manufactured in the Far East (5). Counterfeit tobacco could contain potentially toxic impurities of elemental and organic nature. Elemental impurities reported in counterfeit tobacco include cadmium, lead, and thalium (6–8). Both cadmium and lead were reported as carcinogenic (9). Moreover, cadmium has shown to affect the cardiovascular and respiratory systems (3). On the other hand, organic impurities reported in counterfeit tobacco comprised the following compounds (10,11): ammonium salts, caffeine, chlorogenic acid, formic acid, glucose, isopropanol, methanol, propylene glycol, quinic acid, and sucrose. Also, counterfeit tobacco products were found to contain higher amounts of nicotine than authentic alternatives (10).
Subsequently, it is important to identify the organic and elemental toxic constituents in counterfeit tobacco. The literature focuses mainly on identifying elemental constituents in counterfeit tobacco, and few studies investigate the organic components. In this respect, elemental techniques used for the identification of counterfeit tobacco include inductively coupled plasma–optical emission spectrometry (ICP-OES) (6,12,13), and energy dispersive polarized X-ray fluorescence (EDPXRF) spectroscopy (8).
Most of the organic techniques used for the identification of counterfeit tobacco were destructive and included gas chromatography–flame ionization detection (GC–FID) for the determination of nicotine (6), light-emitting diode (LED)-induced fluorescence spectroscopy (14), liquid chromatography (LC) (15), and nuclear magnetic resonance (NMR) (10,16). However, these methods require time, money, and extensive sample preparation. Subsequently, nondestructive identification of counterfeit cigarettes was also done using near-infrared spectroscopy (NIR) (17–19). NIR spectroscopy is rapid and easy to apply, however it requires enough sample from each tobacco product. On the other hand, attenuated total reflectance-Fourier transform infrared (ATR-FT-IR) spectroscopy offers the advantage of measuring a small amount of sample (such as a few milligrams) in minimum time. Therefore, the aim of this work was to investigate the potential of ATR-FT-IR spectroscopy for the identification of potential toxic impurities in illicit and counterfeit tobacco products.
Experimental
Material
Reference substances for nicotine, rutin, and impurities commonly present in counterfeit tobacco were purchased from Sigma Aldrich. The impurities included ammonium hydroxide, formic acid, glucose, resorcinol, and sucrose. Moreover, 15 authentic, five illicit, and five counterfeit tobacco products were obtained from off-licence shops and the Food Standard Agency (FSA), respectively (Table I).
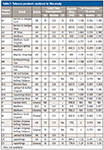
Table I: Tobacco products analyzed in this study
Instrumentation
Pure substances and products were measured using the Bruker MobileIR portable spectrometer equipped with a single-reflection pure diamond attenuated total reflectance (ATR) crystal sample interface. The spectral range of the instrument was 500–6000 cm-1 and the optical resolution was 1 cm-1.
Methods
Pure substances were measured as received without any treatment. For tobacco products, the content of each cigarette was homogenized and carefully transferred into Waters 4-mL glass vials and weighed using a Mettler Toledo balance with a sensitivity of 0.01 mg and weight maximum of 120 g. Then, each vial was mixed using a vortex mixer for 2 min and a few milligrams were taken for spectral measurement.
The spectra were then matched against the FT-IR instrument's spectra library using the instrument's hit quality index (HQI) algorithm. An HQI value of 95% was considered a positive match. Moreover, spectra were exported into Matlab R2014a for off-line analysis. Spectral pretreatment was made using the multiplicative scatter correction first derivative (MSC-D1) method. In addition, spectral treatment was made using correlation in wavelength space (CWS) and principal component analysis (PCA) methods. For CWS methods, the threshold used for correlation coefficient (r) value was 0.95.
Results and Discussion
The ATR-FT-IR technique offered a portable, easy-to-use, and rapid technique for the measurement of raw materials and tobacco products. Apart from homogenizing the tobacco leaves, no extensive sample treatment was required. Moreover, ATR-FT-IR did not require a large amount of sample for measurement. Thus, ATR-FT-IR offered an advantage over previous techniques used for identifying counterfeit tobacco including GC–FID, LC, NIR, and NMR spectroscopy.
The raw materials (Figure 1) demonstrated were chosen on the basis of impurities commonly present in counterfeit tobacco products (10,11). These substances could cause potential hazards to the consumer. Nicotine and rutin were present in both authentic and counterfeit tobacco products; however, their concentrations may vary among counterfeit products (10).
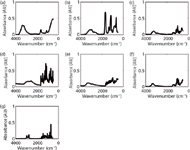
Figure 1: ATR-FT-IR spectra of (a) ammonium hydroxide, (b) formic acid, (c) glucose, (d) resorcinol, (e) rutin, (f) sucrose, and (g) nicotine measured using a portable FT-IR instrument.
A total of 15 authentic tobacco products from 11 brands were purchased from UK retailers. These included Benson & Hedges (Gold and Silver), JSP Silver, Marlboro (Red, Gold, and White Menthol), Mayfair, Richmond, Rothmans, Silk Cut (Purple), Golden Virginia, Winston Red, Lambert & Butler, and Superking (Black and Blue). In this respect, the diversity of brands was selected to account for variability among individual authentic brands and increase the accuracy of distinguishing them from counterfeit brands. The label claim of the authentic brands included carbon monoxide (5–10% m/m), nicotine (0.5–1.3% m/m), and tar (5–15% m/m), respectively (Table I).
Whereas the sources of the authentic products were from the UK, the illicit and counterfeit products were obtained from different countries, including Gulf Cooperation Council (GCC) countries, Greece, Poland, Ukraine, and the UK. Four illicit products were used and included three brands: Karelia Slims (one product), Marlboro Red (two products), and Marlboro Gold (one product). Moreover, five counterfeit products were obtained through the food standard agencies and included three brands: Golden Virginia (two products), Lambert & Butler (one product), and Superkings (one product).
FT-IR Activity of Authentic, Illicit, and Counterfeit Tobacco
The FT-IR activity of authentic, illicit, and counterfeit products was evaluated by comparing the number of peaks, absorption range, maximum peak intensity, and signal-to-noise ratio (S/N).
In this respect, there was not much variation observed in the spectral quality of authentic and illicit products. However, a marked difference was observed between the spectra of authentic and counterfeit products (Figure 2). Thus, the number of peaks for both authentic and illicit tobacco products' spectra was 12, whereas counterfeit tobacco had seven peaks. Moreover, authentic and illicit tobacco products' spectra showed higher absorption intensities than those of counterfeit tobacco products. Hence, the maximum absorption intensities of authentic and illicit tobacco products' spectra were 0.5 and 0.35 absorbance units, respectively. On the other hand, counterfeit tobacco products' spectra showed maximum absorbance intensities around 0.2 absorbance units. Conversely, the counterfeit tobacco products' spectra showed higher S/N values than the authentic and illicit products' spectra. Thus, the S/N values were in the range of 1.97–10.8, 1.8–6.1, and 1.89–20.9 for authentic, illicit, and counterfeit tobacco products, respectively. However, taking into account the remaining criteria (the number of peaks, absorption range, and maximum peak intensity) showed that the spectral quality of authentic and illicit products were much better than the counterfeit products. This, in turn, could interfere with the accuracy of the identification of tobacco products.
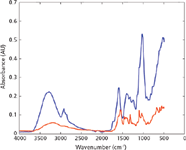
Figure 2: ATR-FT-IR spectra of authentic (blue) and counterfeit (red) tobacco products measured using an FT-IR portable instrument.
Instrumental Built-In Algorithm
The instrument built-in algorithm used the HQI method, which is based on comparing the correlation coefficient between the test spectrum and the library spectrum of a pure substance. The test spectrum could give matches to one or more substances. In this respect, an HQI value of 100% meant that the test substance was identical to the library substance. Furthermore, HQI values of 95–100%, 80–95%, 60–80%, and less than 60% indicated high similarity, similarity, slight similarity, and dissimilarity, respectively.
To evaluate the accuracy of the inbuilt algorithm, the seven pure substances of known identity were compared against the library (Table II). Six of the pure substances (ammonium hydroxide, glucose, nicotine, resorcinol, rutin, and sucrose) gave high similarity to their own library spectra. The remaining substance (formic acid) yielded a slightly similar match to its library spectrum (HQI = 79.5). This result showed that ATR-FT-IR could identify the pure substances within an accuracy of 86%.

Table II: Matches and match values of pure substances and tobacco products against the library spectra obtained using the instrument’s in-built algorithm
However, when the tobacco products were compared against the library, they did not match any of the constituents of authentic tobacco, including nicotine and rutin. This could be because the latter two constituents were present in a low level in tobacco and were therefore not detectable using FT-IR. Most authentic samples gave matches for two substances (cachou and henna red), but with variable HQI vlaues. The mean match for authentic tobacco against cachou and henna red were 78.1% (0–95.7%) and 83.1% (0–94.4%), respectively. This result was because of the common ingredients present in cachou and tobacco products (20). The individual matches between the individual authentic products against cachou and henna red were variable. Thus, some products matched both cachou and henna red, whereas others matched only one. For instance, A4 (Marlboro Red) gave the highest match against both cachou (HQI = 94.2) and henna red (HQI = 94.2). Also, A2 (Benson & Hedges Silver) matched only cachou and had an HQI value of 94.1%. On the other hand, A3 (JSP Silver) and A13 (Lambert & Butler Original) matched only henna red and had HQI values of 86.8% and 74.7%, respectively. In addition, the illicit products gave lower HQI values than the authentic products against both cachou and henna red. The mean HQI values of the illicit products against cachou and henna red were 69.5% (0–94.2%) and 80.7% (71.3–91%), respectively. However, the counterfeit products gave much lower HQI values than the authentic and illicit products. For instance, C1 (Golden Virginia Rolling Tobacco) did not give any match to library spectra. Also, C4 (Superkings) and C5 (Superkings) matched only cachou with HQI values of 75.2% and 74.8%, respectively. In addition, C2 (Golden Virginia Rolling Tobacco) and C3 (Lambert & Butler) matched both cachou and henna red, but with HQI values below 90%. Overall, the mean HQI values for counterfeit against cachou and henna red were 62.4% (0–87.5%) and 28.5% (0–73.3%), respectively. This approach allowed differentiation of the samples from authentic products; however, it did not allow identifying potential impurities that could be present in counterfeit products.
Therefore, off-line analysis was used by comparing the spectra of tobacco products with potential impurities present in counterfeit tobacco as well as major constituents of authentic tobacco. These constituents were ammonium hydroxide, formic acid, glucose, resorcinol, rutin, sucrose, and nicotine.
Correlation in Wavelength Space
In this respect, the CWS method compared the mean spectra of each of the aforementioned impurities and constituents to the spectra of authentic, illicit, and counterfeit tobacco. Figure 3 shows the correlation map of pure substances (1–7), authentic tobacco (8–22), illicit tobacco (23–26), and counterfeit tobacco (27–31). Figure 3a shows a range of colors for r values as follows: dark blue (-0.4–-0.1), light blue (-0.1–0.2), light green (0.2–0.5), yellow (0.5–0.6), orange (0.6–0.8), and red (0.8–1). In addition, Figure 3b shows r values greater than 0.95 highlighted in red.

Figure 3: Correlation map of the MSC-D1 FT-IR spectra of pure substances: (1) ammonium hydroxide, (2) formic acid, (3) glucose, (4) resorcinol, (5) rutin, (6) sucrose, (7) nicotine, (8â22) authentic tobacco, (23â26) illicit tobacco, and (27â31) counterfeit tobacco measured using a portable FT-IR instrument equipped with an ATR sample interface.
The CWS method showed high accuracy when applied to pure substances (Figures 3a, 1–7, and 3b, 1–7). Thus, the maximum r value between two different pure substances was 0.21. Also, 14 out of the 15 authentic products (Figures 3a, 8–22, and 3b, 8–22) gave r values above 0.95. Thus, product A11 (Golden Virginia Rolling Tobacco) gave r values between 0.90–0.94 against the remaining authentic batches. This showed that FT-IR could identify counterfeit tobacco with an accuracy of 93%. None of the authentic tobacco gave a high match for rutin and nicotine. The maximum r value for authentic products against rutin was 0.15 (observed for A7) and that against nicotine was 0.07 (observed for A1). This result indicated a limitation of the combination CWS and FT-IR for identifying constituents present in low concentrations in tobacco. Thus, both nicotine and rutin were present in less than 2% m/m in tobacco.
The combination of CWS and FT-IR was able to discriminate illicit and counterfeit products from authentic tobacco alternatives (Figures 3a, 23–26, and 3b, 23–26). Whereas high similarity was observed among the authentic tobacco products, illicit tobacco products (I1–I4) were not similar and showed a maximum r value of 0.92 (observed for I2 against I3). Moreover, when the illicit products were compared against the pure substances and authentic tobacco, only three mismatches (r > 0.95) were observed for I3 (Marlboro Red) against A8 (Richmond), A10 (Silk Cut), and A13 (Lambert & Butler). Similarly, counterfeit tobacco (Figures 3a, 27–31, and 3b, 27–31) showed only one mismatch against authentic tobacco (r > 0.95); and this was observed for C3 (Lambert & Butler) against A8 (Richmond), A10 (Silk Cut Purple), A13 (Lambert & Butler), and I3 (Marlboro). Consequently, the accuracy of identifying counterfeit and illicit products using CWS and FT-IR was 78%.
Principal Component Analysis
PCA was applied to the FT-IR spectra to investigate the potential of discrimination using FT-IR between authentic, illicit, and counterfeit products. The first three principal components accounted for 65.2% of the variance (Figure 4). The PCA scores of three tobacco products showed an overlap with the scores of counterfeit tobacco. These corresponded to A8 (Richmond), A10 (Silk Cut Purple), and A13 (Lambert & Butler), which showed a mismatch in the CWS method with C3 (Lambert & Butler). On the other hand, no mismatches were observed in the PCA scores of illicit and authentic tobacco. This showed that PCA was a slightly more accurate method than CWS for identifying illicit and counterfeit tobacco.
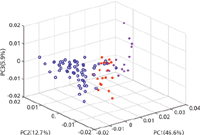
Figure 4: PCA scores plot of the MSC-D1 treated FT-IR spectra of authentic (blue), illicit (magenta), and counterfeit (red) tobacco products measured using a portable FT-IR instrument equipped with an ATR sample interface.
Conclusion
Counterfeit tobacco represents a major public health threat and contributes to the increased rates of morbidity and mortality worldwide. ATR-FT-IR spectroscopy offered a rapid, simple, and nondestructive method for analysis of counterfeit tobacco. Both the built-in identification and off-line analysis failed to identify organic constituents in tobacco products. However, off-line analysis was able to distinguish between the authentic, illicit, and counterfeit tobacco products with an accuracy of 80%.
Sulaf Assi is an associate lecturer in forensic science with the Faculty of Science and Technology at Bournemouth University in Poole, UK. Phil Moorey is a student in forensic science with the Faculty of Science and Technology at Bournemouth University. Paul Kneller is a senior lecturer in forensic science with the Faculty of Science and Technology at Bournemouth University. David Osselton is the head of forensic and biological sciences with the Faculty of Science and Technology at Bournemouth University. Direct correspondence to: sassi@bournemouth.ac.uk
References
(1) HM Customs & Revenue. Tackling Tobacco Smuggling– building on our success, (2011).
(2) HM Customs & Excise. The Commissioners of HM Customs and Excise, London, 2003.
(3) J. Fowles and B. Dybing, Tobacco Control 12, 424–30 (2003).
(4) S. Hecht, Journal of Natural Cancer Institute 91, 1194–1210 (1999).
(5) World Health Organisation (WHO), Report on the global tobacco epidemic (2008).
(6) R. Pappas, G. Polzin, C. Watson and D. Ashley, Food Chem. Toxicol. 45, 202–209 (2007).
(7) E. Semu and B. Singh, Fertiliser Research 44, 241–248 (1996).
(8) W. Stephen, A. Calder, and J. Newton, Environ. Sci. Technol. 39, 479–488 (2005).
(9) The International Agency for Research on Cancer (IARC), "IARC Monograph on the evaluation of carcinogenic risks to humans" (2004).
(10) L. Shintu, S. Caldarelli, and M. Campredon, Anal. Bioanal. Chem. 405, 9093–9100 (2013).
(11) J. Van Amsterdam et al., Food Chem. Toxicol. 49, 3025–3030 (2011).
(12) K. Swami, C. Judd, and J. Orsini, Spectrosc. Lett. 42, 479–490 (2009).
(13) S. Musharraf, M. Shoaib, A. Siddiqui, M. Najam-ul-Haq, and A. Ahmed, Chem. Cent. J. 6, 56–67 (2012).
(14) W. Zhong, Y. Dong, X. Liu, H. Lin, L. Mei, and C. Yan, Proc. SPIE 9003, Light-Emitting Diodes: Materials, Devices, and Applications for Solid State Lighting XVIII, 90031O (2014).
(15) G. Pieraccini et al., J. Chromatogr. A 1180, 138–150 (2008).
(16) T. Adam, T. Ferge, S. Mitschkt, T. Streibel, R. Baker, and R. Zimmermann, Anal. Bioanal. Chem. 381, 487–1499 (2005).
(17) E. Moreira, M. Pontes, R. Galvão, and M. Araújo, Talanta 79, 1260–1264 (2009).
(18) Y. Shao, Y. He, and Y. Wang, Eur. Food Res. Technol. 224, 591–596 (2007).
(19) Q. Yuhuaab, D. Xiangqianb, and G. Huilib, Spectrosc. Lett. 46, 397–402 (2013).
(20) F. Radford, James Joyce Quarterly 32, 736–738 (1983).

AI Shakes Up Spectroscopy as New Tools Reveal the Secret Life of Molecules
April 14th 2025A leading-edge review led by researchers at Oak Ridge National Laboratory and MIT explores how artificial intelligence is revolutionizing the study of molecular vibrations and phonon dynamics. From infrared and Raman spectroscopy to neutron and X-ray scattering, AI is transforming how scientists interpret vibrational spectra and predict material behaviors.
Real-Time Battery Health Tracking Using Fiber-Optic Sensors
April 9th 2025A new study by researchers from Palo Alto Research Center (PARC, a Xerox Company) and LG Chem Power presents a novel method for real-time battery monitoring using embedded fiber-optic sensors. This approach enhances state-of-charge (SOC) and state-of-health (SOH) estimations, potentially improving the efficiency and lifespan of lithium-ion batteries in electric vehicles (xEVs).
New Study Provides Insights into Chiral Smectic Phases
March 31st 2025Researchers from the Institute of Nuclear Physics Polish Academy of Sciences have unveiled new insights into the molecular arrangement of the 7HH6 compound’s smectic phases using X-ray diffraction (XRD) and infrared (IR) spectroscopy.